Download as PDF, PPTX


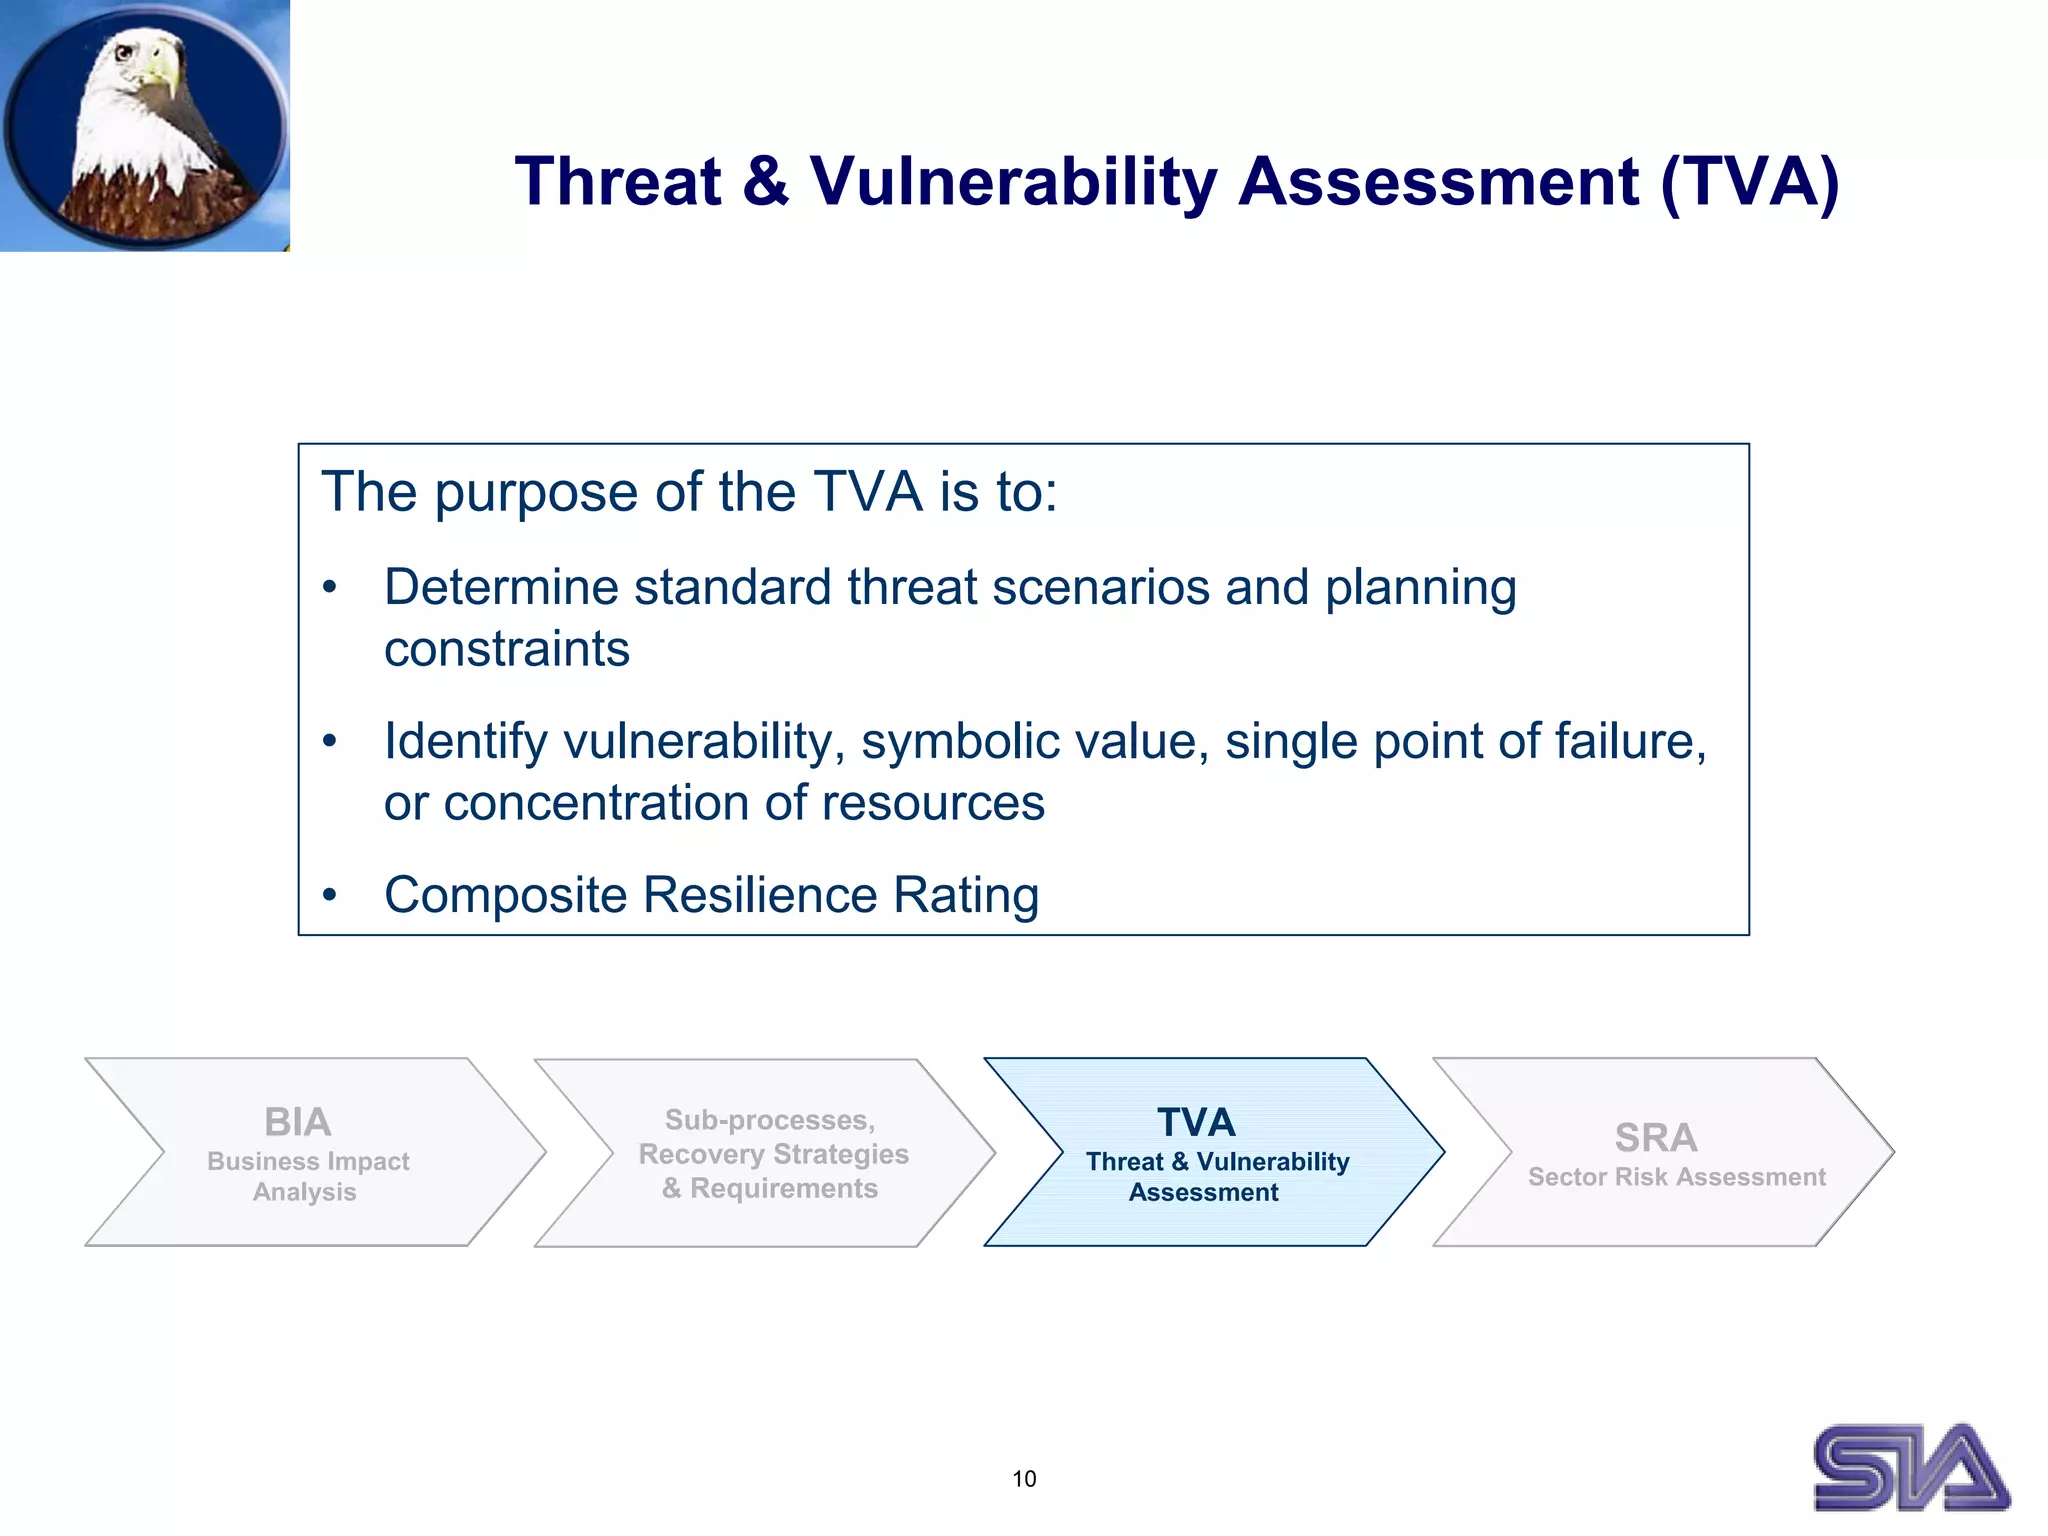
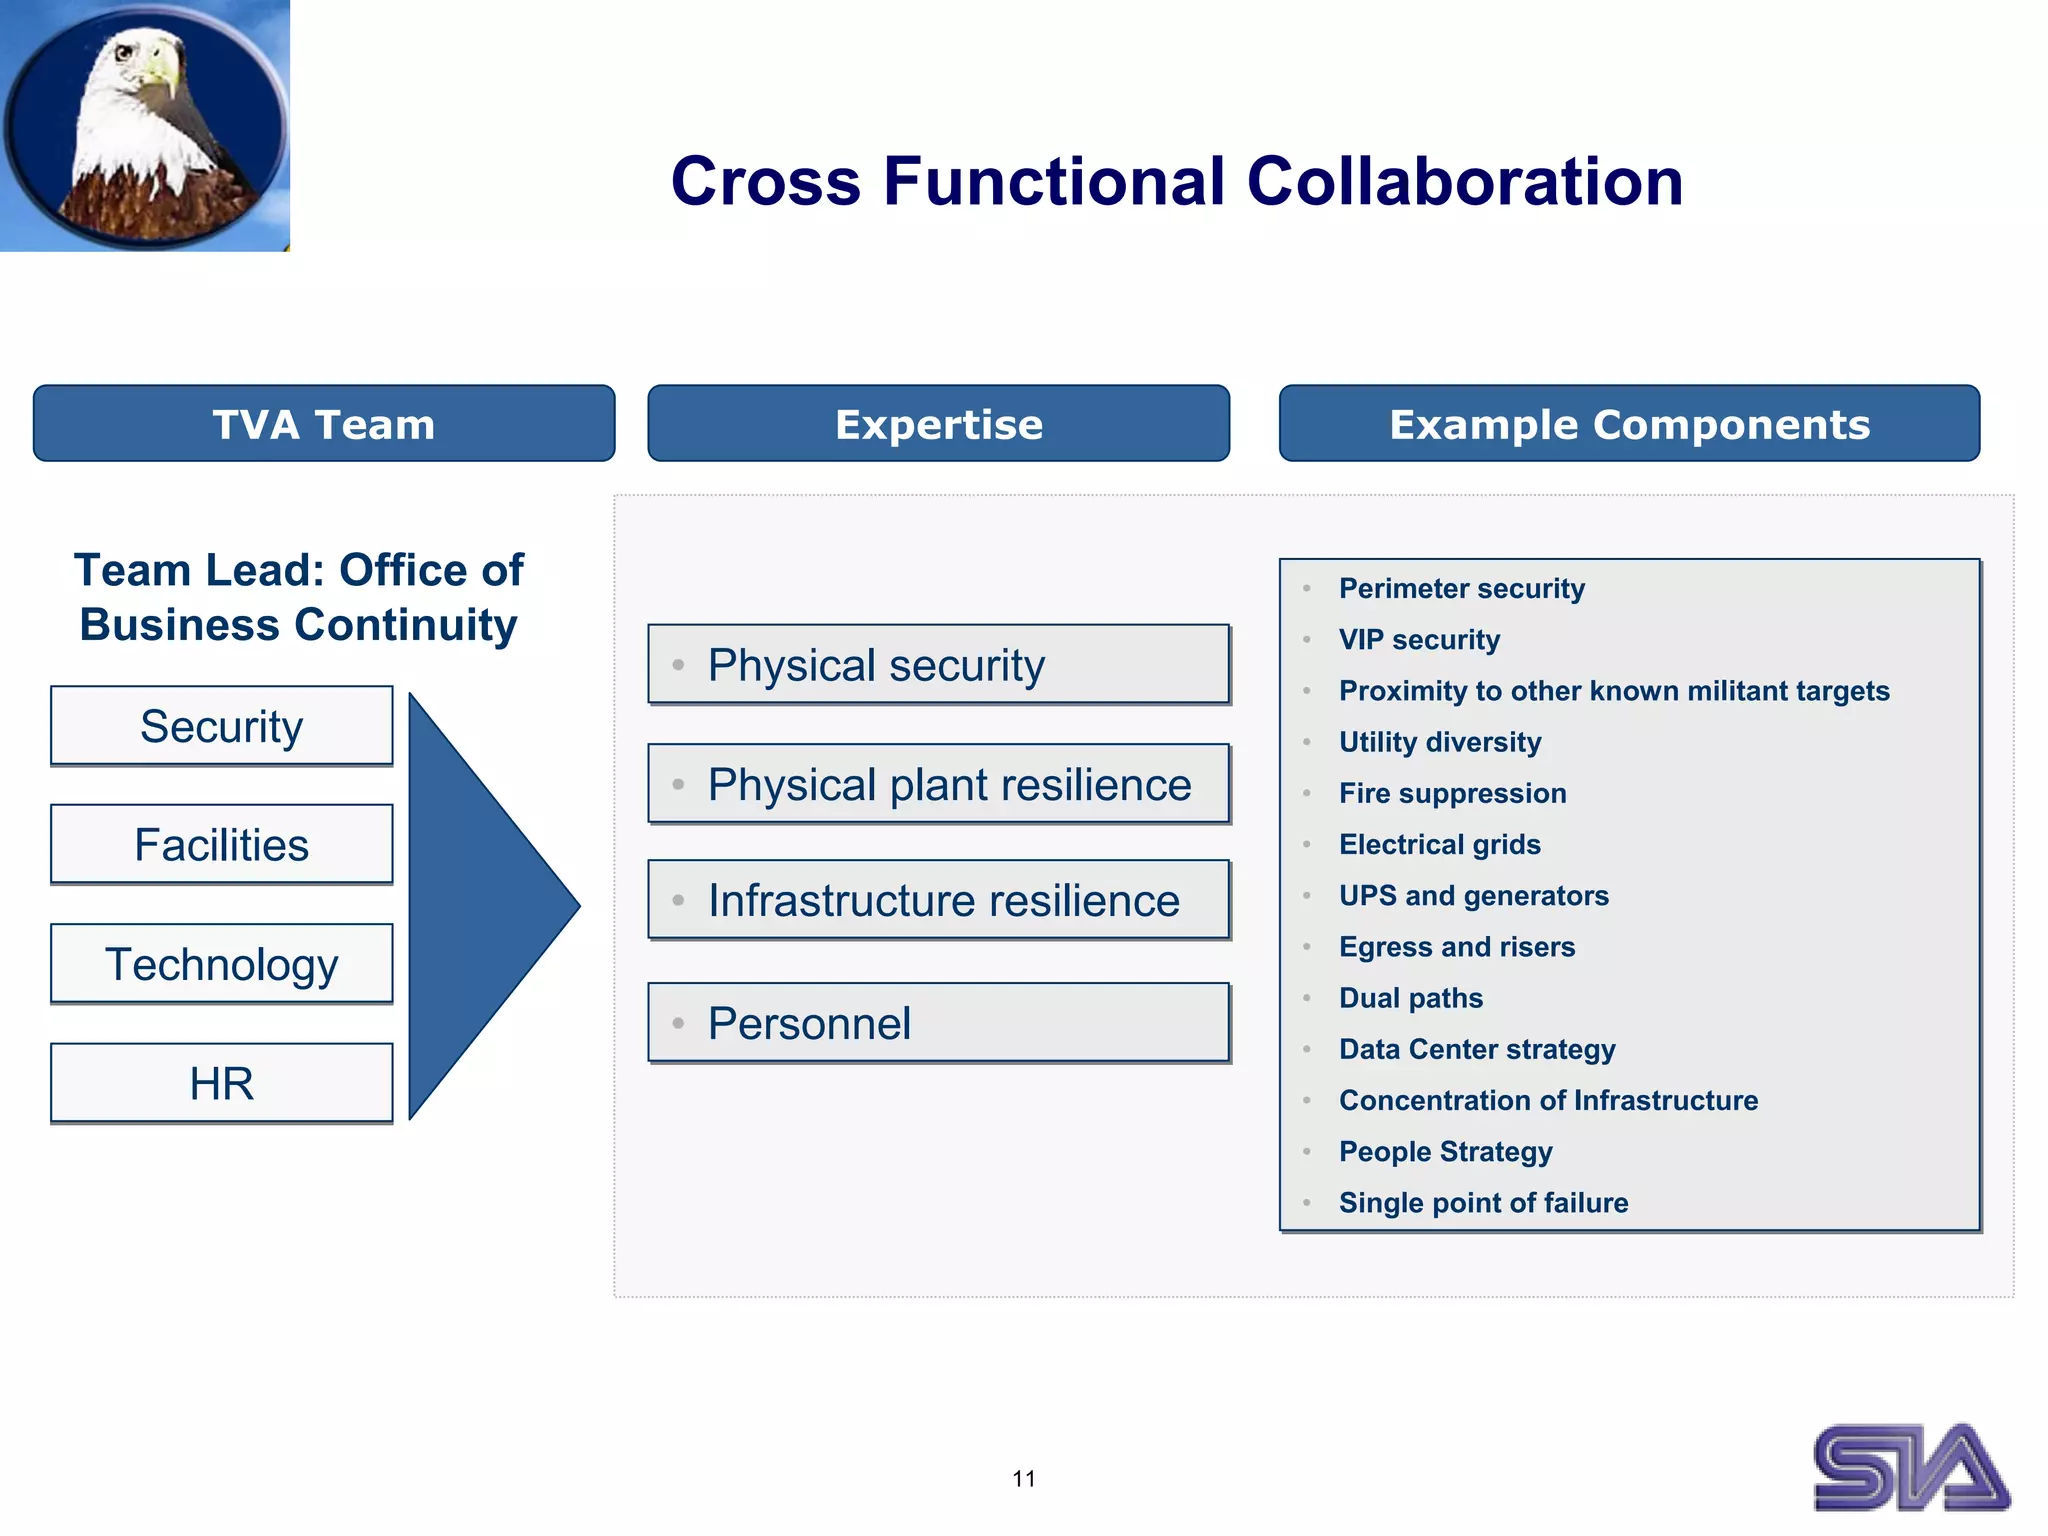
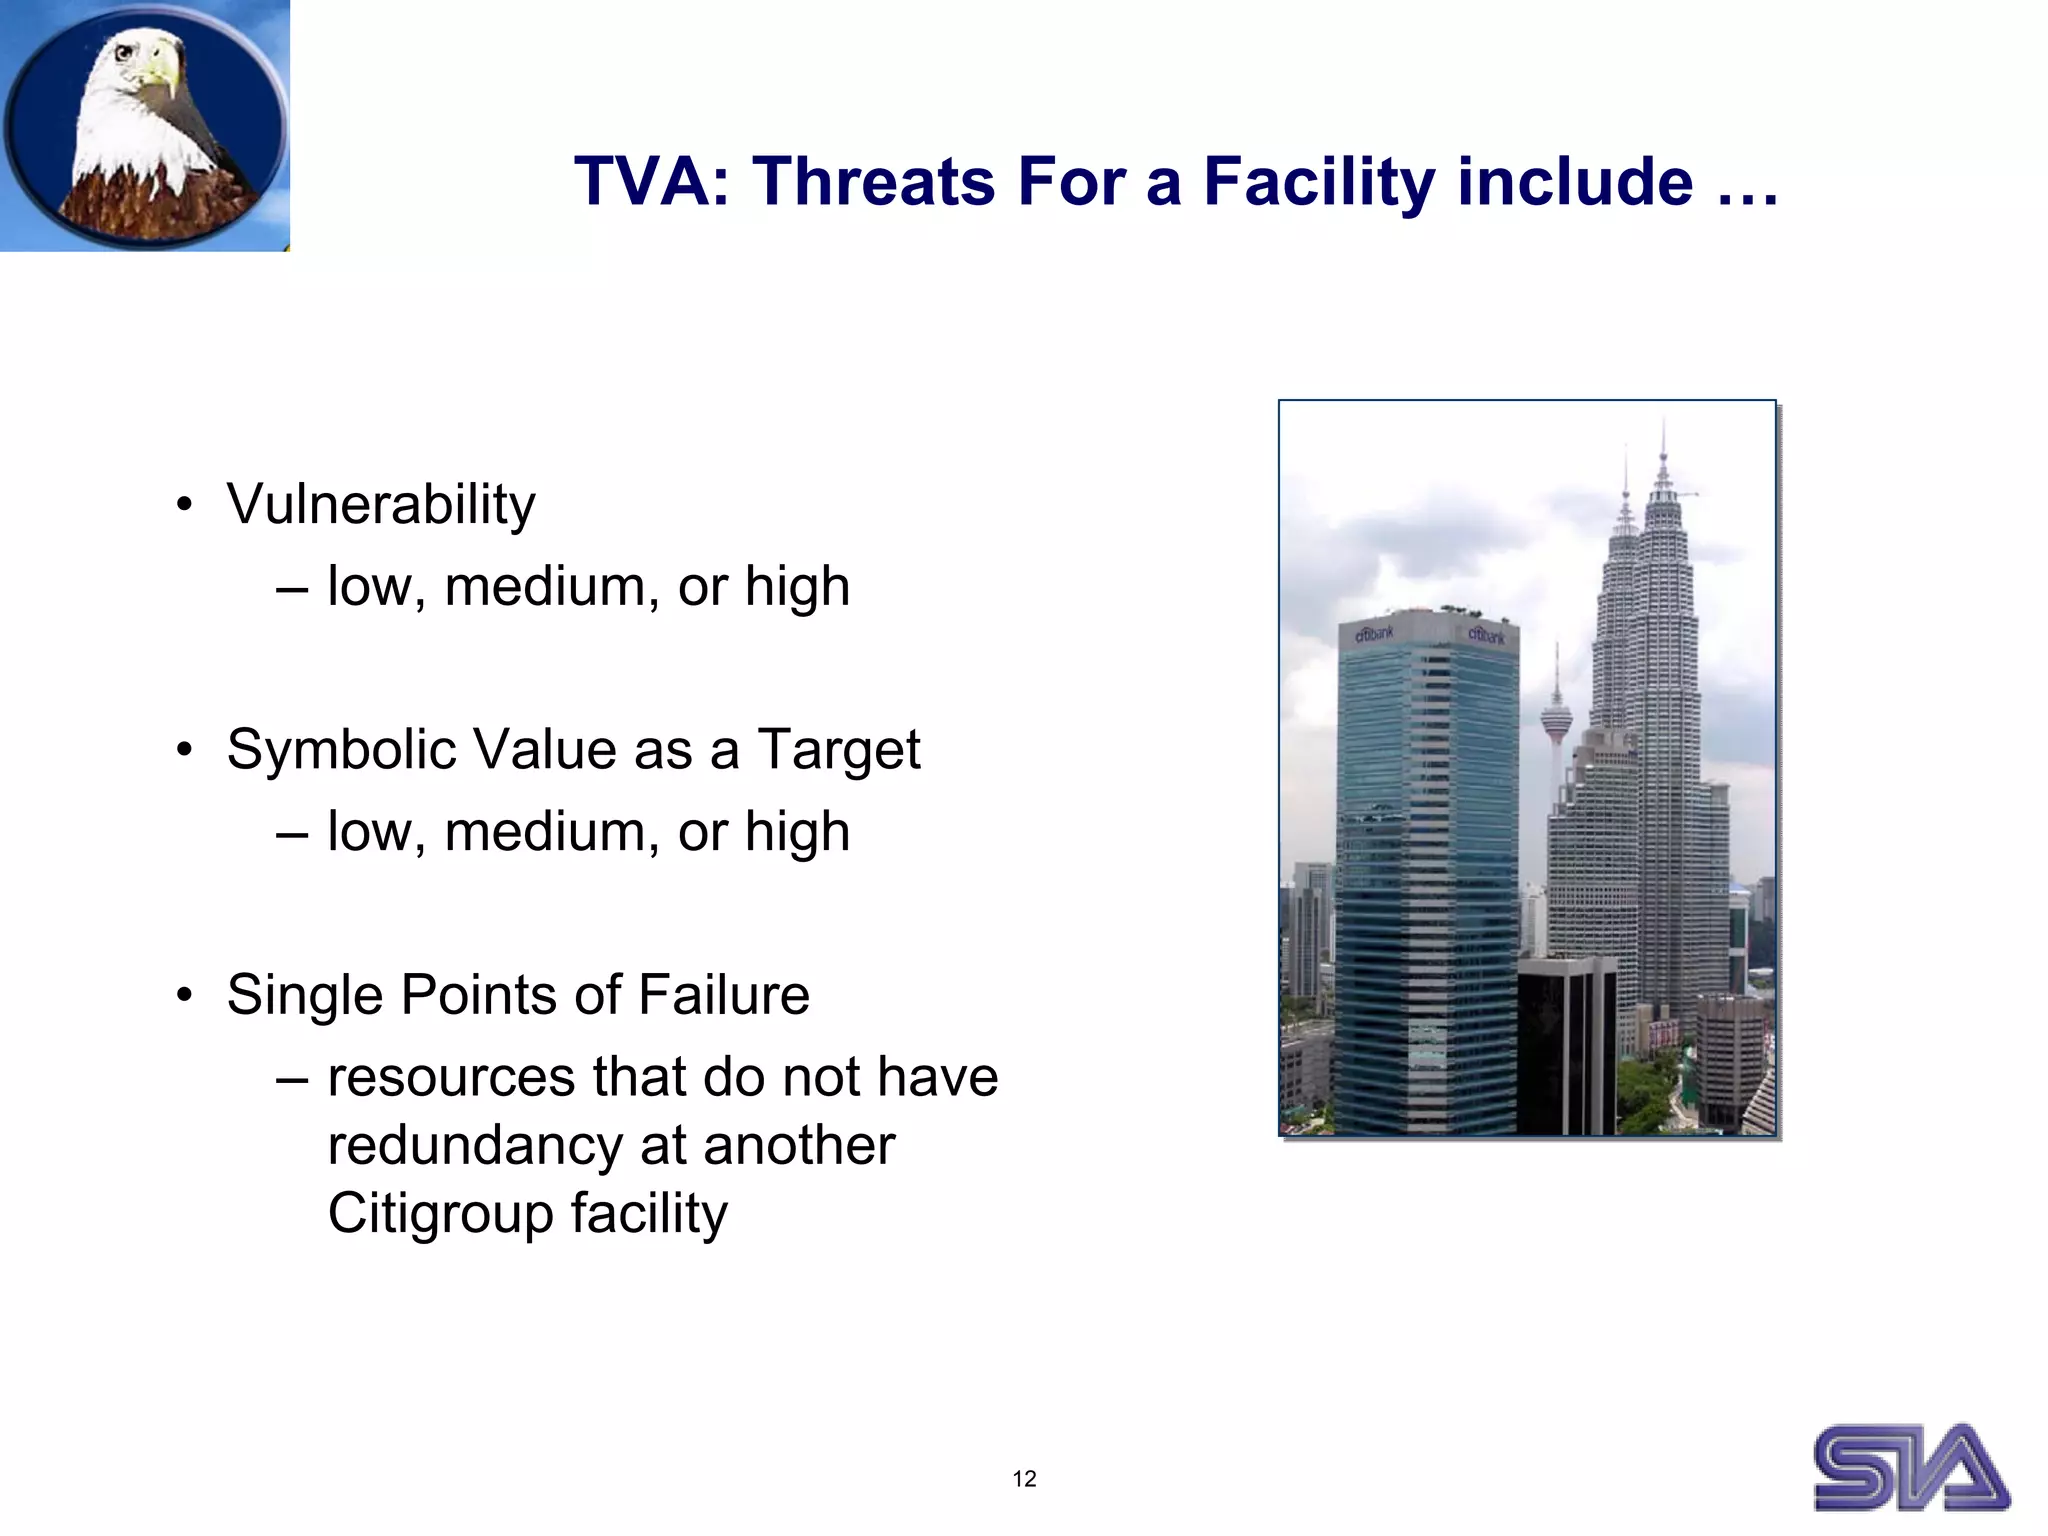

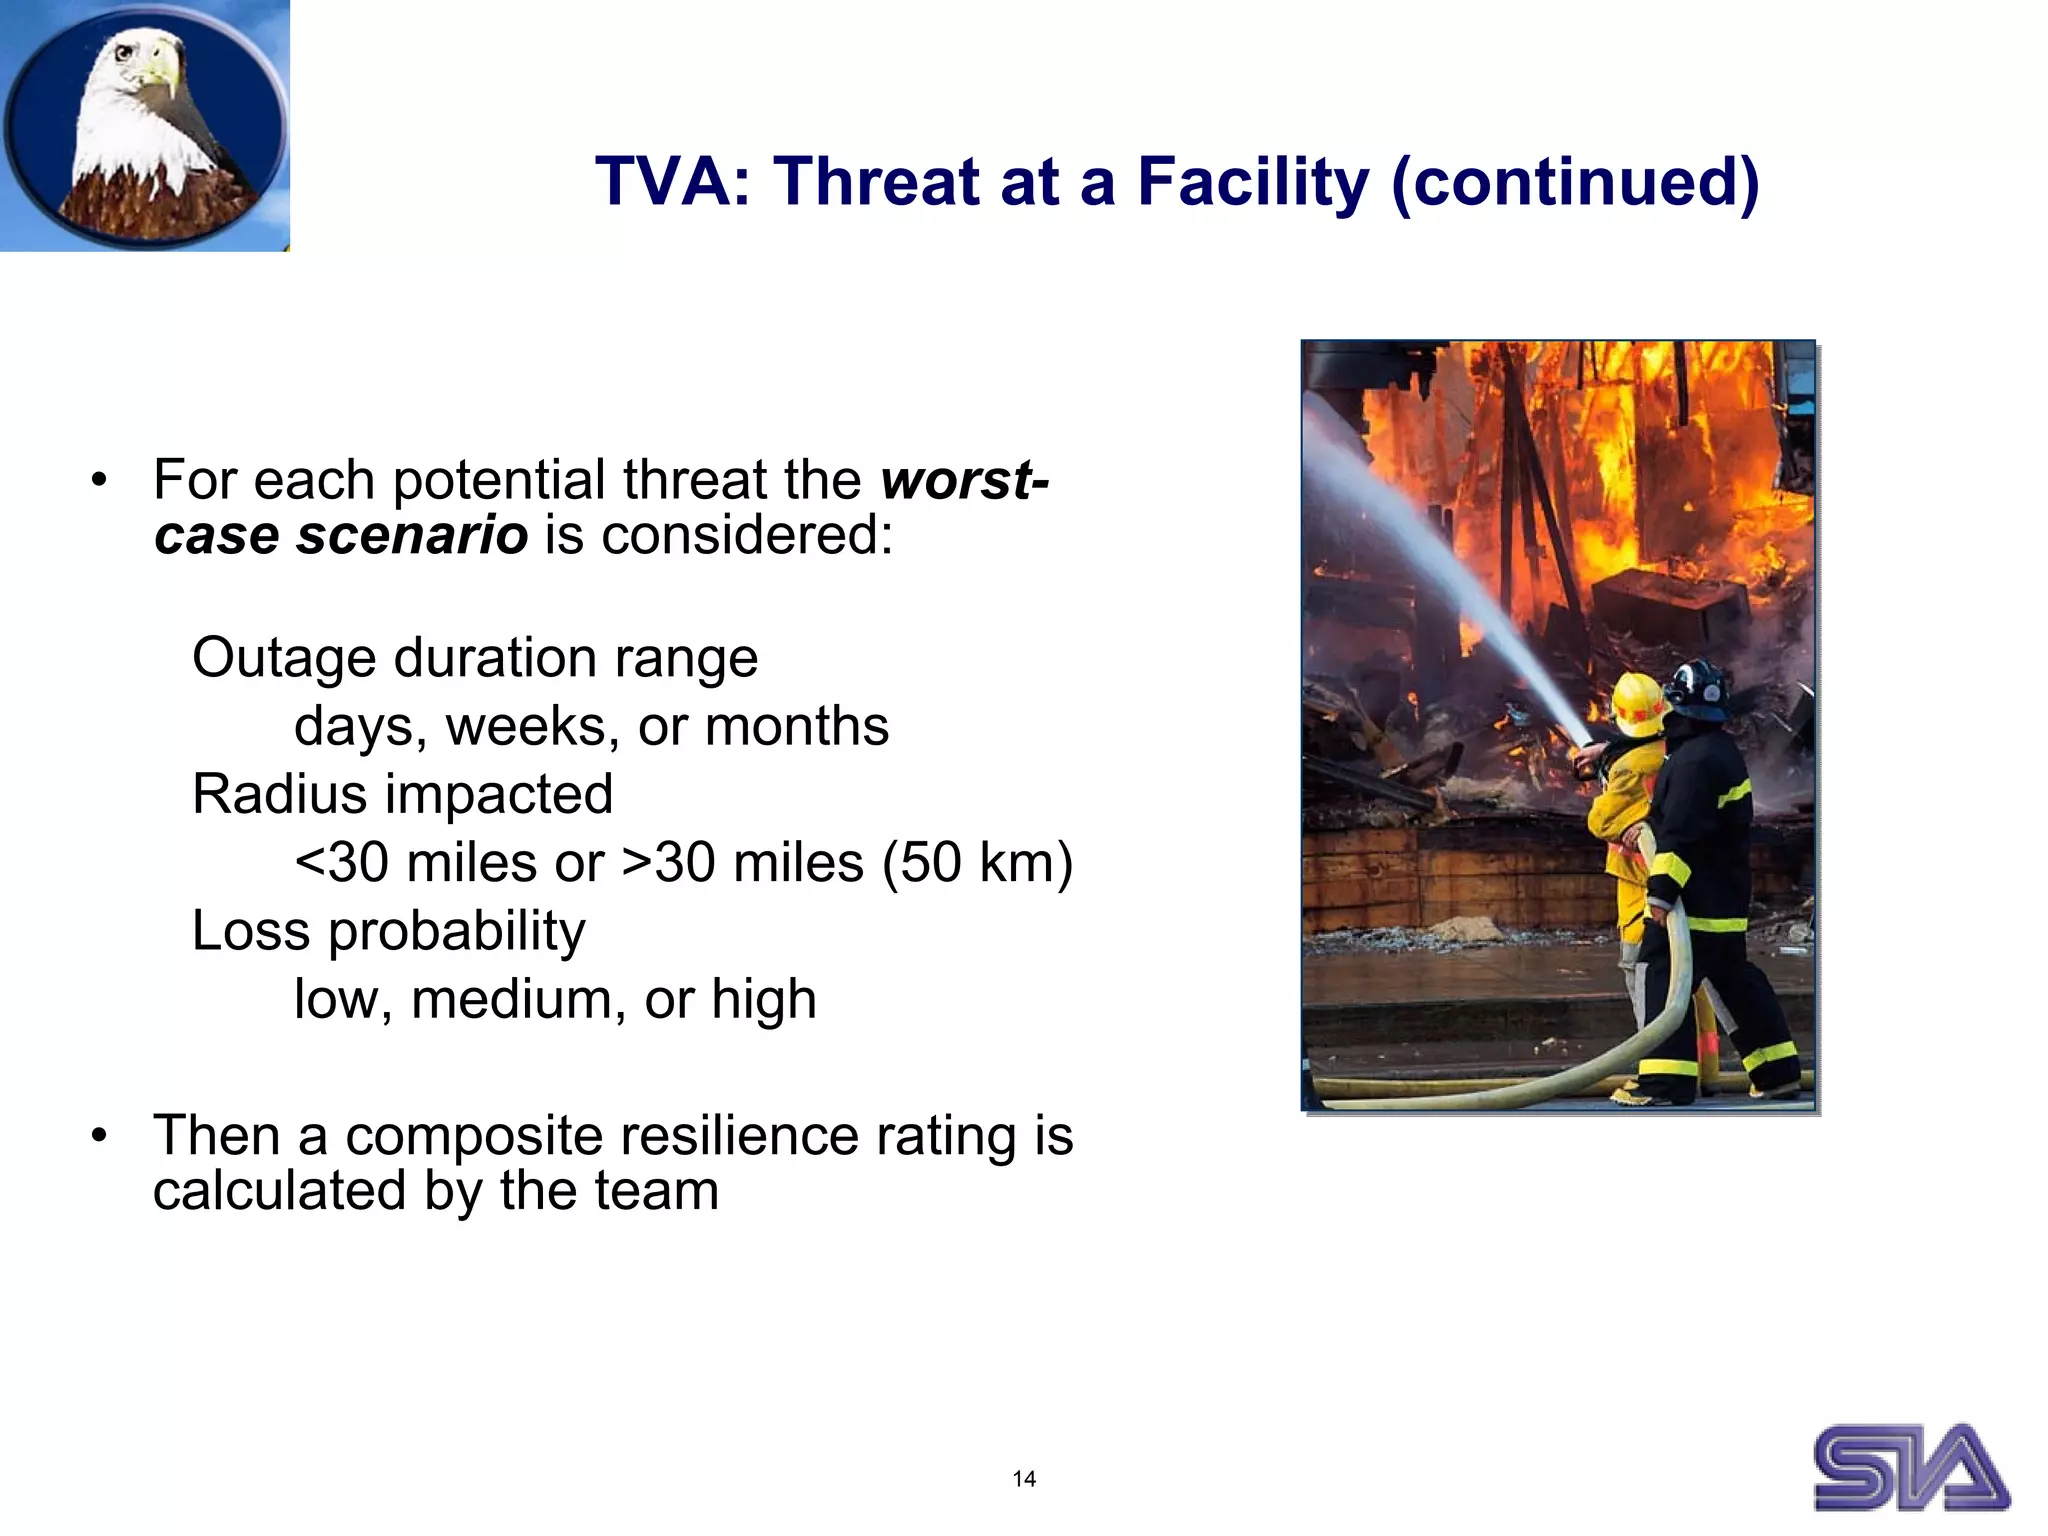
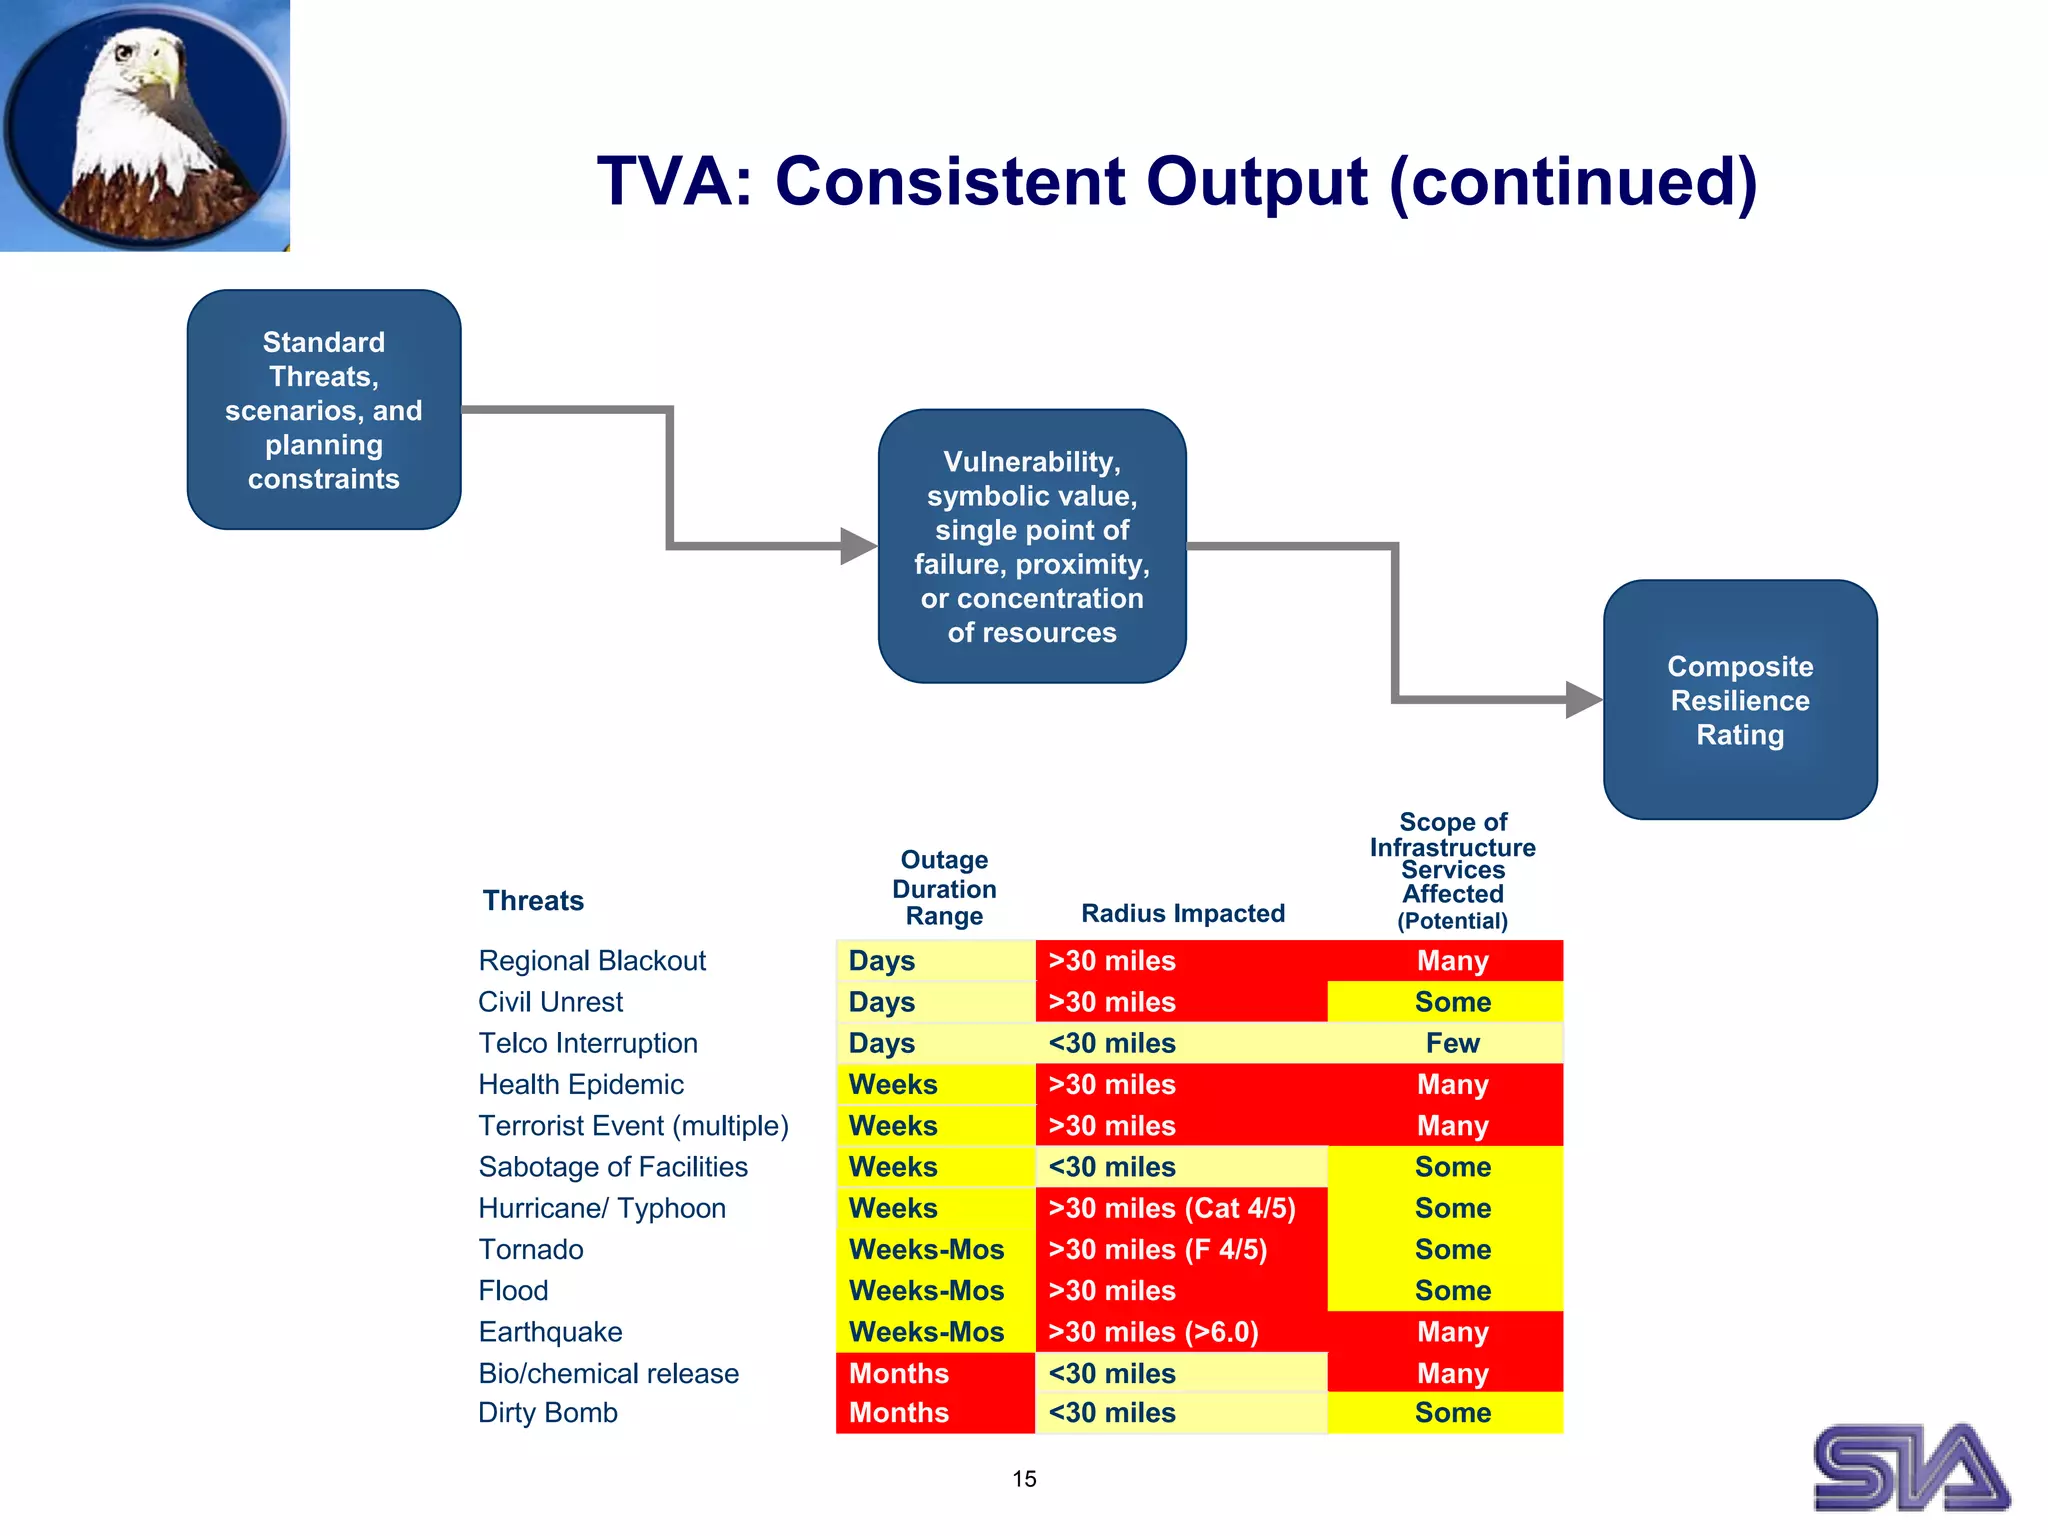

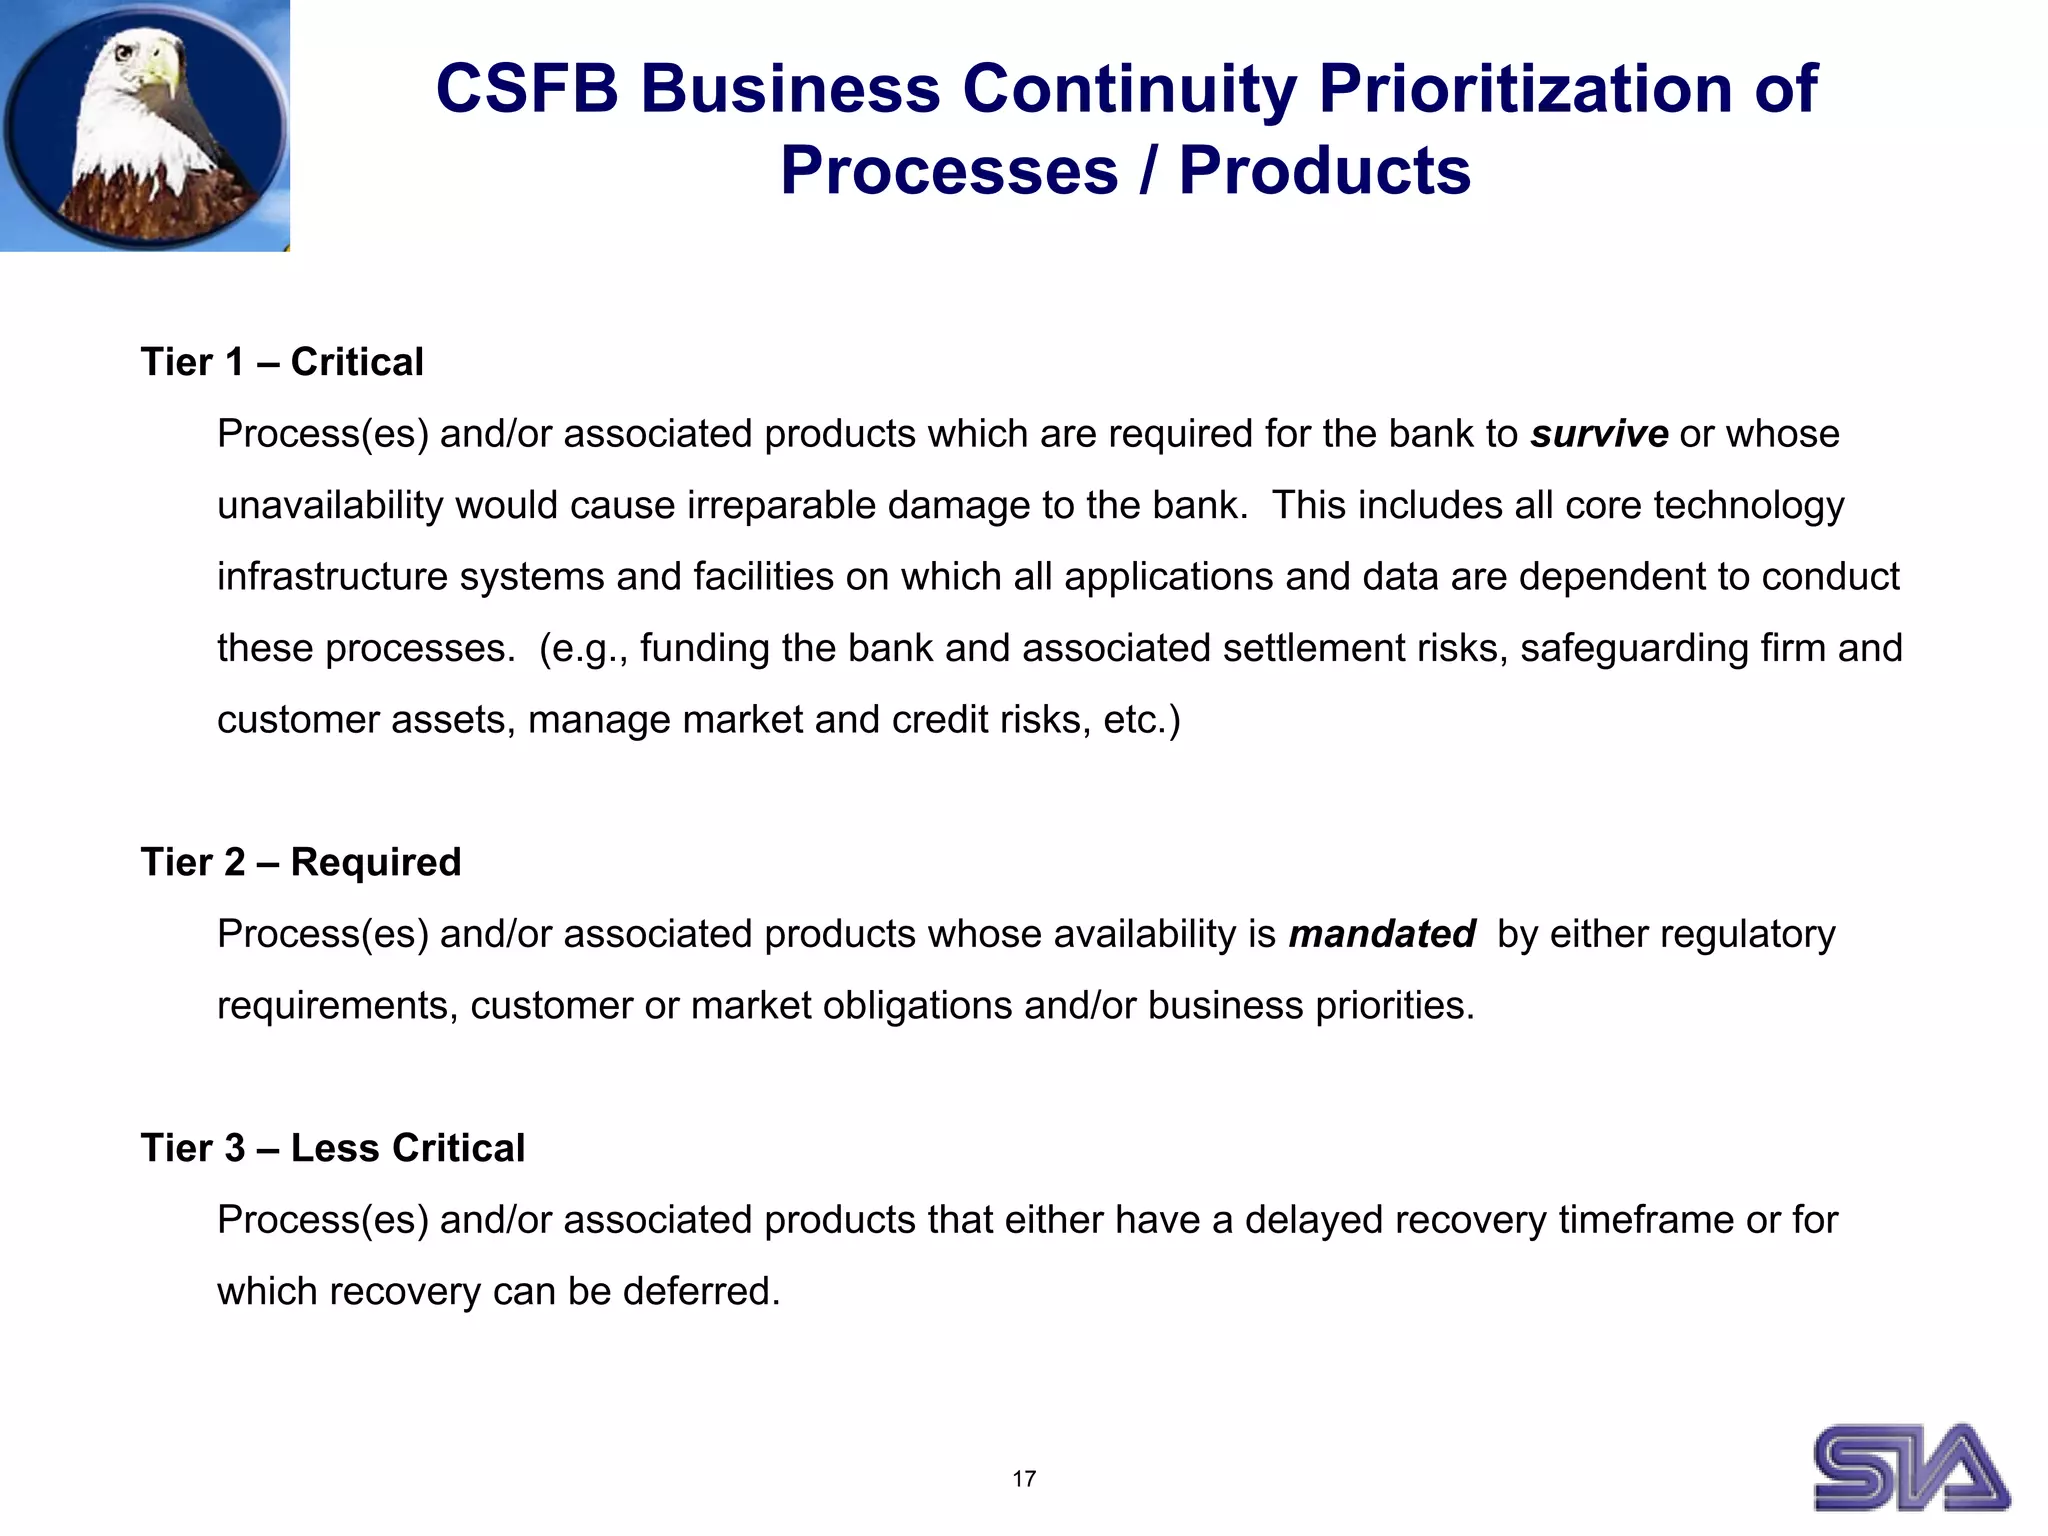


This document summarizes business continuity risk assessment approaches from three major financial institutions: 1. Morgan Stanley prioritizes business risks into three categories based on the level of mitigation and response solutions in place. Risk analysis is performed at the regional and divisional levels. 2. Citigroup conducts a Threat and Vulnerability Assessment (TVA) to identify risks and their probabilities and impacts. A cross-functional team evaluates factors like security, facilities, technology, and human resources. 3. Credit Suisse First Boston (CSFB) prioritizes processes into three tiers based on their criticality. It considers both the business importance of locations and threats associated with them to weigh risks. CSF


