Download to read offline


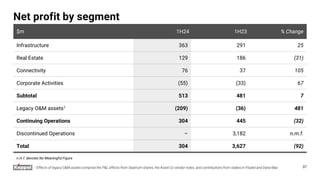
![1H24 net profit (horizontal reporting)
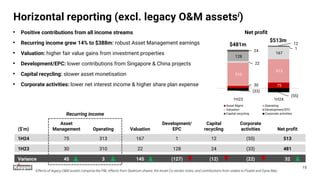
($’m) Asset Mgmt Operating1 Valuation Development
/EPC
Capital
recycling
Net profit
Infrastructure 44 307 12 (1) 1 363 71%
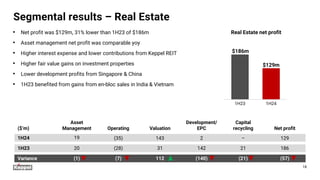
Real Estate 19 (35) 143 2 – 129 25%
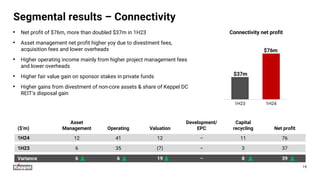
Connectivity 12 41 12 – 11 76 15%
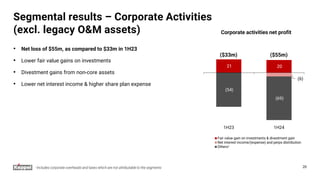
Corporate activities2
(55) (11%)
Sub-Total3
75 313 167 1 12 513 100%
Legacy O&M assets4
(209)
Net profit 75 313 167 1 12 304
16
(1) Includes returns from equity-accounted stakes in listed and private funds - Infrastructure [$8m from listed funds and -$4m from private funds]; Real Estate [$4m from listed
funds and -$3m from private funds], and Connectivity [$11m from listed funds and -$3m from private funds].
(2) Includes contributions from investments held at corporate level, and overheads and financing costs which have not been attributed to segments.
(3) Excluding effects of legacy O&M assets.
(4) Effects of legacy O&M assets comprise the P&L effects from Seatrium shares, the Asset Co vendor notes, and contributions from stakes in Floatel and Dyna-Mac.](https://image.slidesharecdn.com/2keppelltd1h24presentationslides-240926095033-35d7cef7/85/2-keppel-ltd-1h24-presentation-slides-pdf-16-320.jpg)


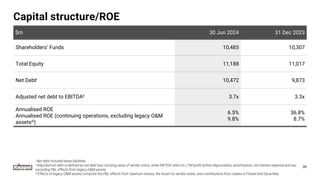
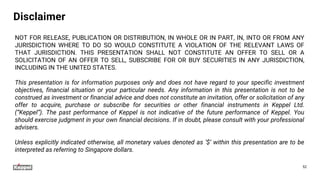
![1H23 net profit (horizontal reporting)
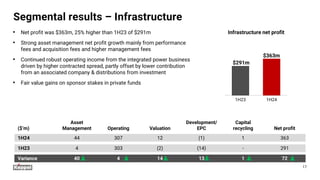
($’m) Asset Mgmt Operating¹ Valuation
Development
/EPC
Capital
recycling Net profit
Infrastructure 4 303 (2) (14) - 291 60%
Real Estate 20 (28) 31 142 21 186 39%
Connectivity 6 35 (7) - 3 37 8%
Corporate activities² (33) (7%)
Sub-Total3 30 310 22 128 24 481 100%
Legacy O&M assets4 (36)
Discontinued operations 3,182
Net profit 30 310 22 128 24 3,627
38
(1) Includes returns from equity-accounted stakes in listed and private funds - Infrastructure [$28m from listed funds and -$1m from private funds]; Real Estate [$14m from
listed funds and -$2m from private funds], and Connectivity [$9m from listed funds and $1m from private funds]
(2) Includes contributions from investments held at corporate level, and overheads and financing costs which have not been attributed to segments
(3) Excluding effects of legacy O&M assets
(4) Effects of legacy O&M assets comprise the P&L effects from Seatrium shares, the Asset Co vendor notes, and contributions from stakes in Floatel and Dyna-Mac](https://image.slidesharecdn.com/2keppelltd1h24presentationslides-240926095033-35d7cef7/85/2-keppel-ltd-1h24-presentation-slides-pdf-38-320.jpg)


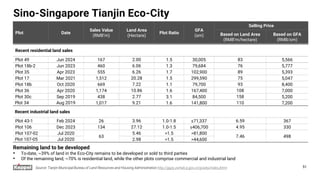

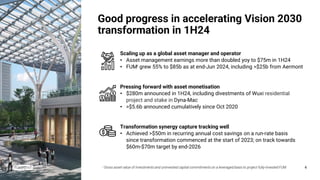
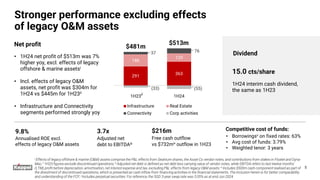
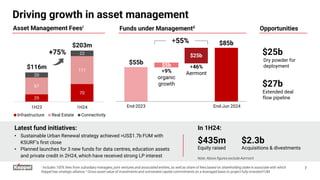
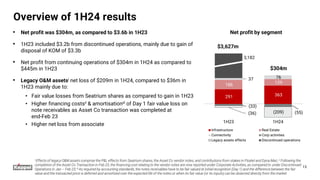
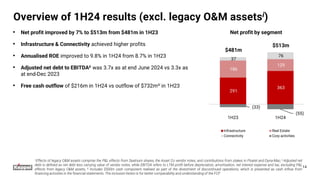
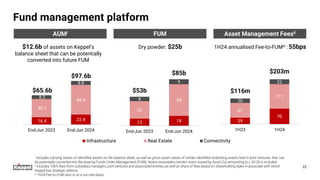
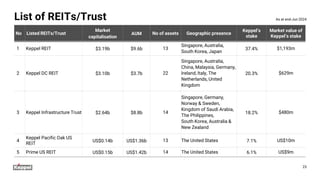
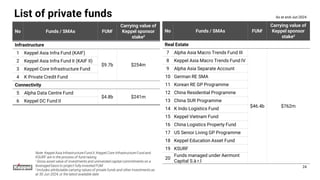
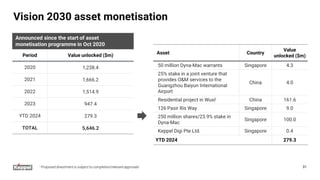
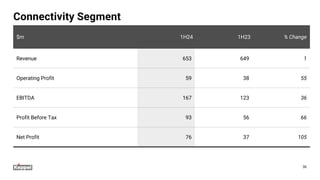
In the first half of 2024, the company's asset management earnings more than doubled year-on-year to $75 million, and funds under management grew 55% to $85 billion. Despite reporting a net profit of $304 million due to legacy assets, net profit from continuing operations rose 7% to $513 million, driven by strong performances in the infrastructure and connectivity segments. The firm is on track to achieve $60-$70 million in annual cost savings by 2026 and has secured $280 million in asset divestitures this half-year.


