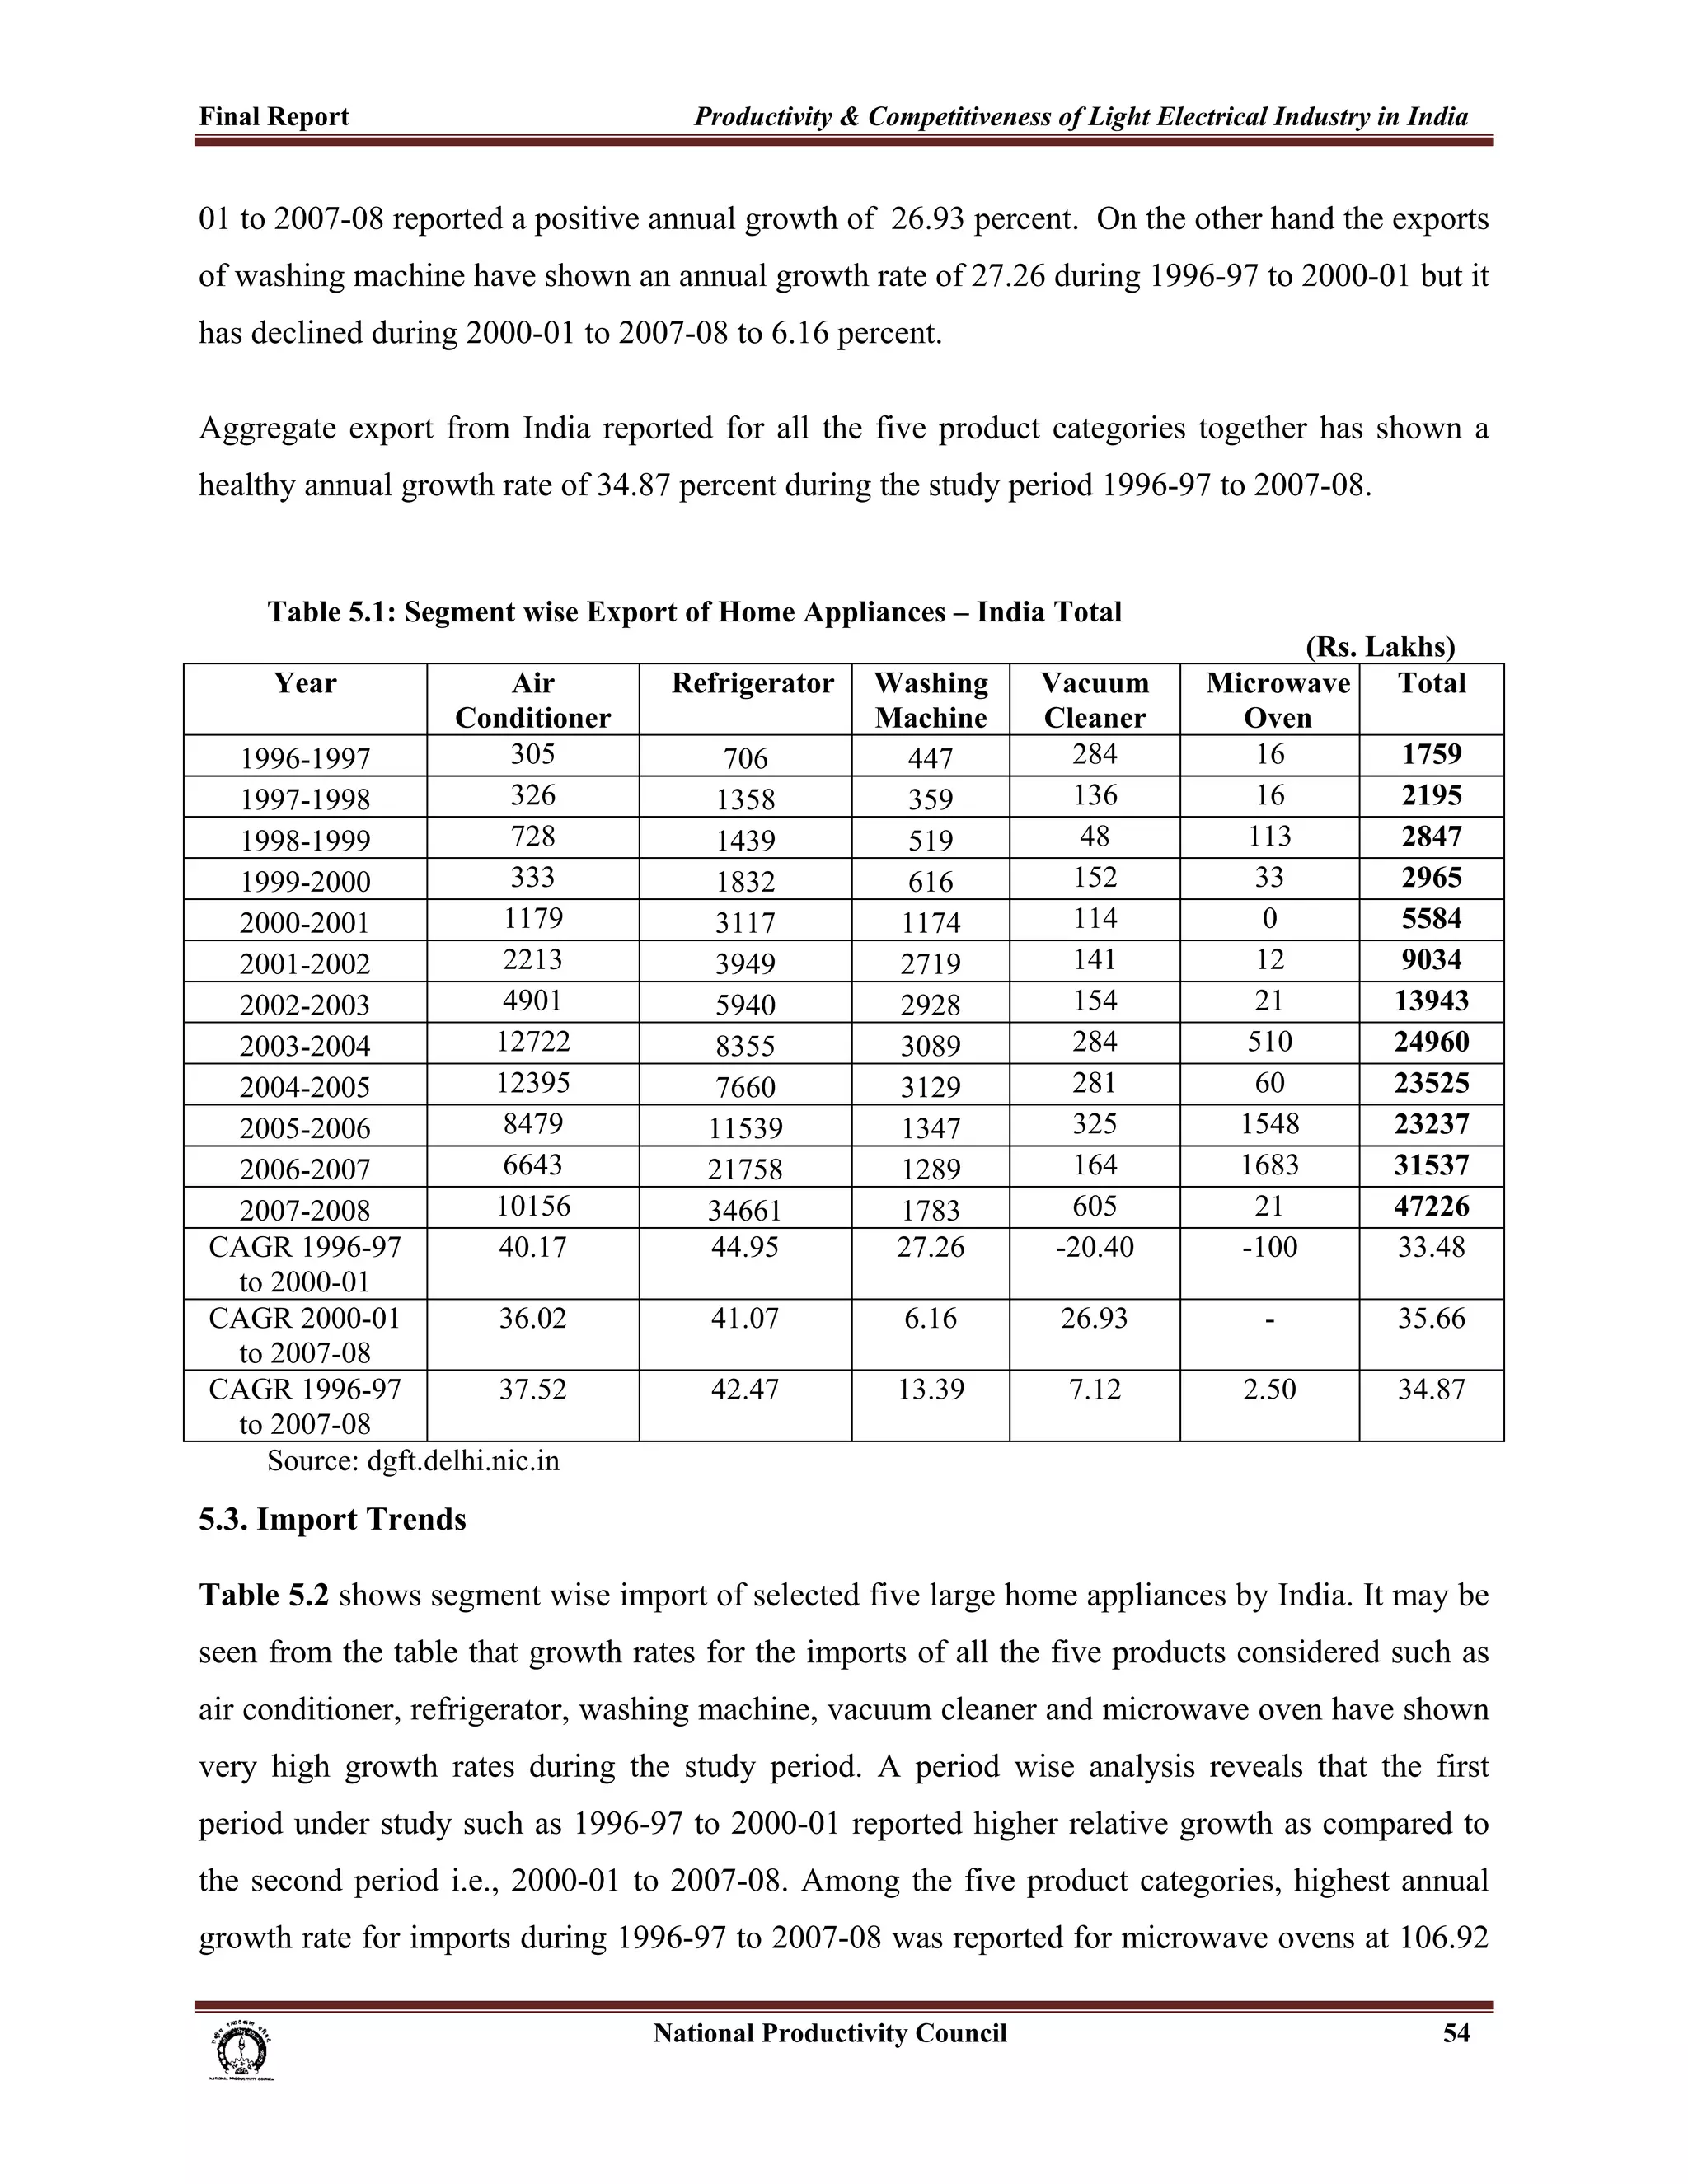
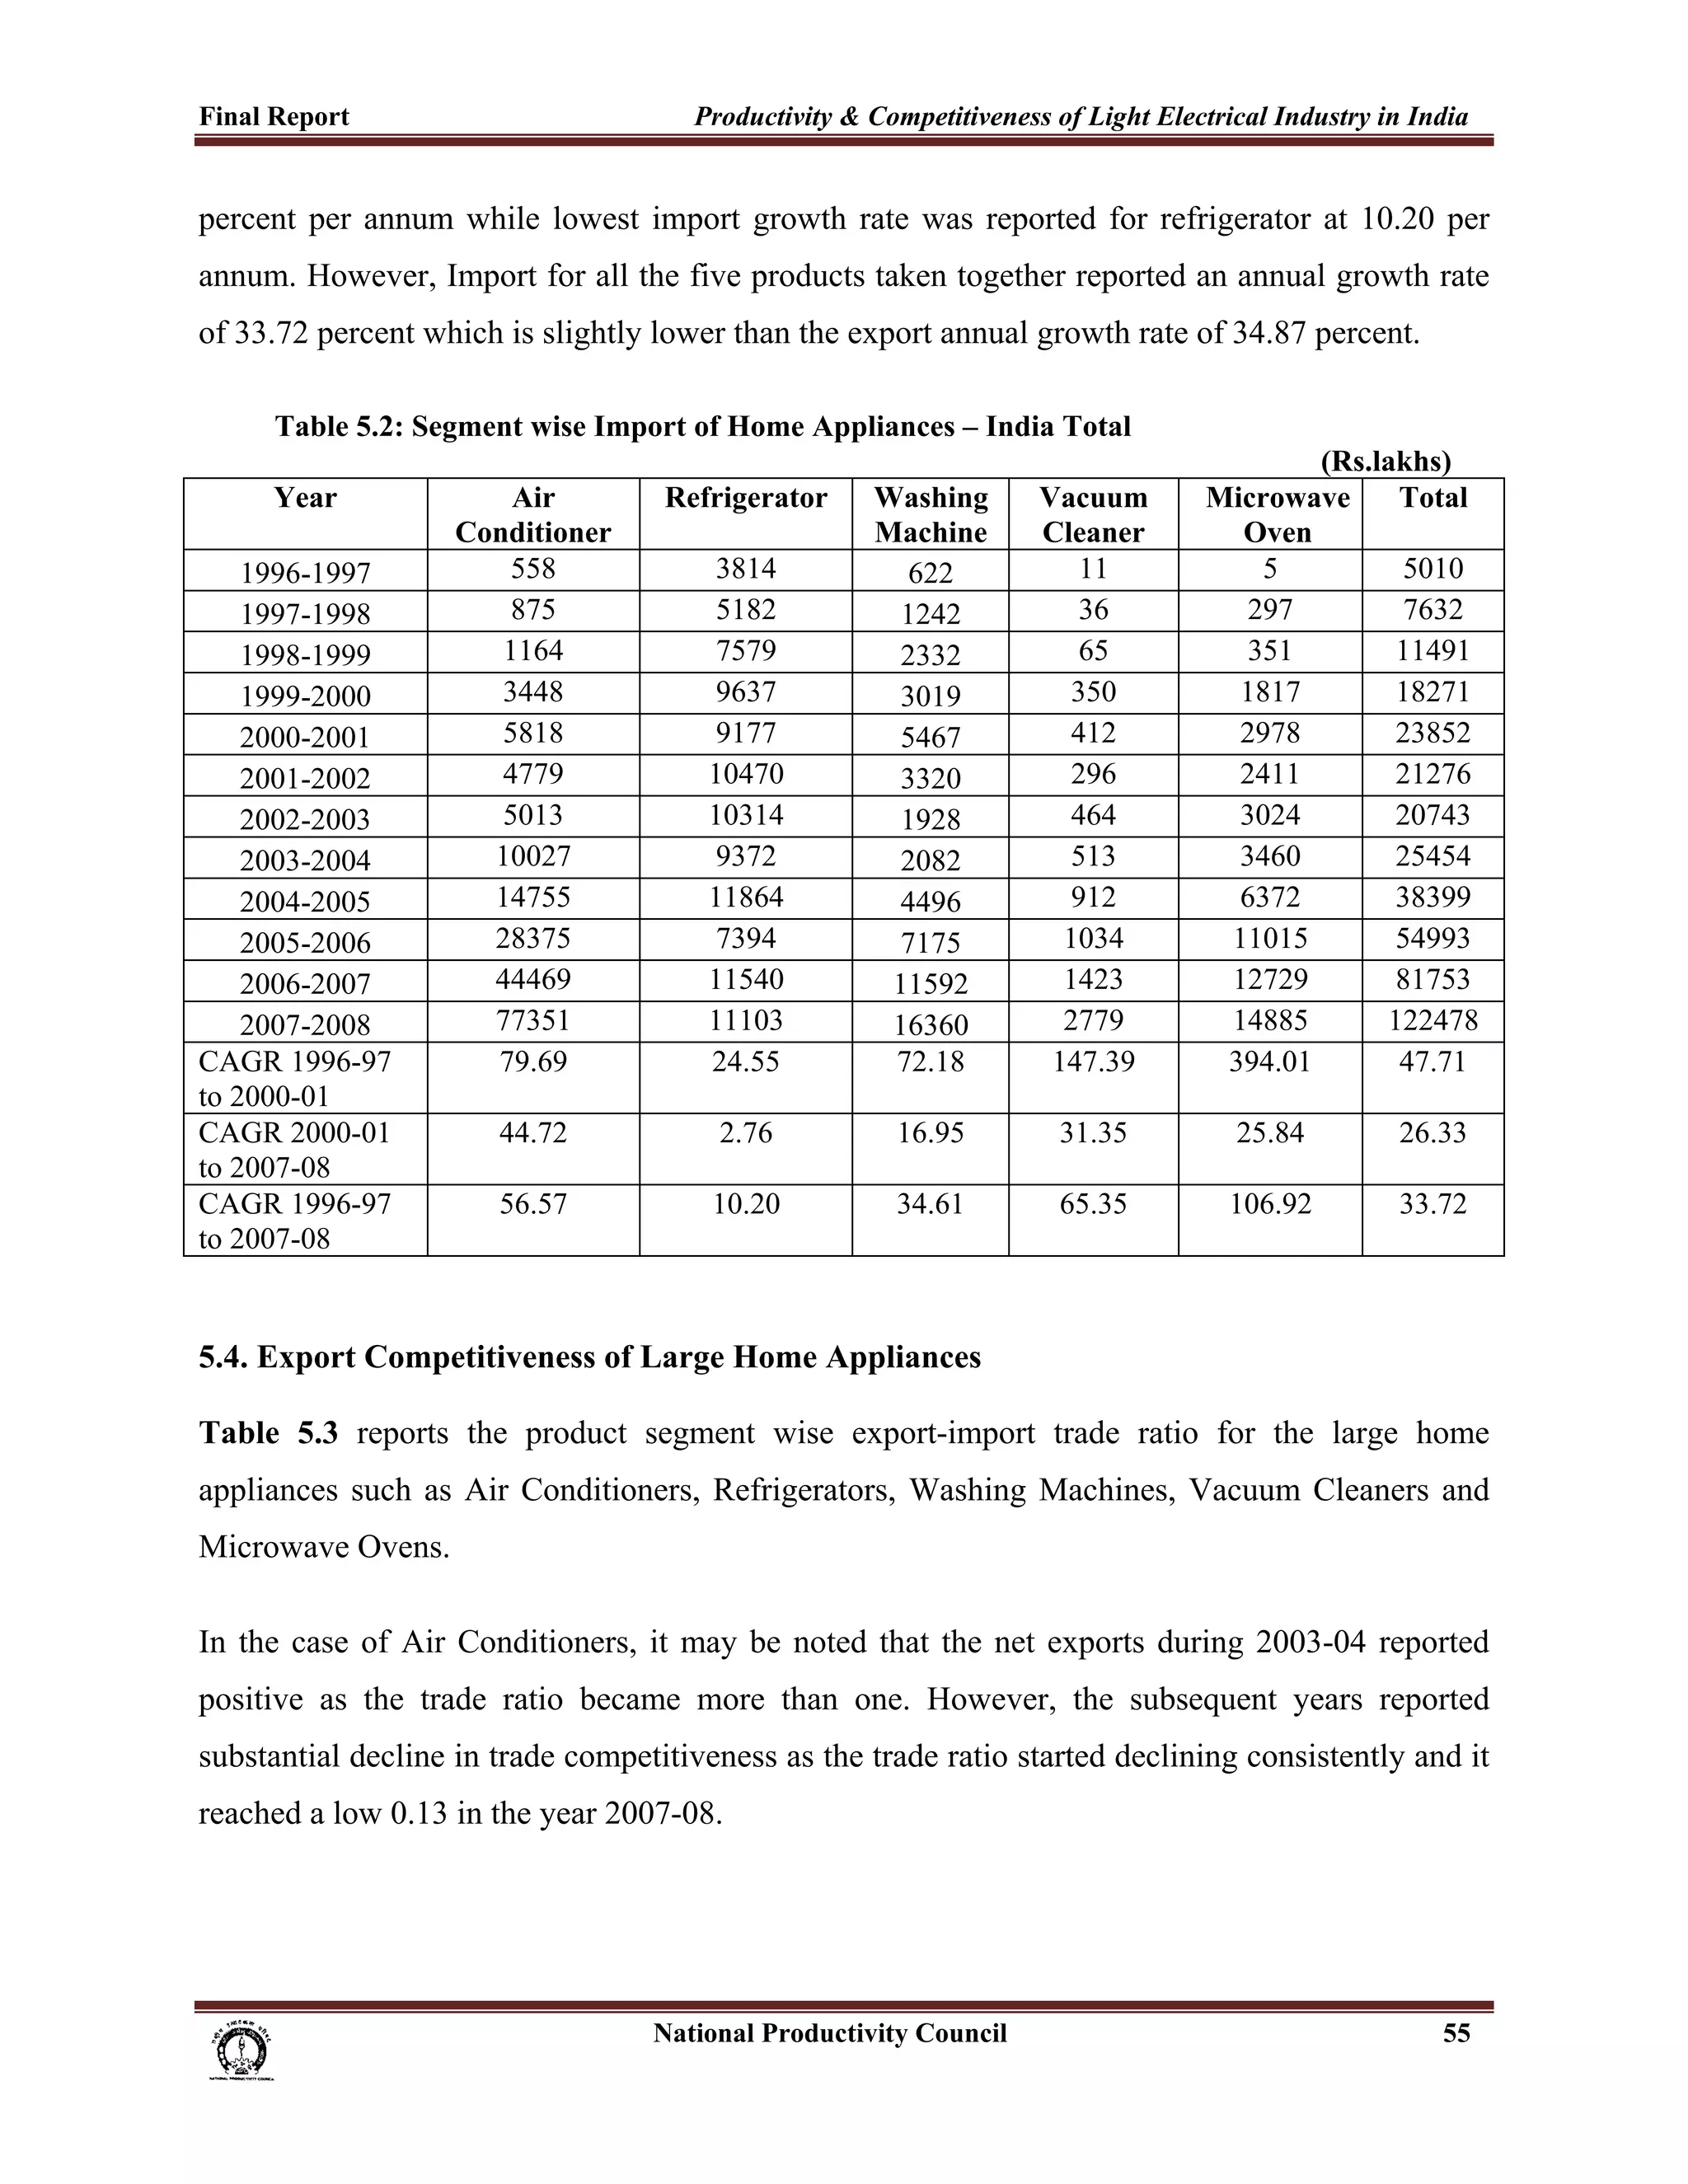
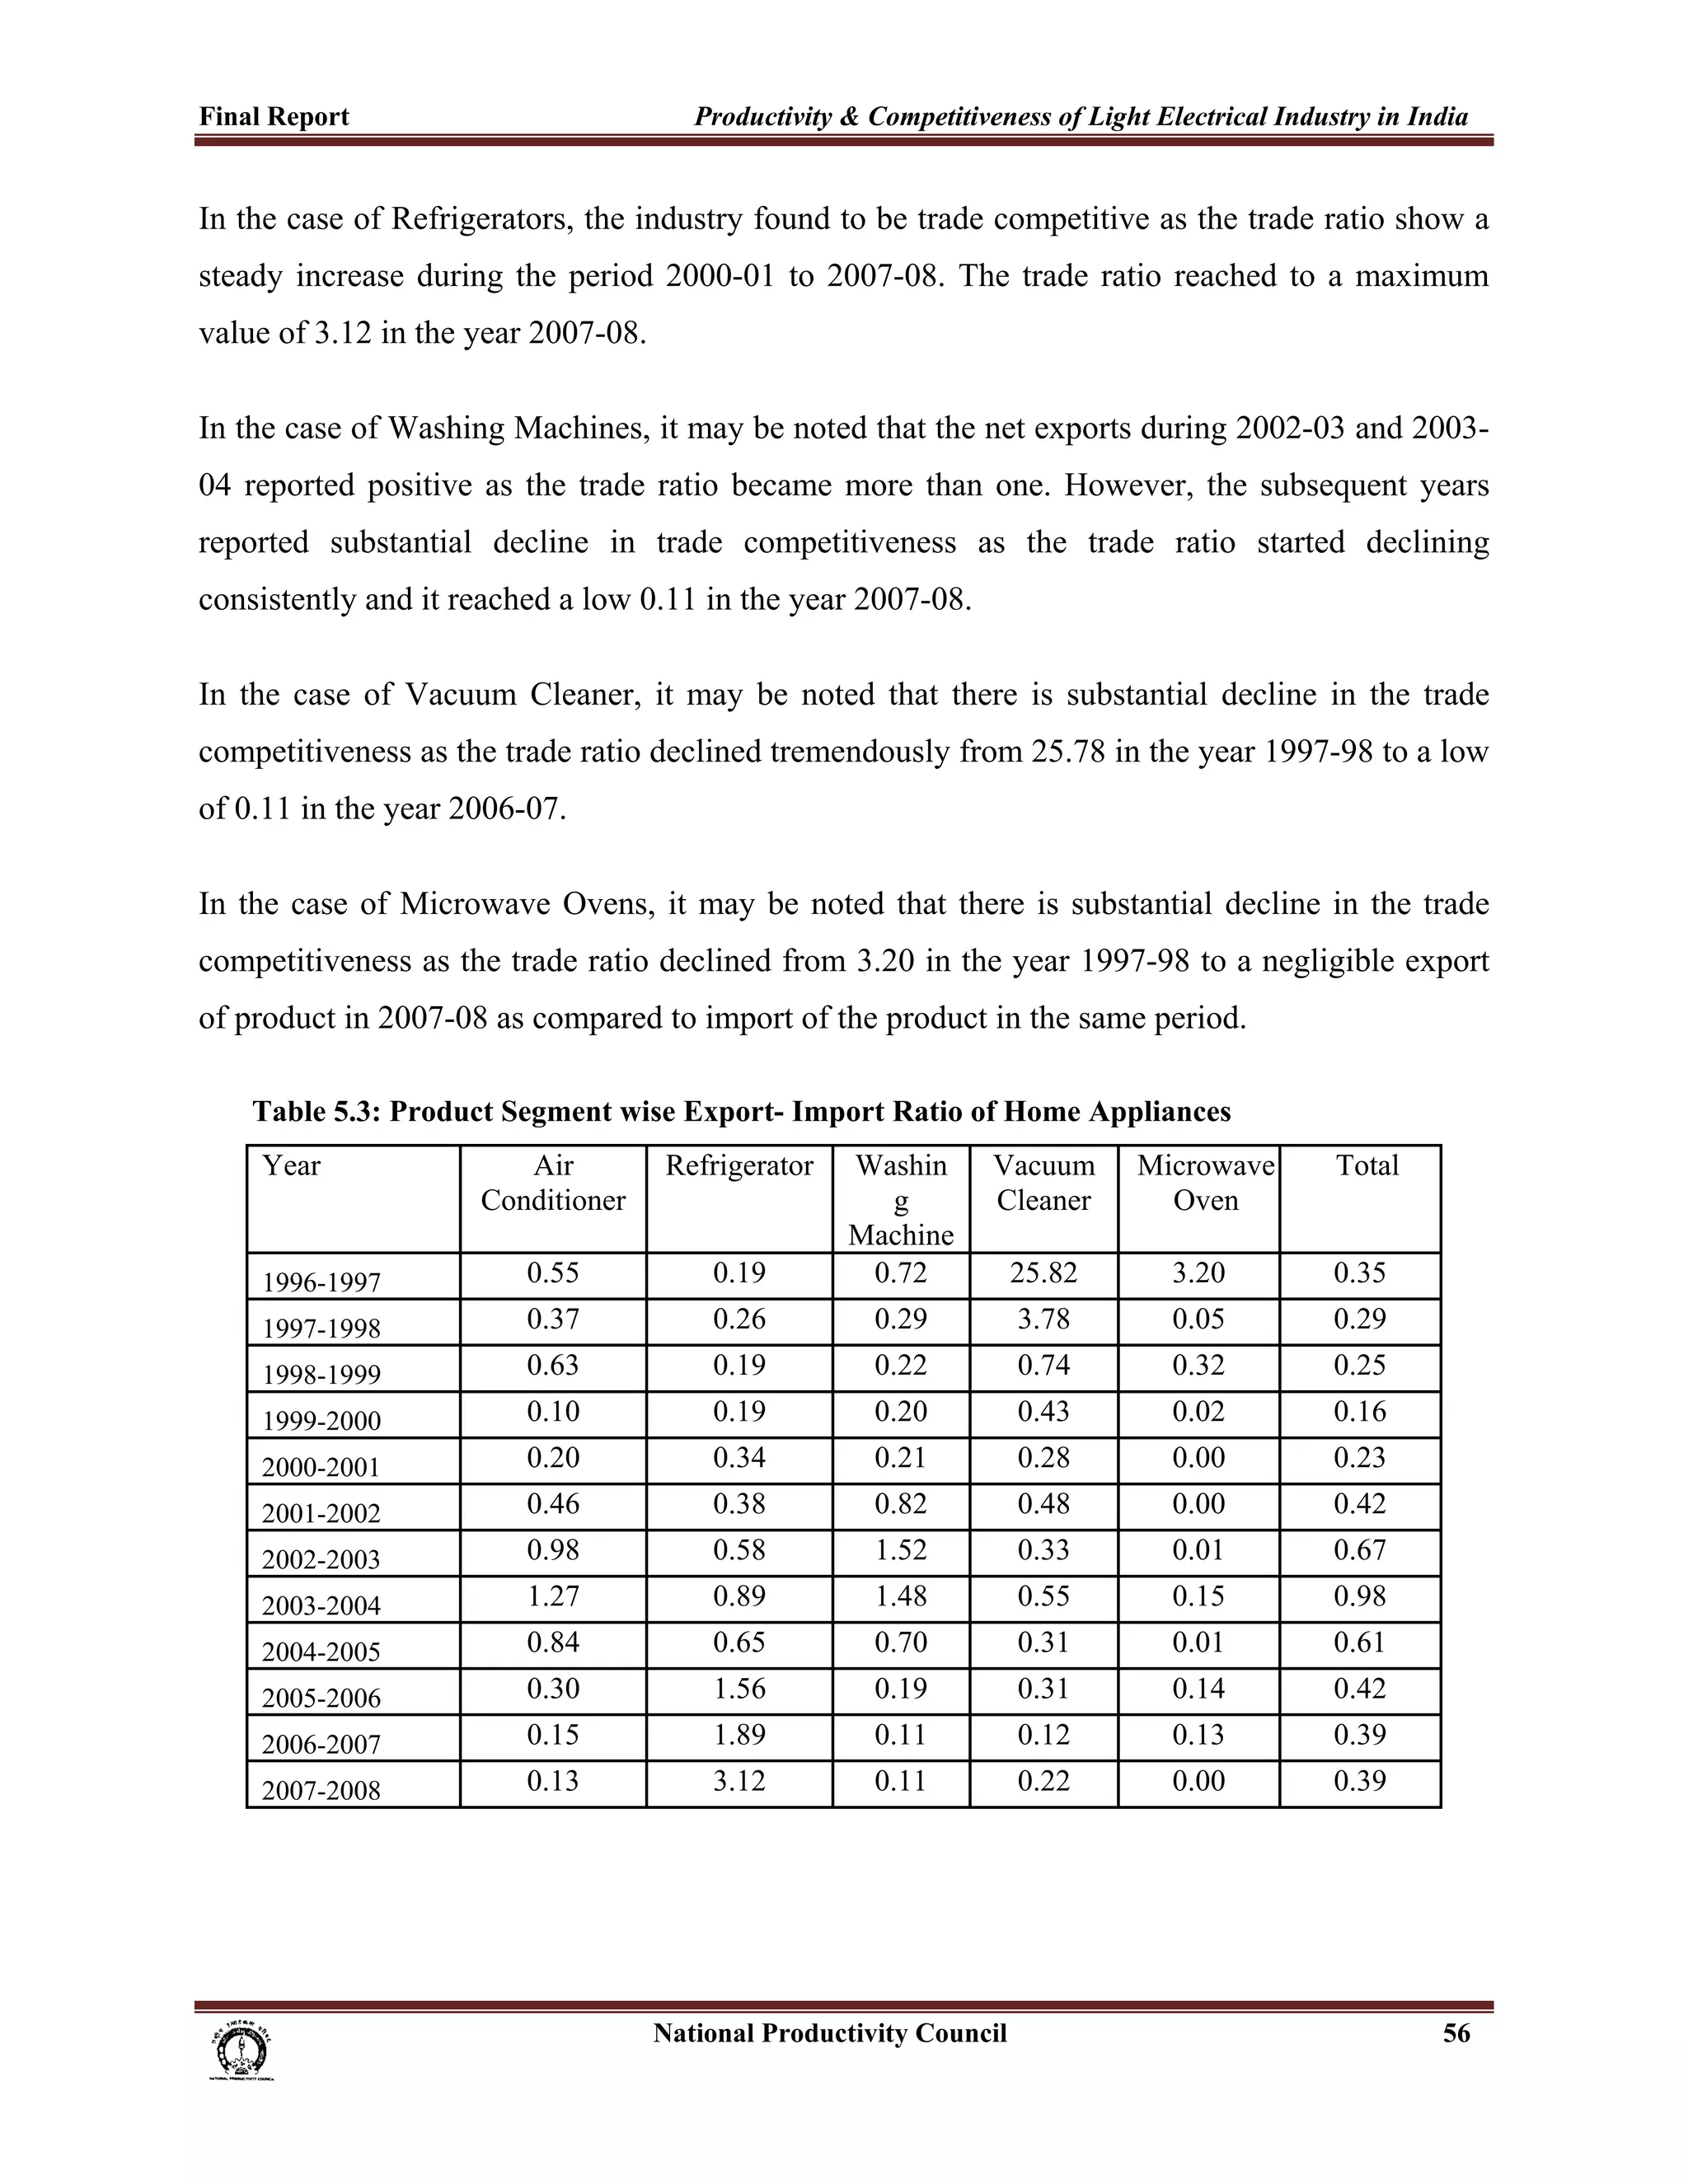
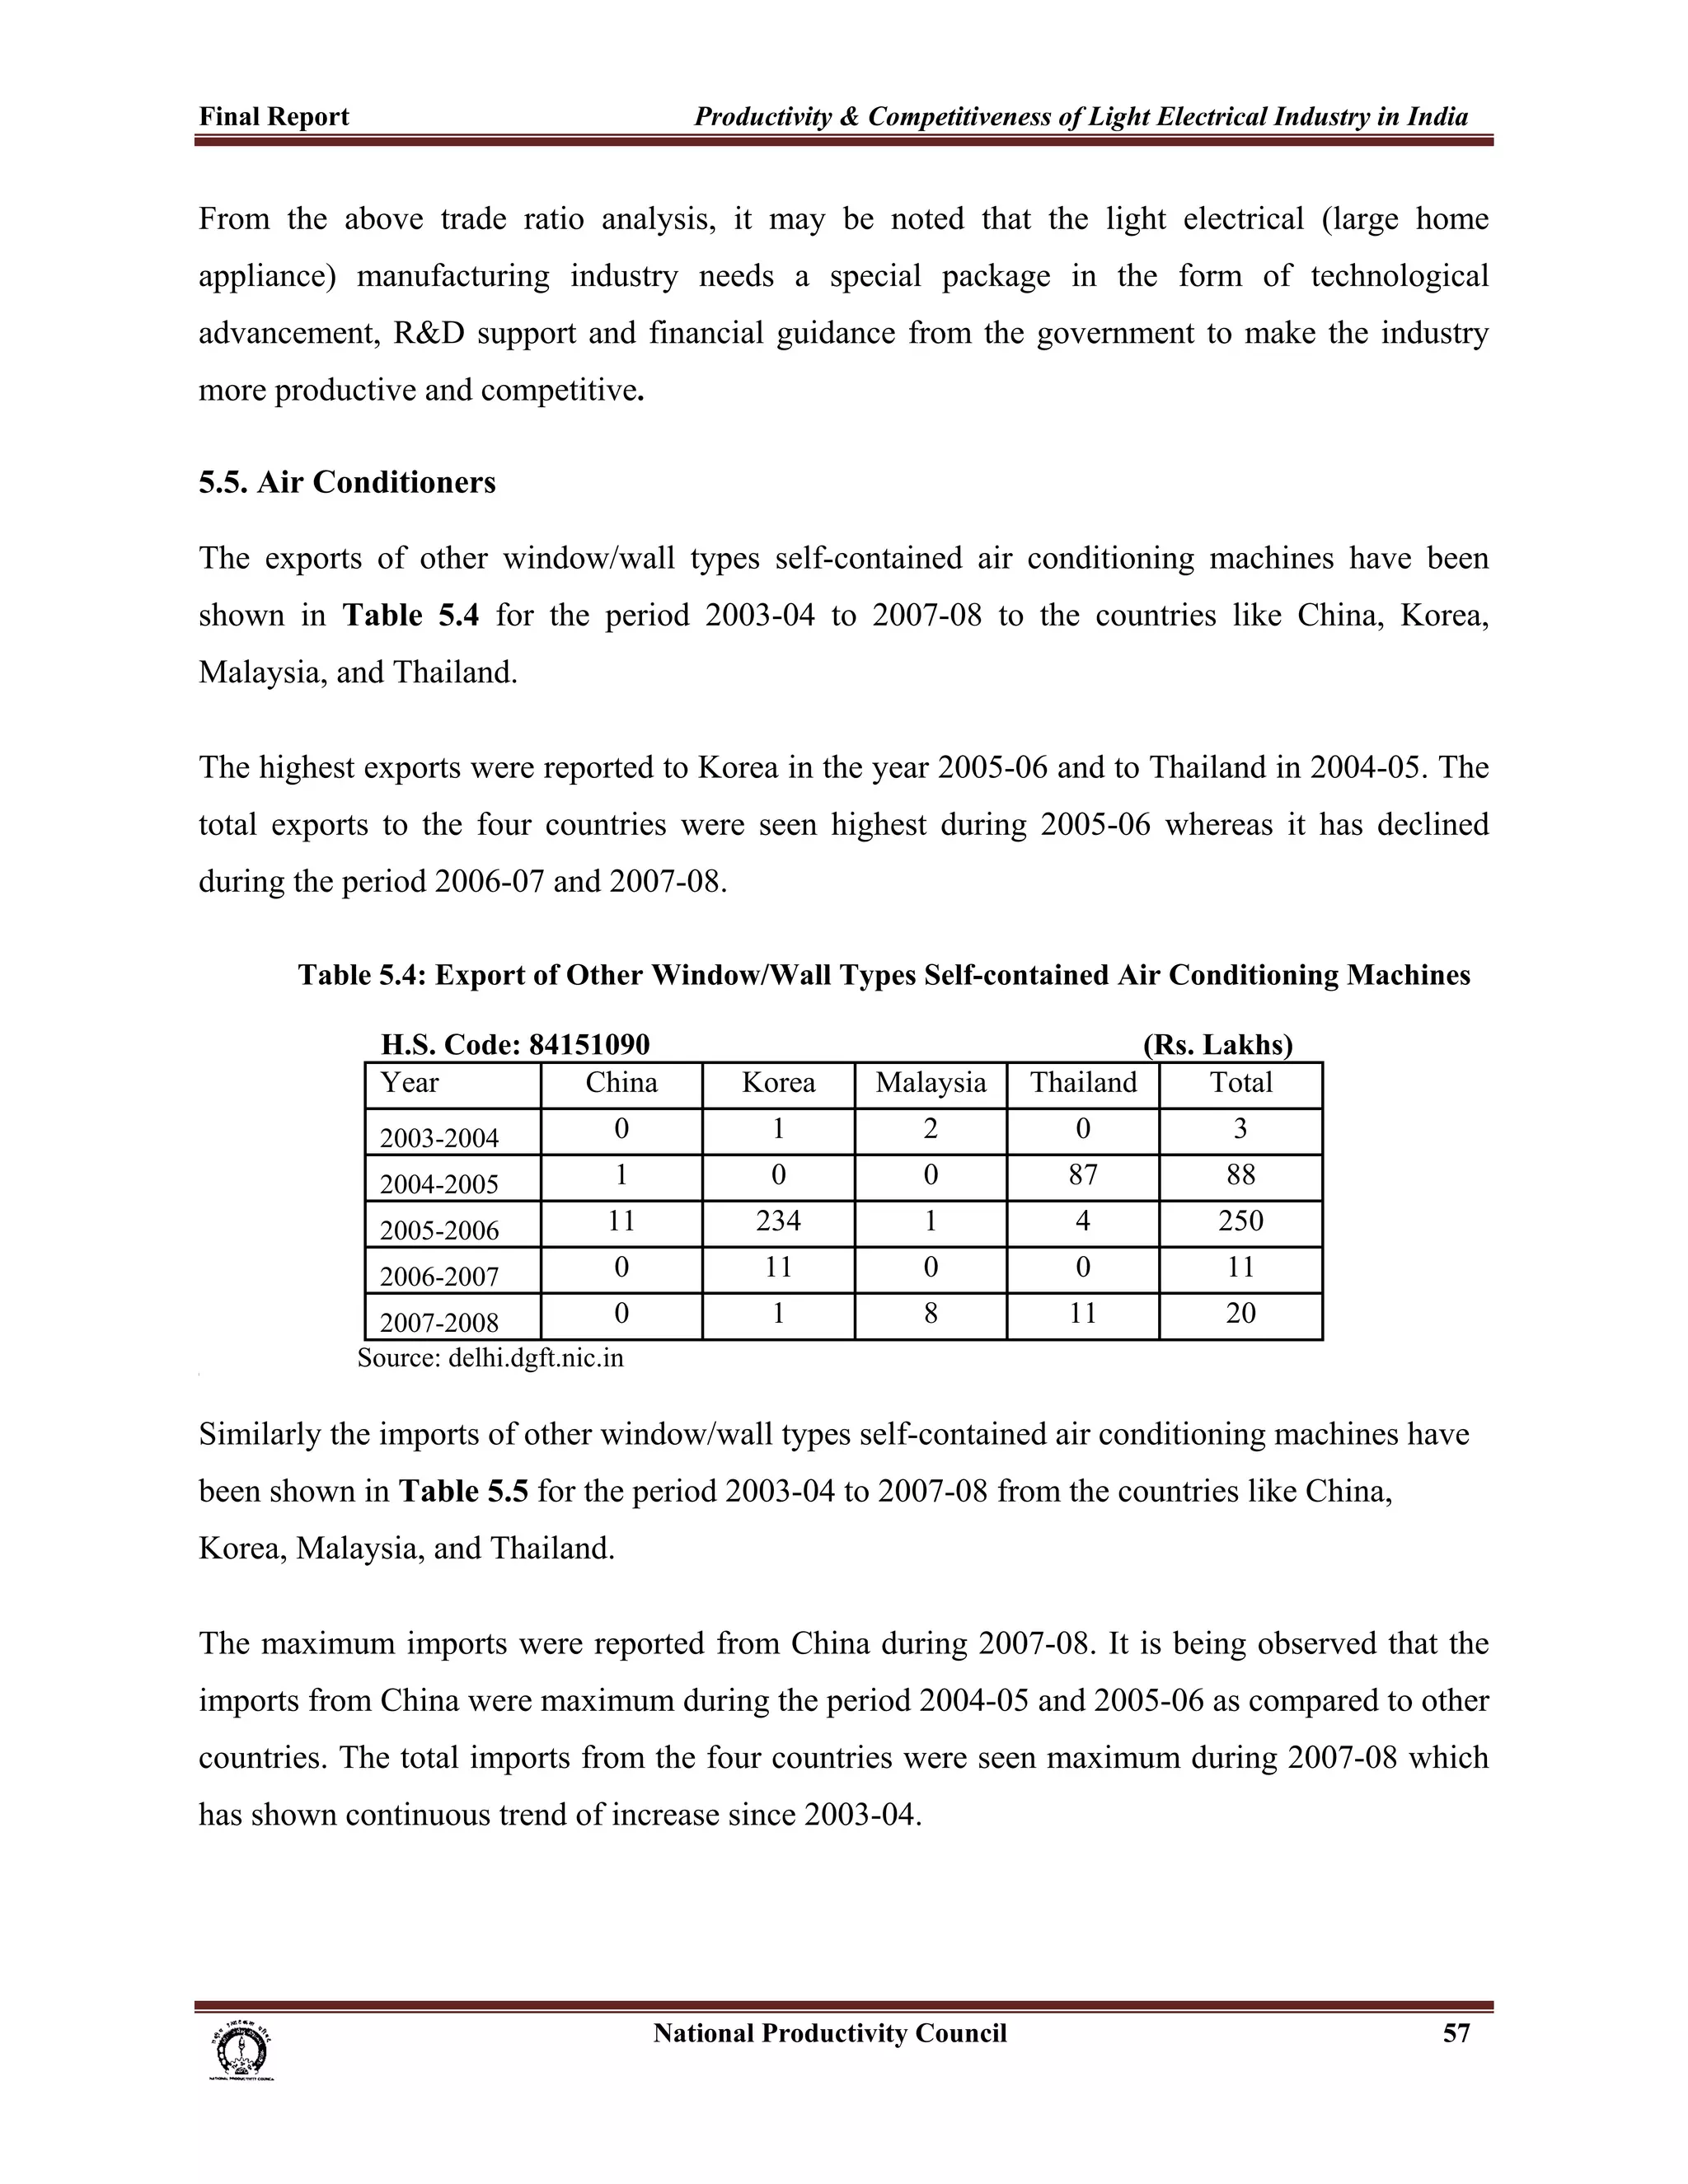
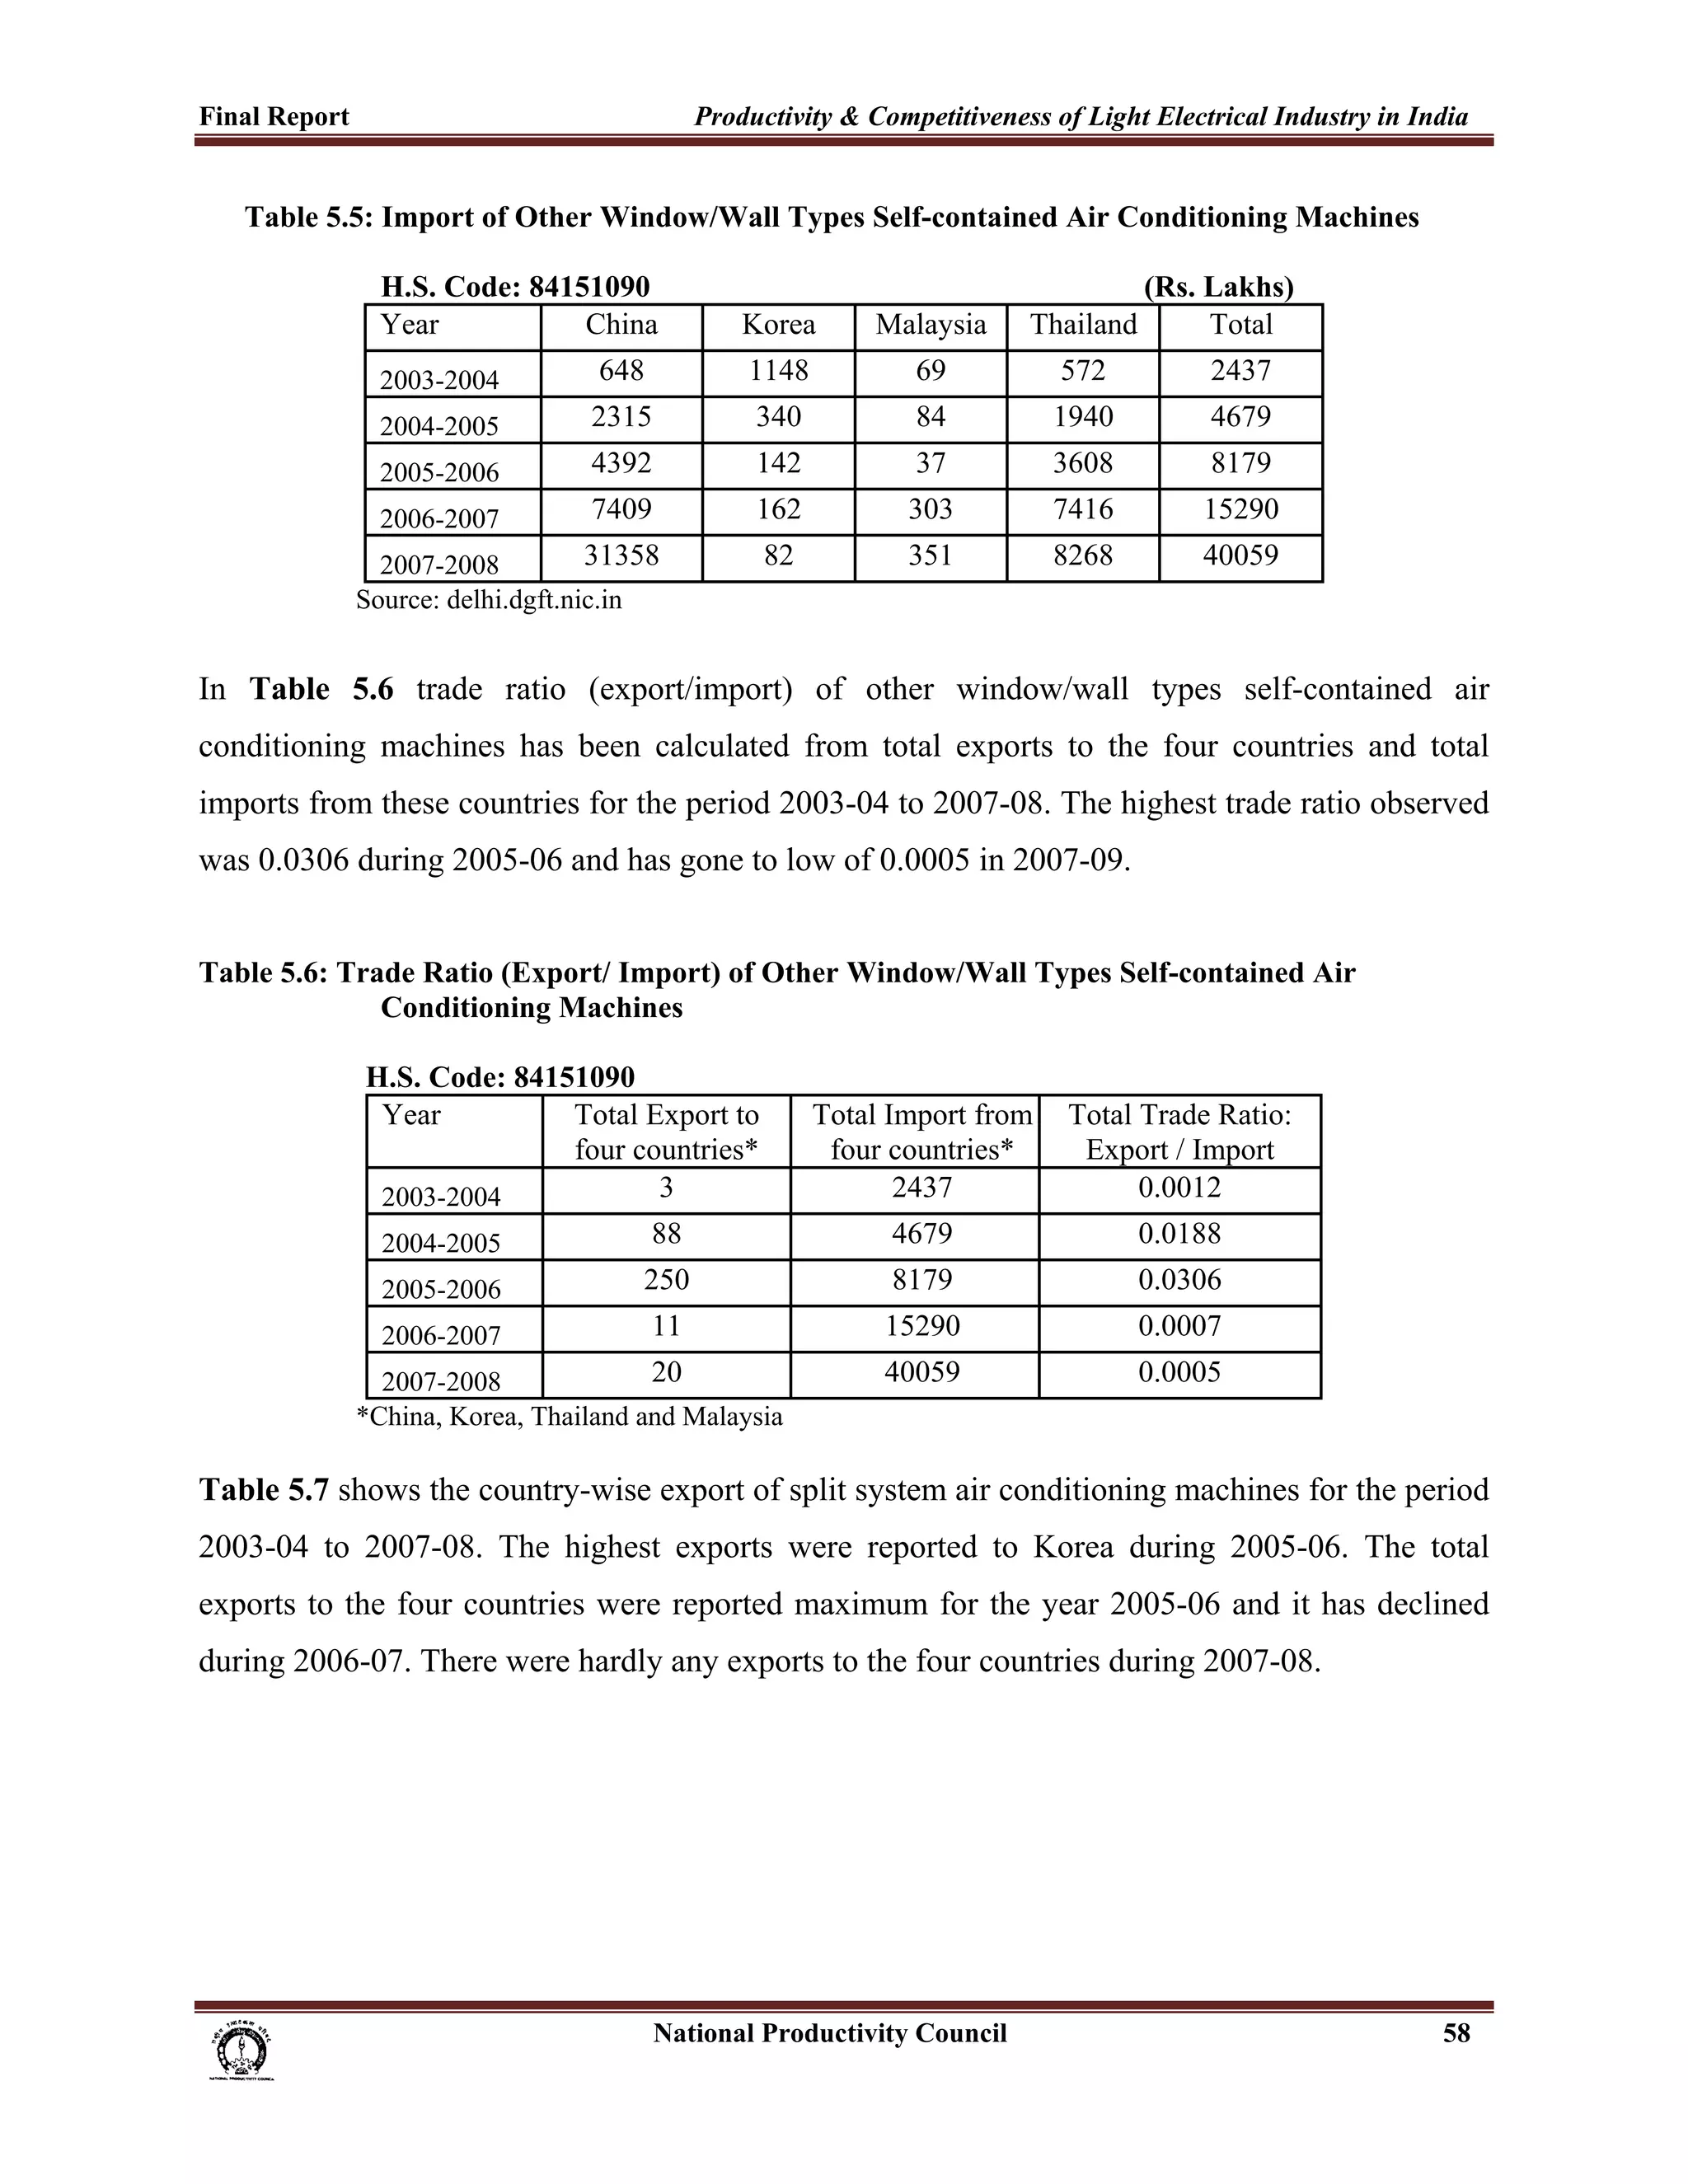
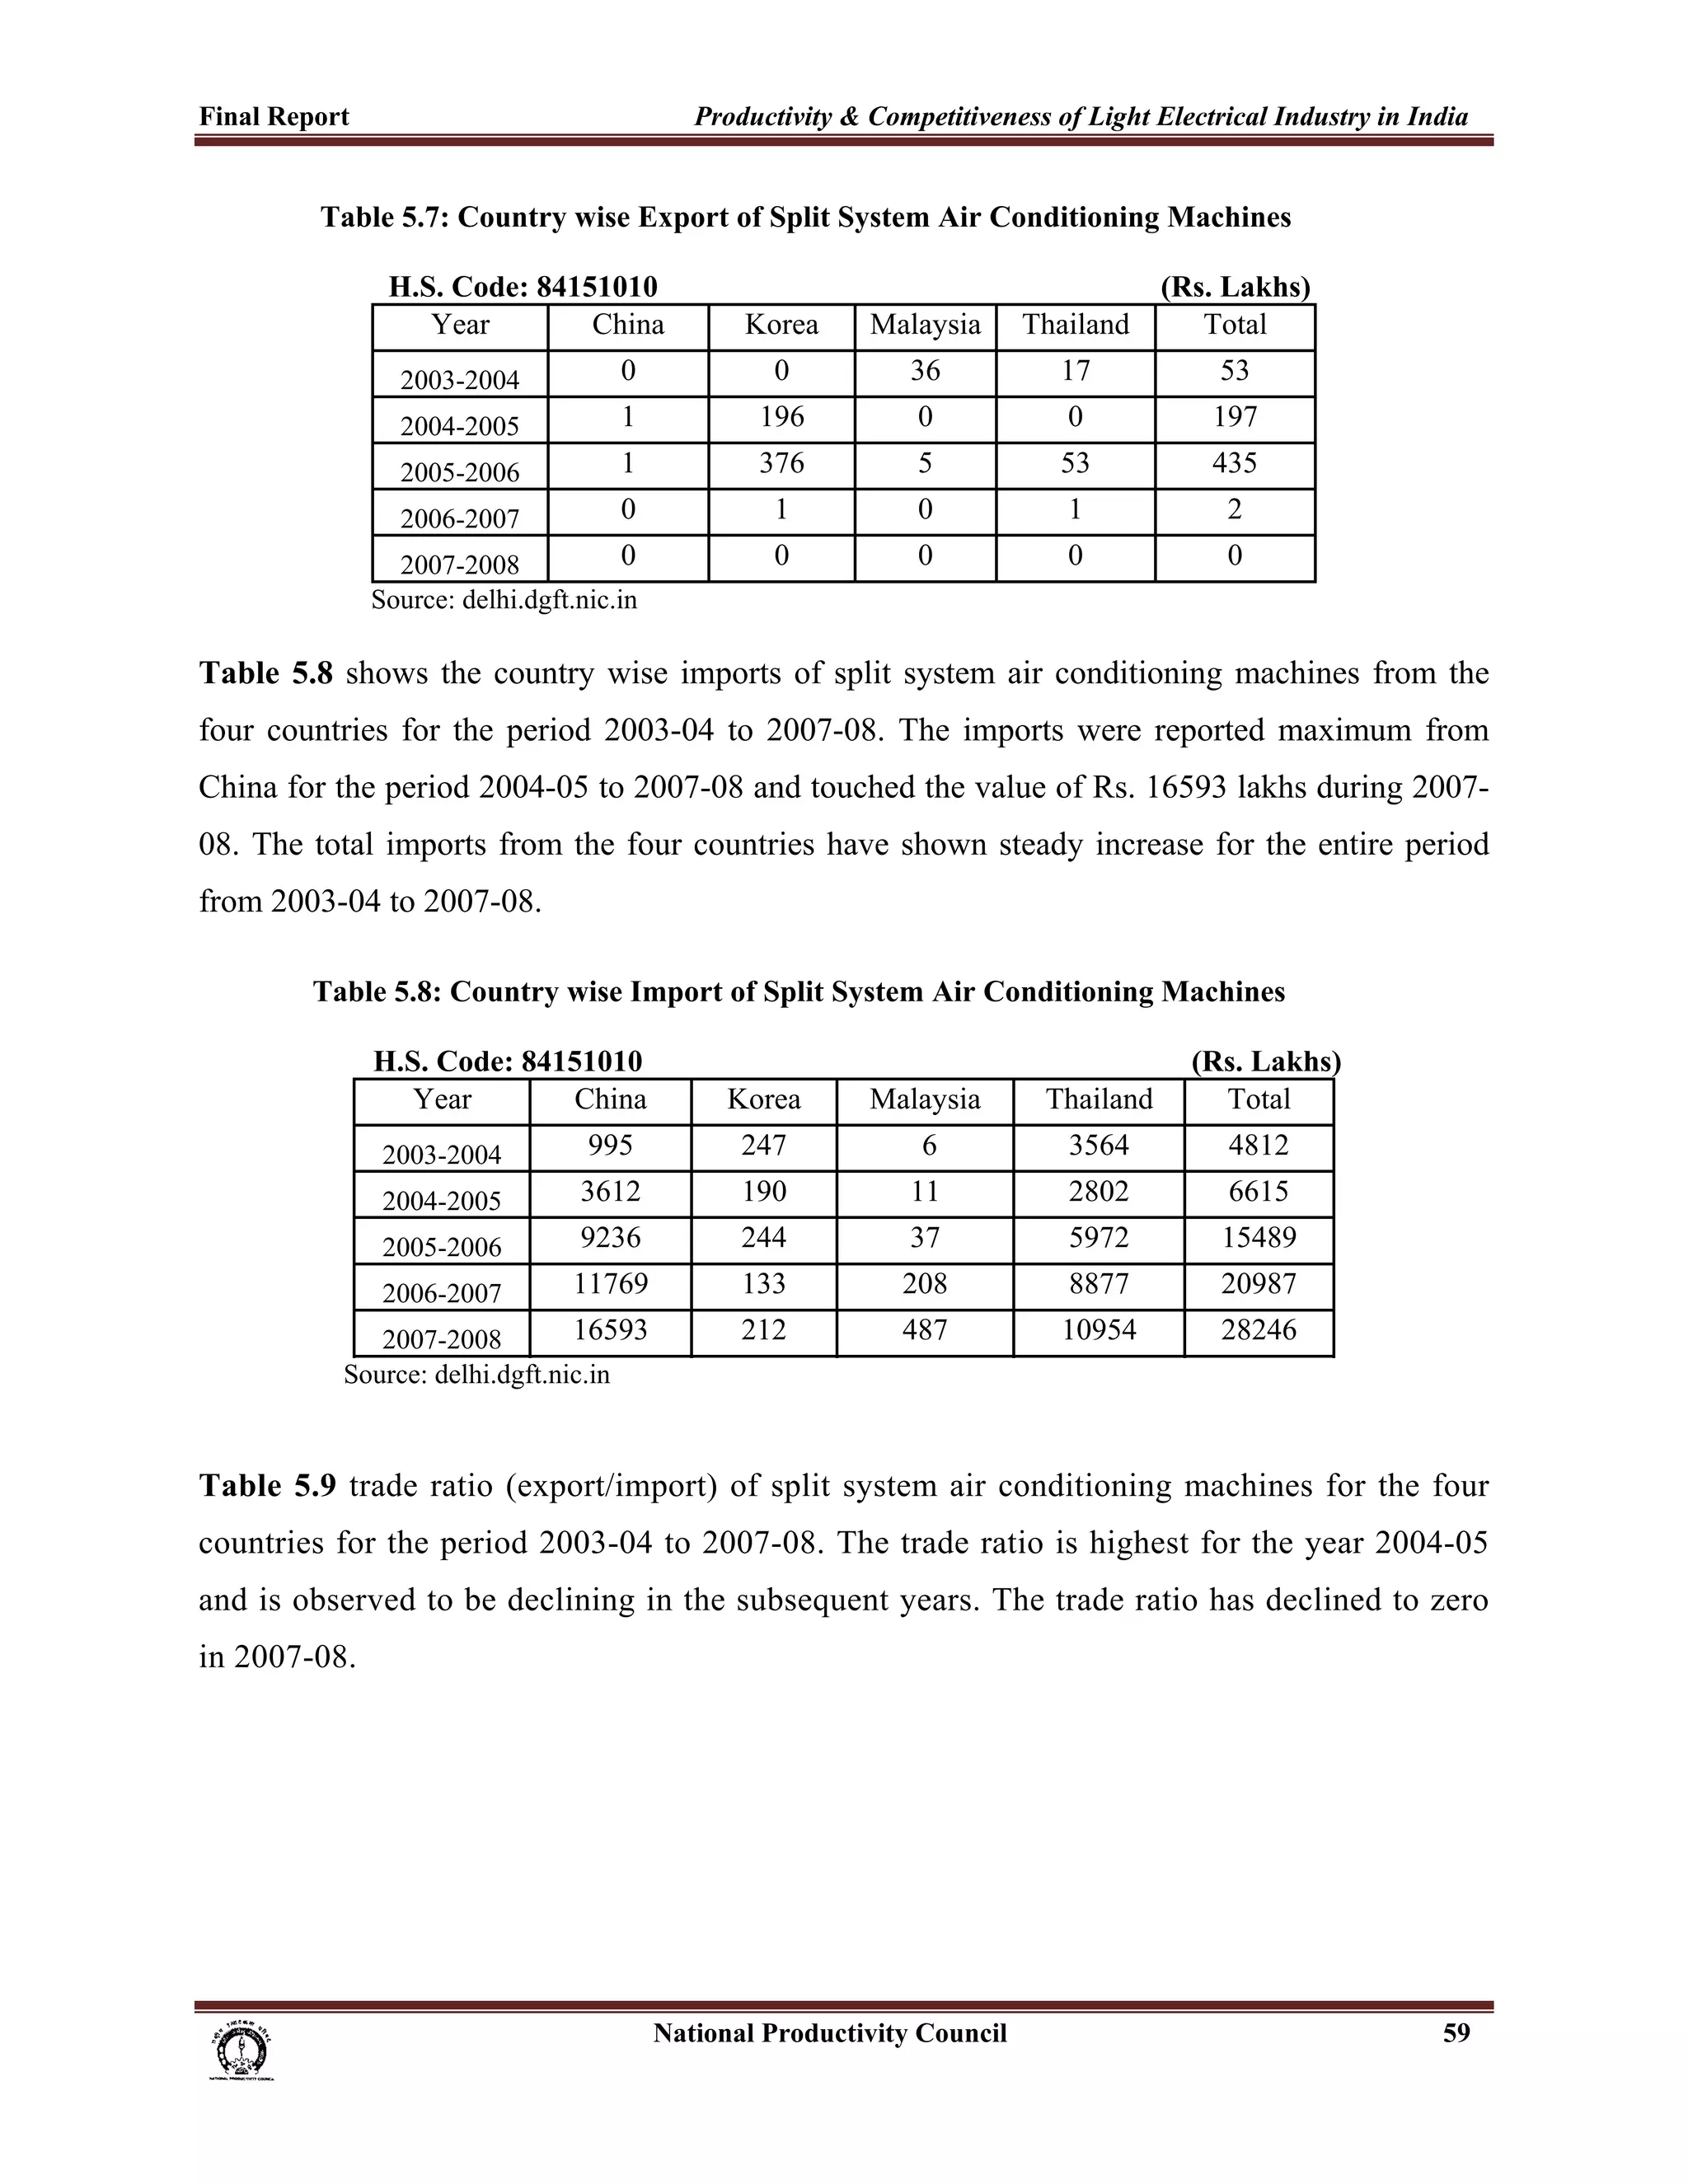
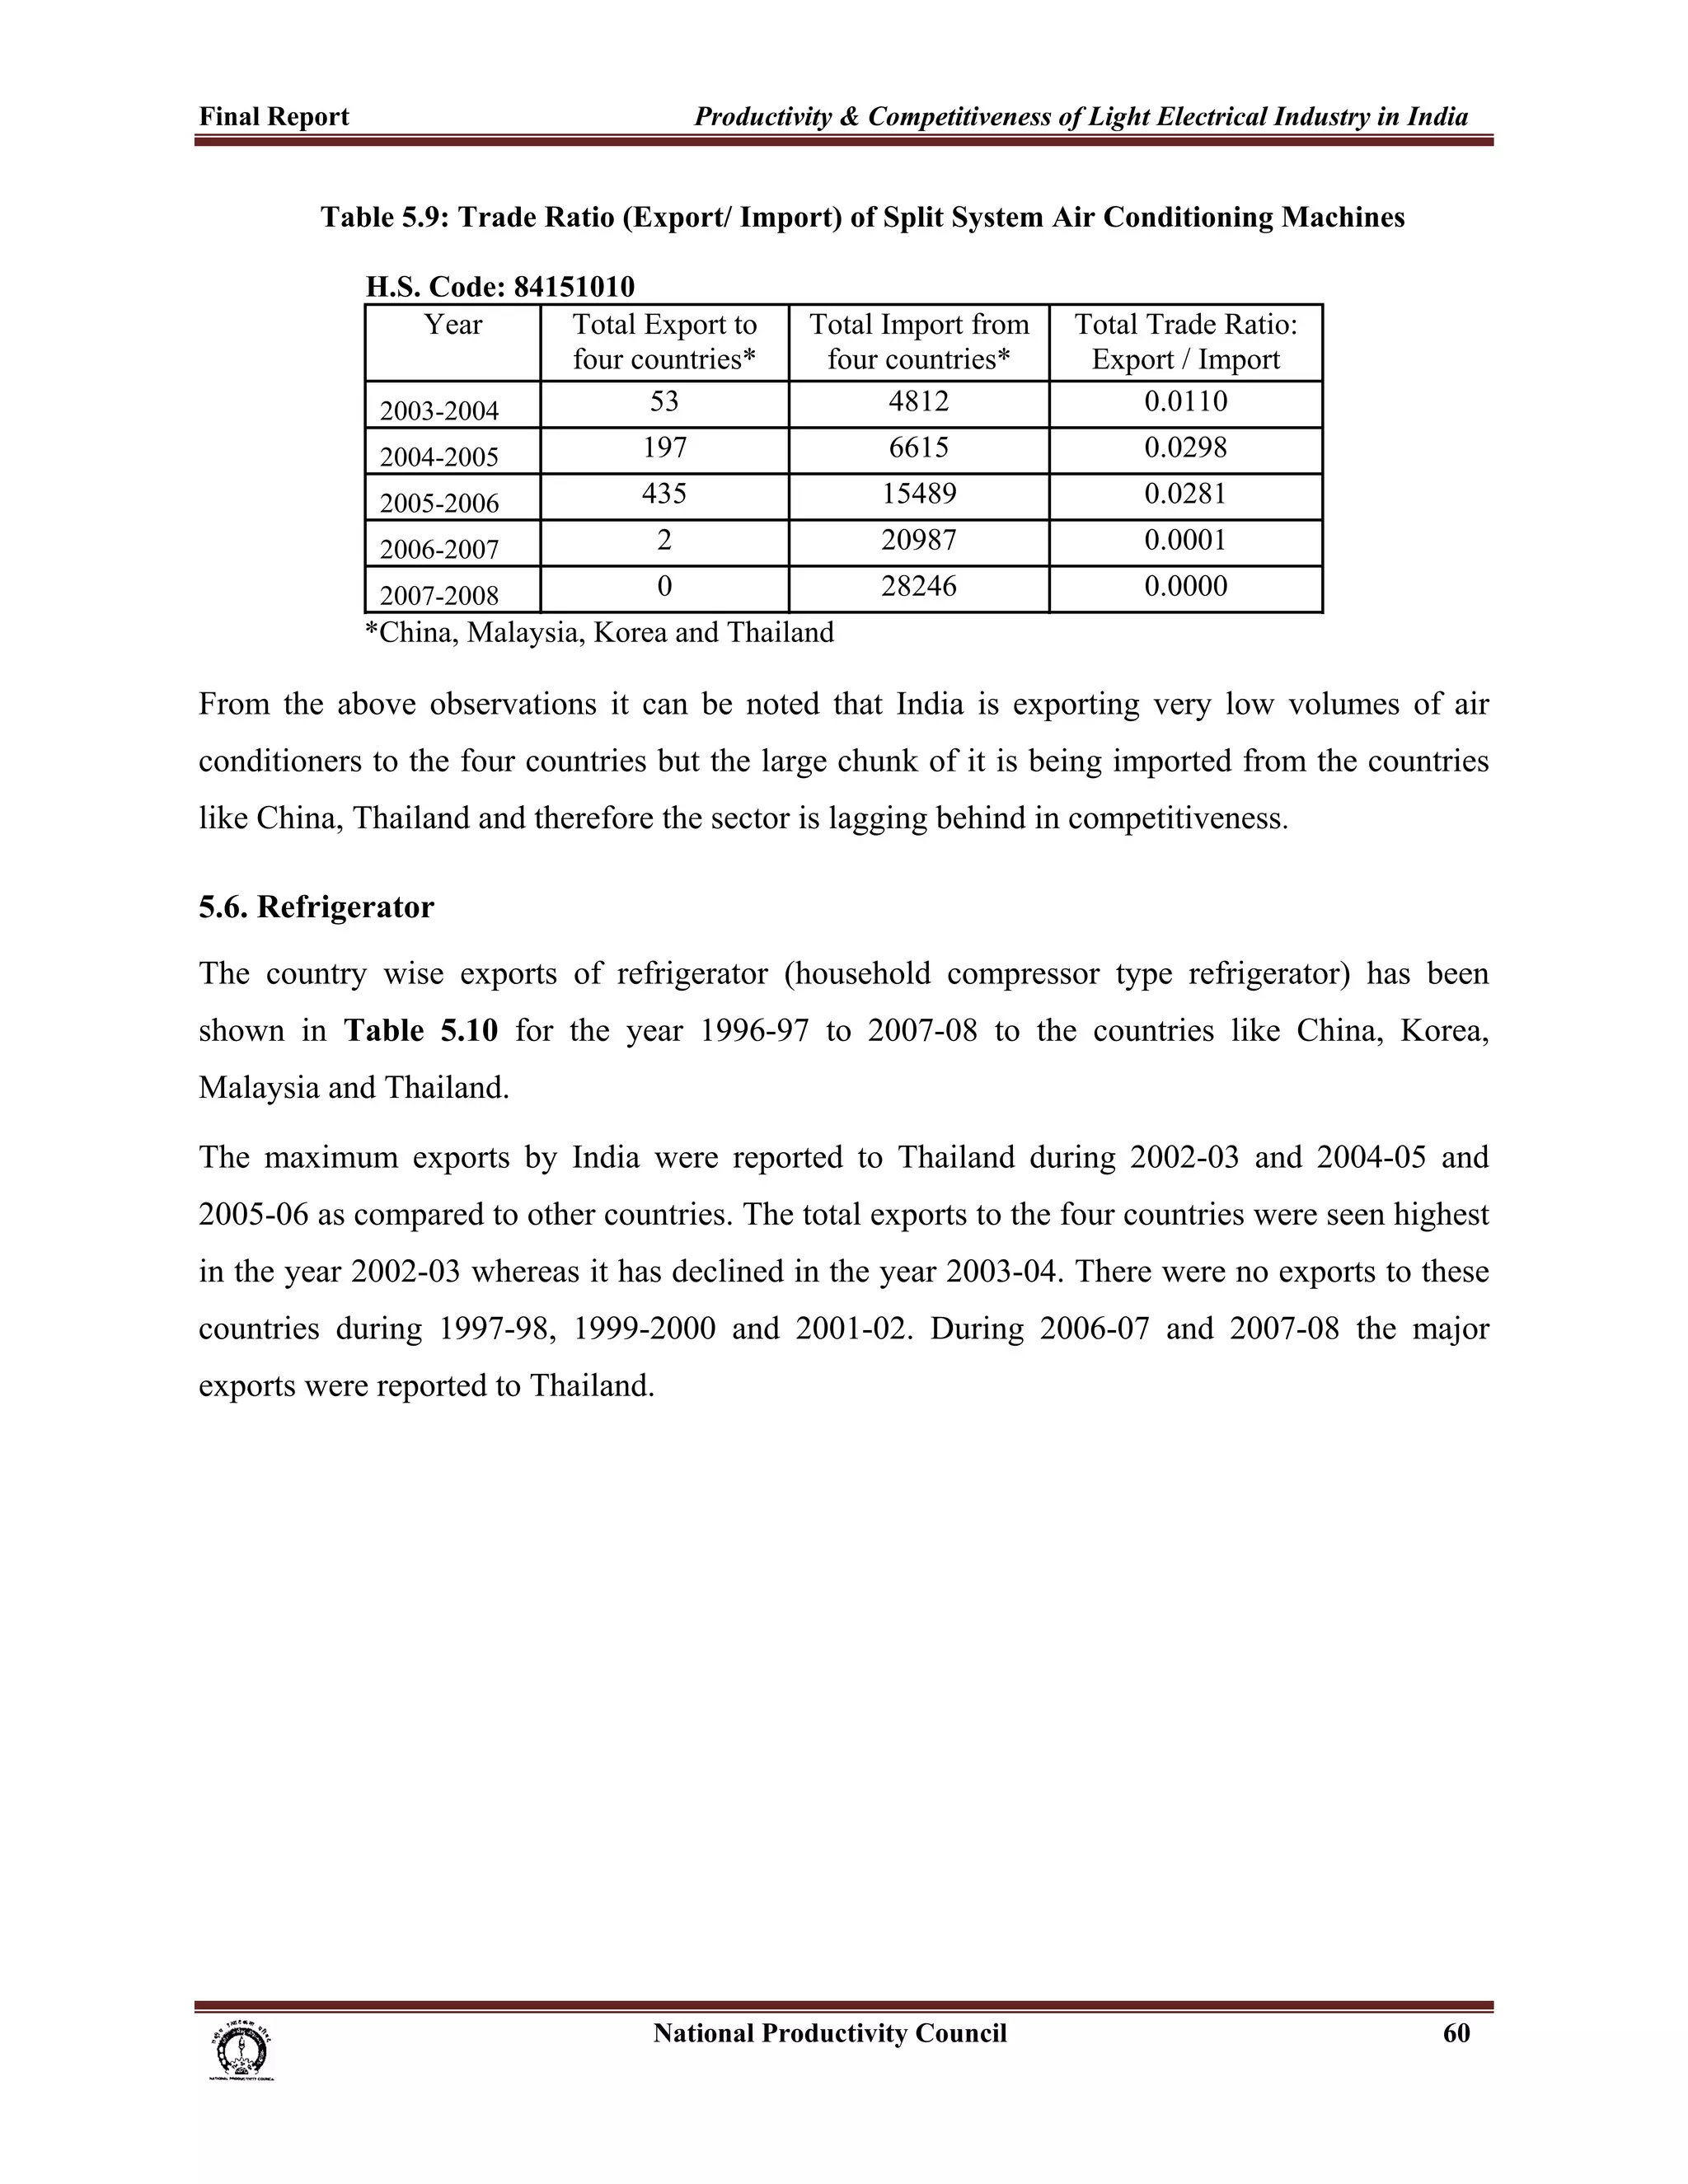
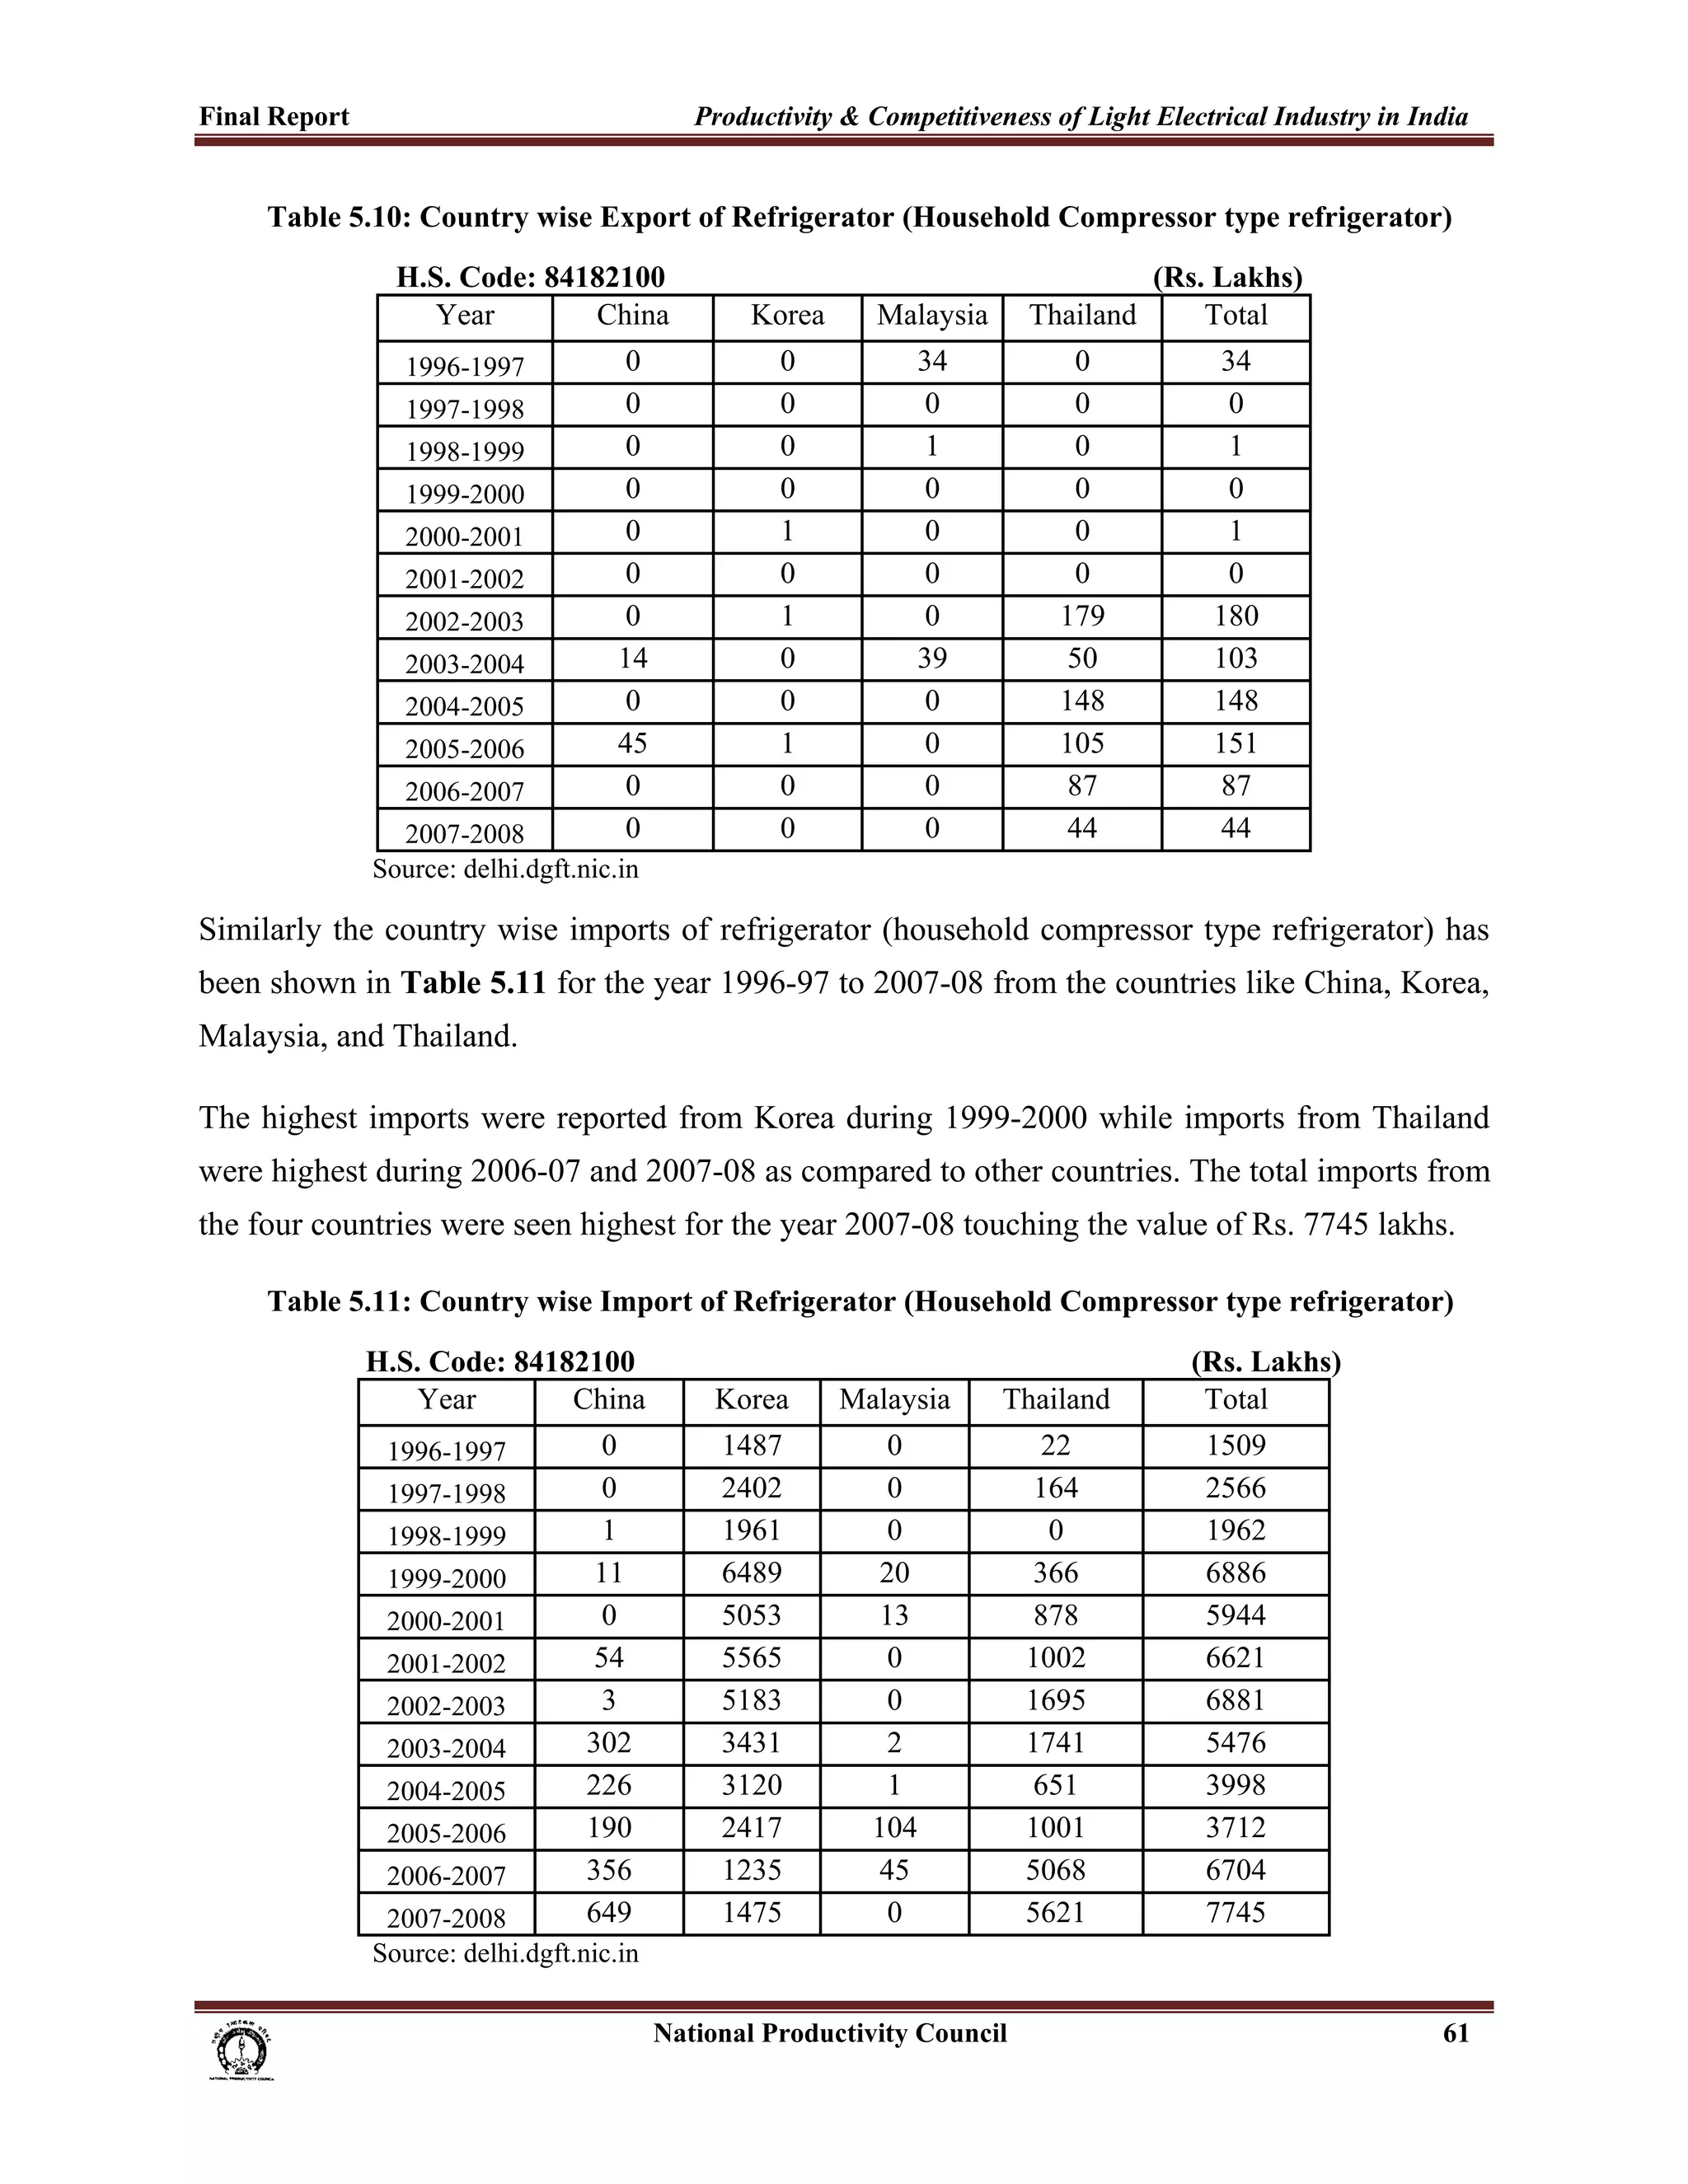
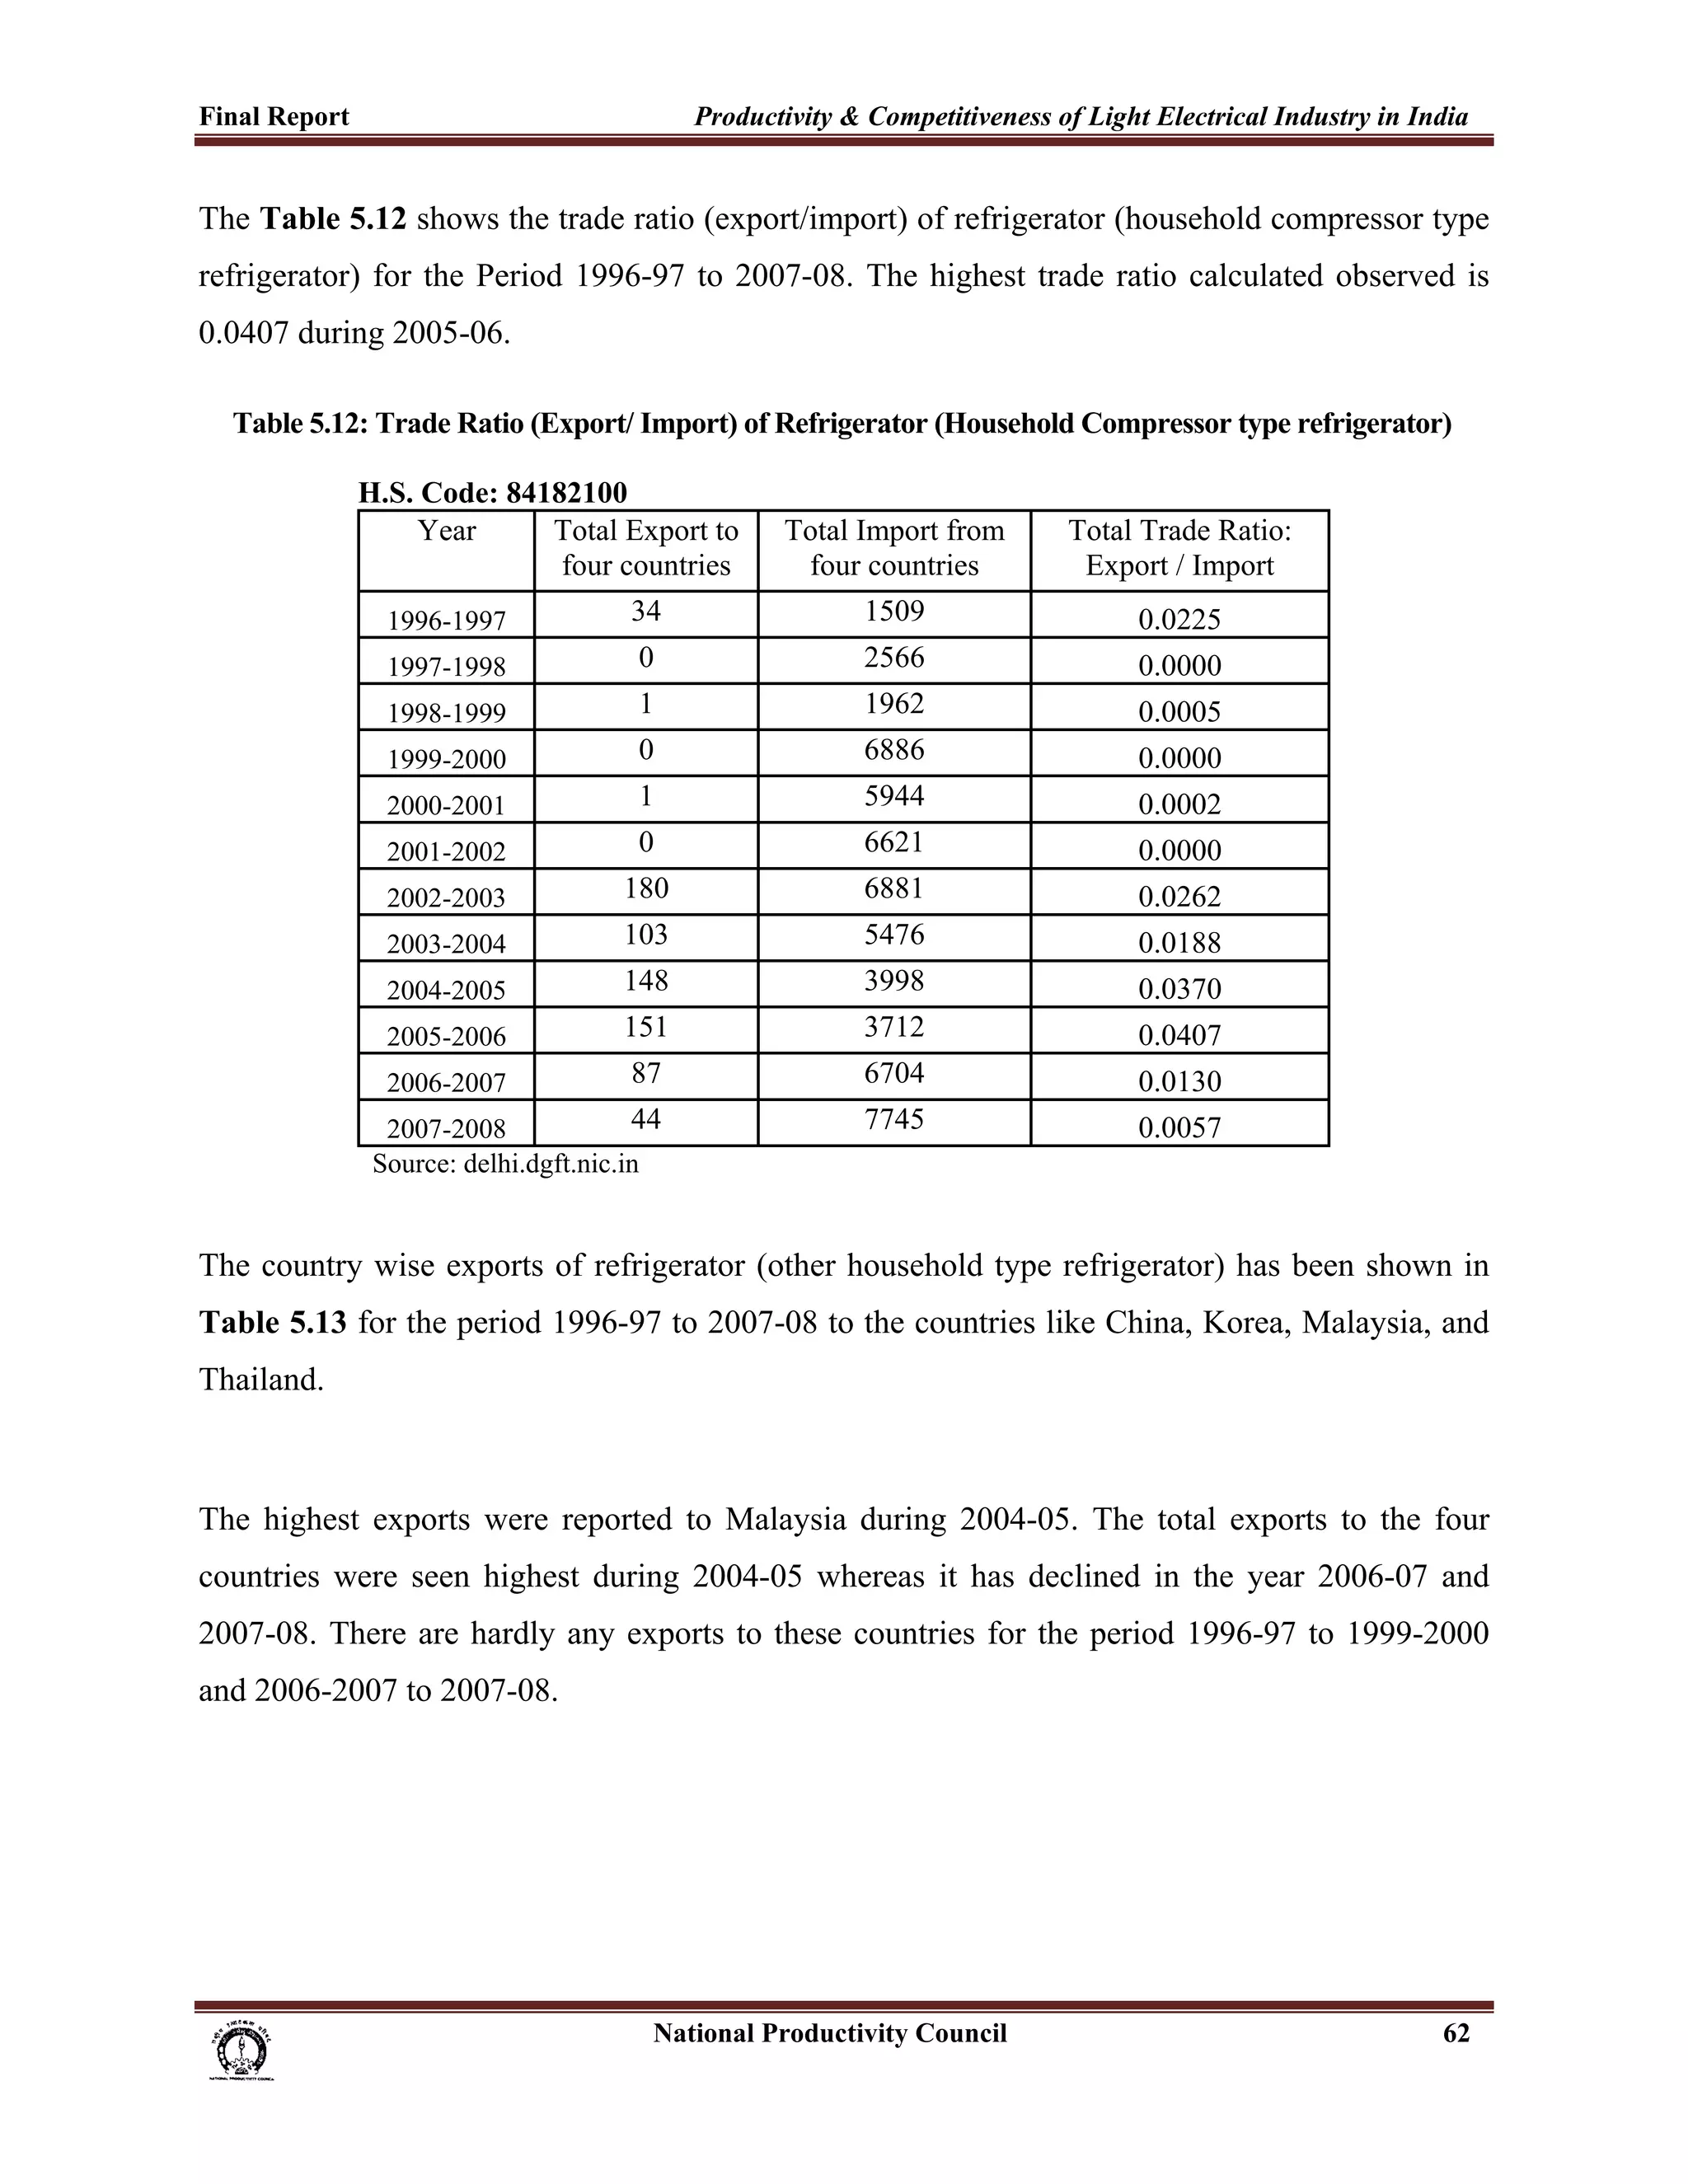
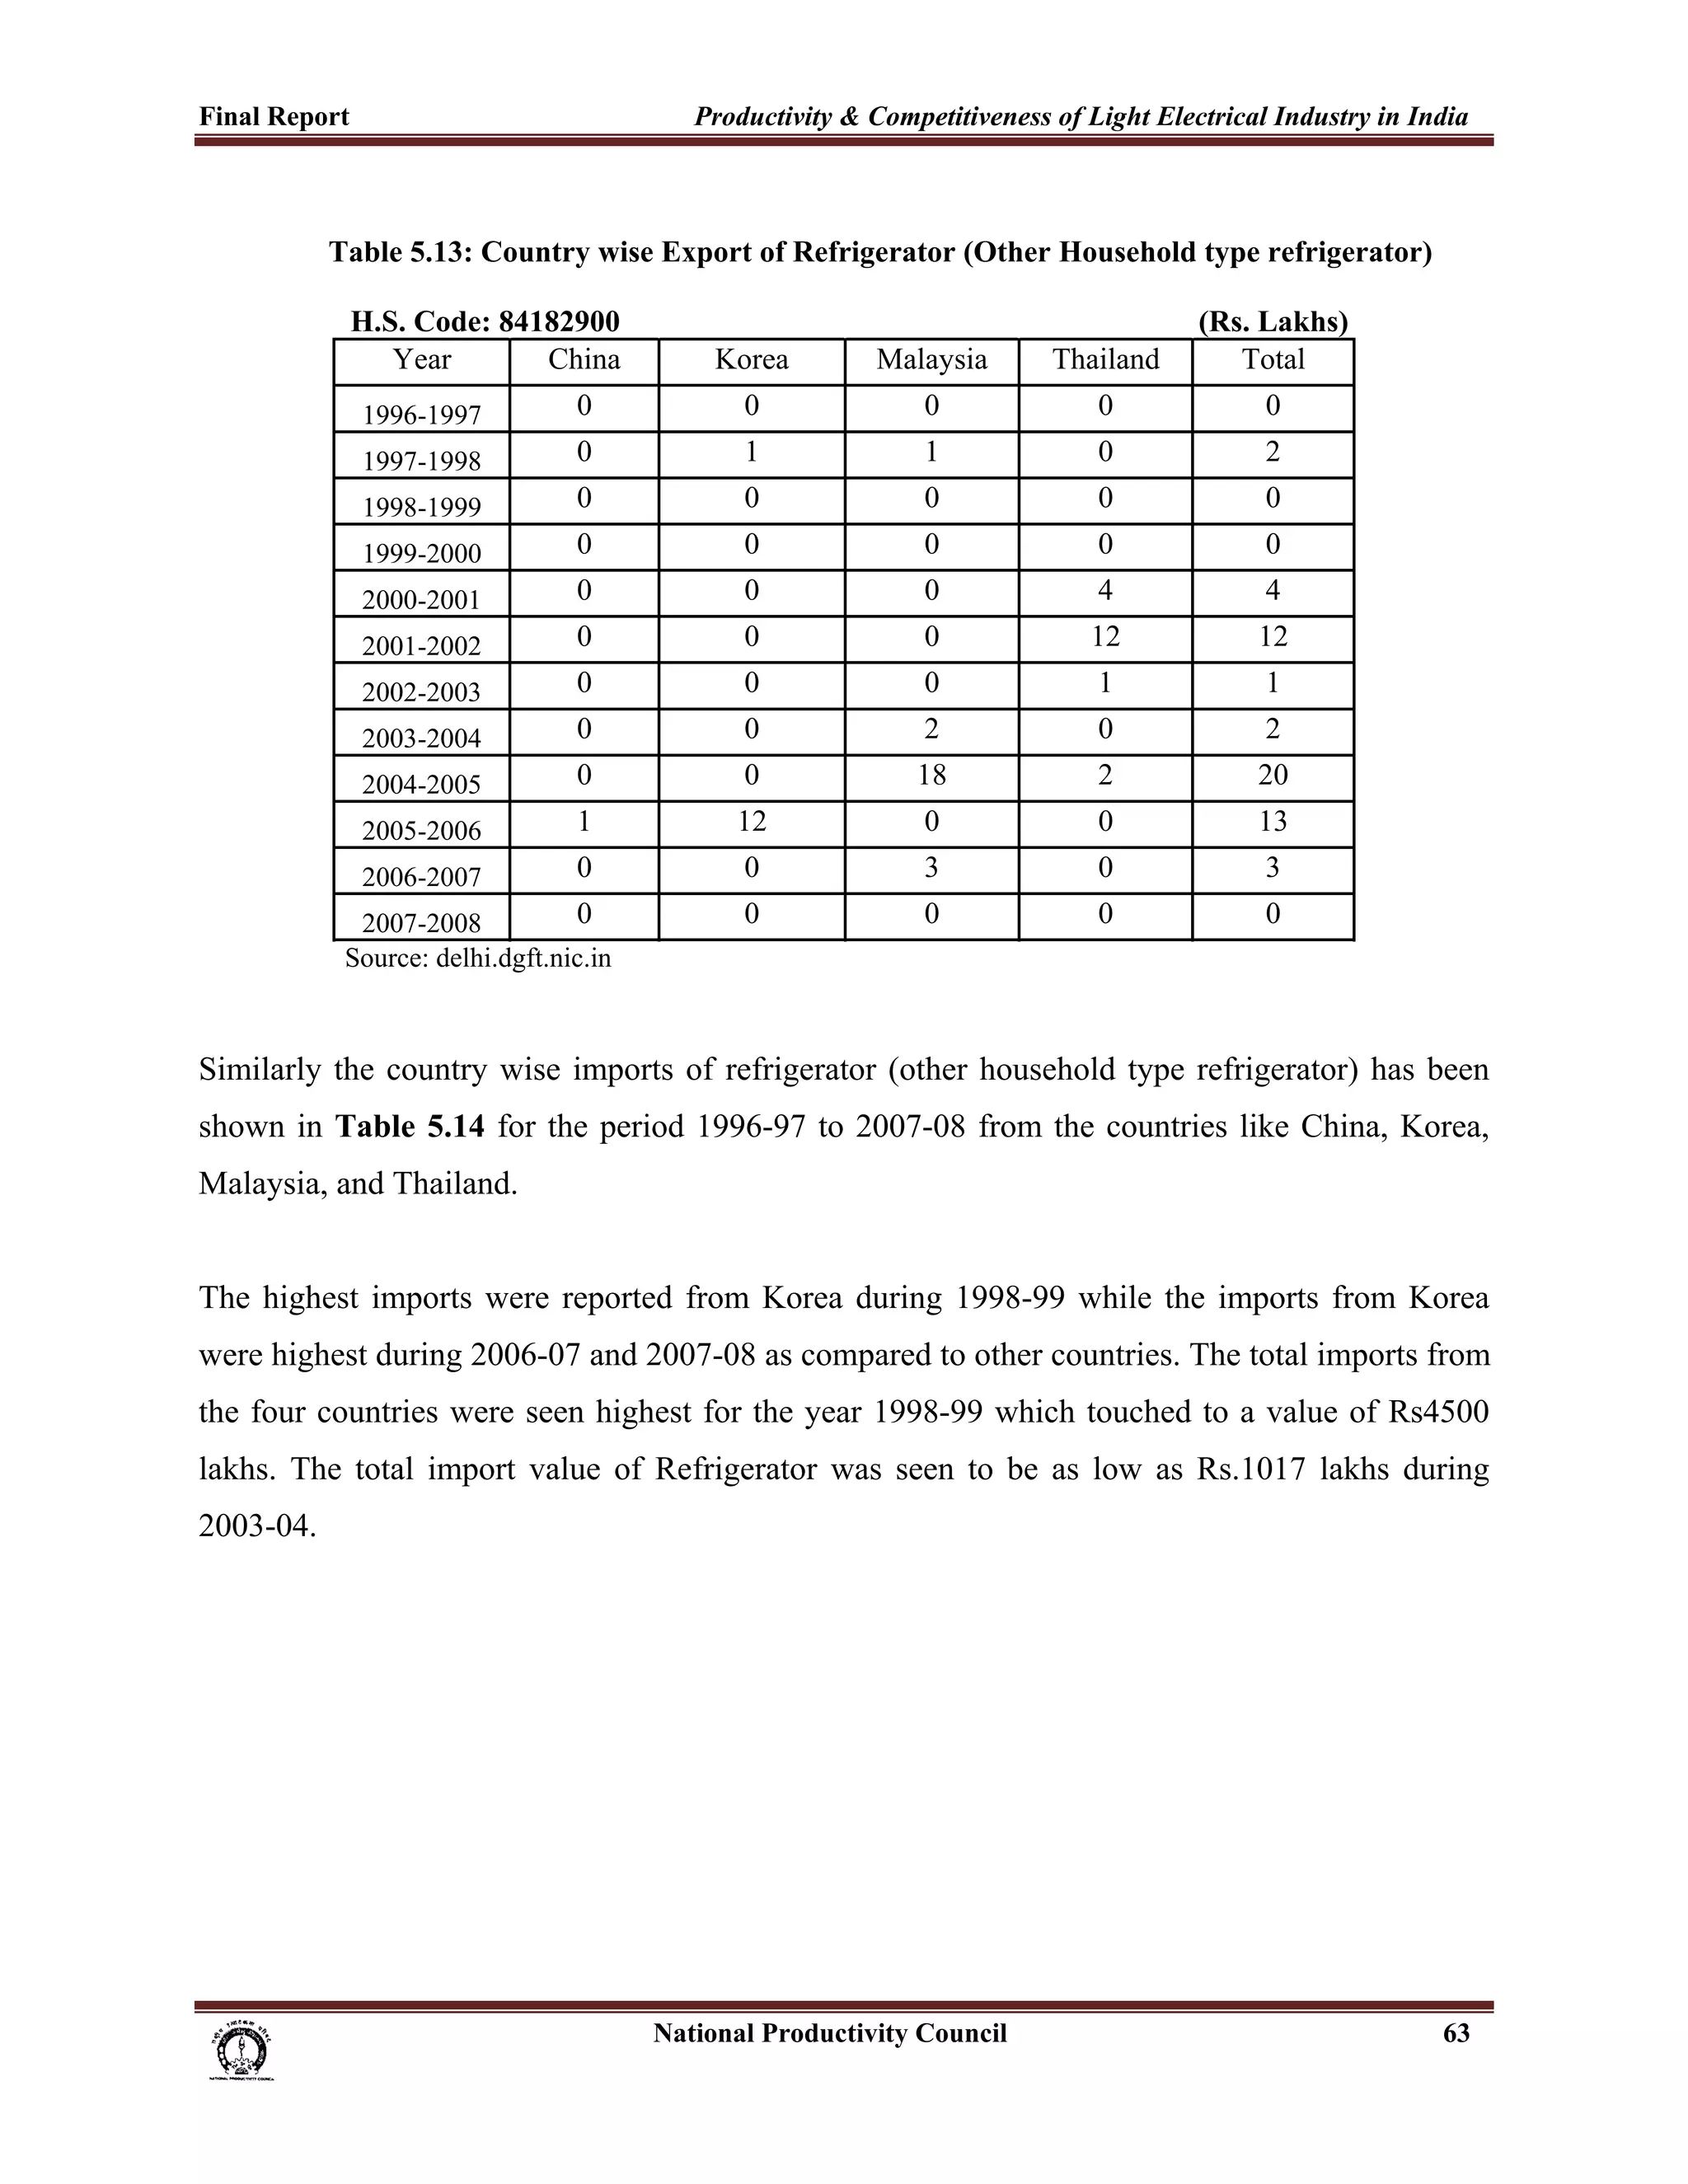
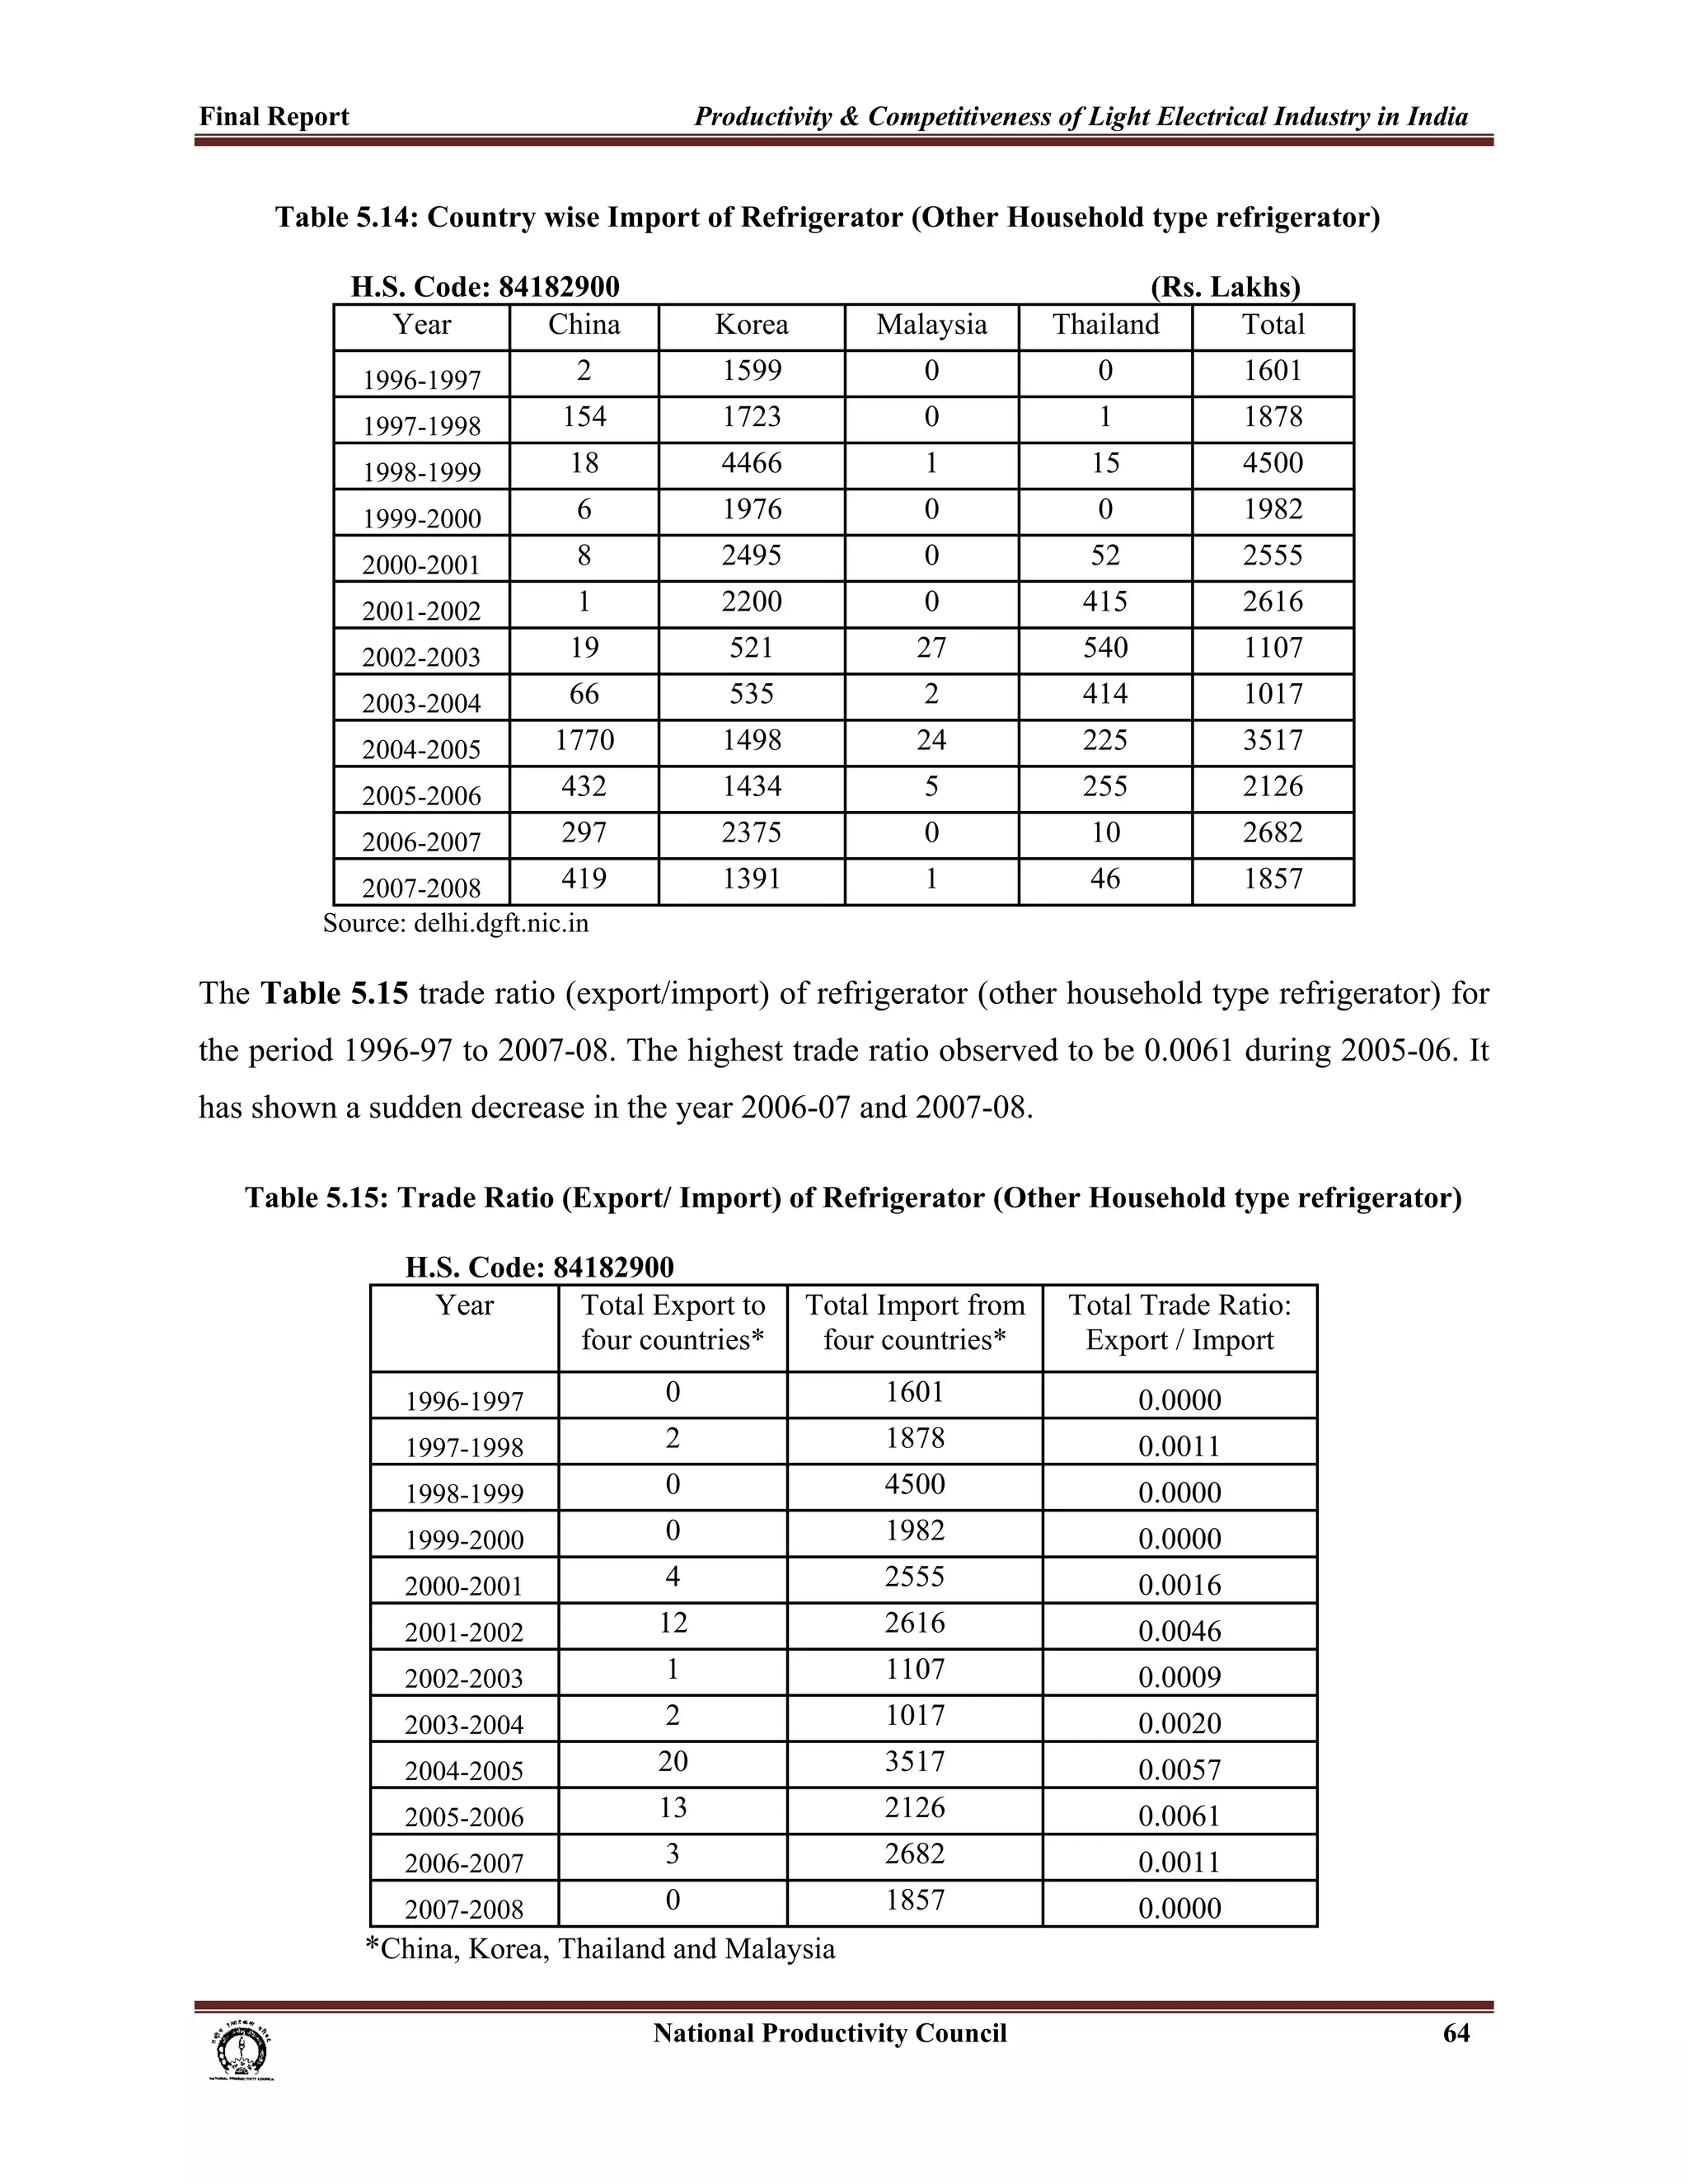
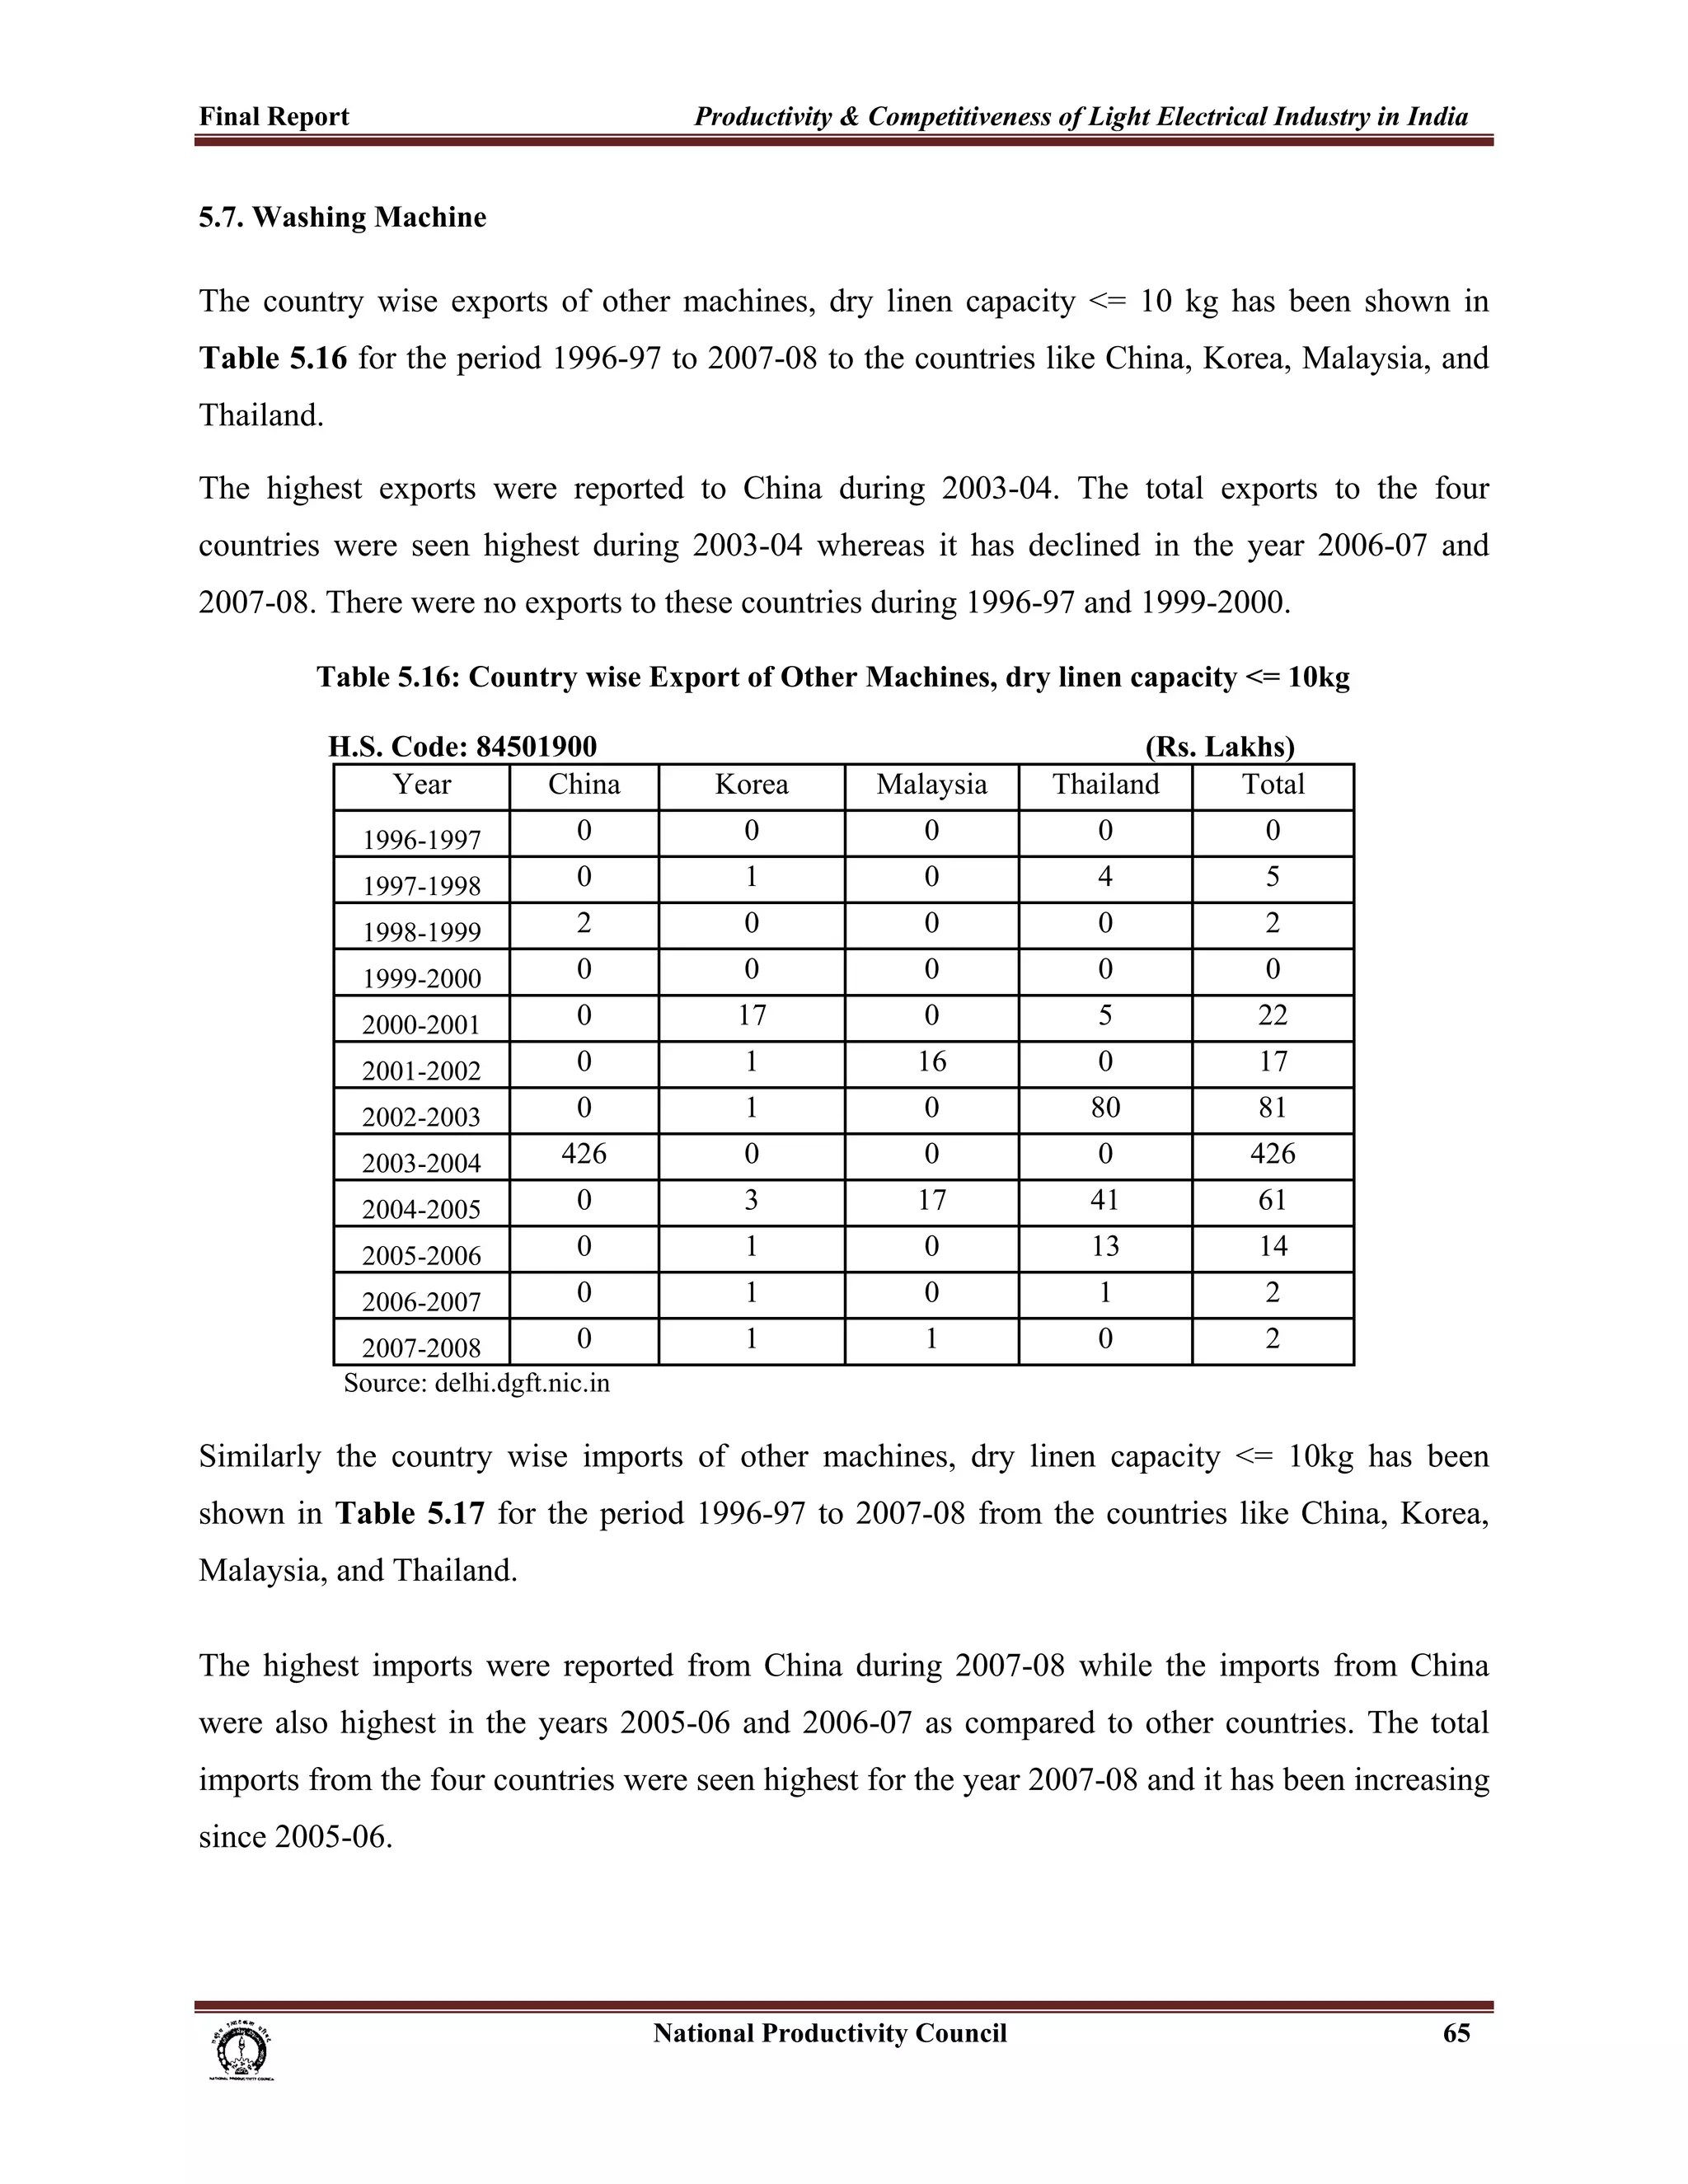
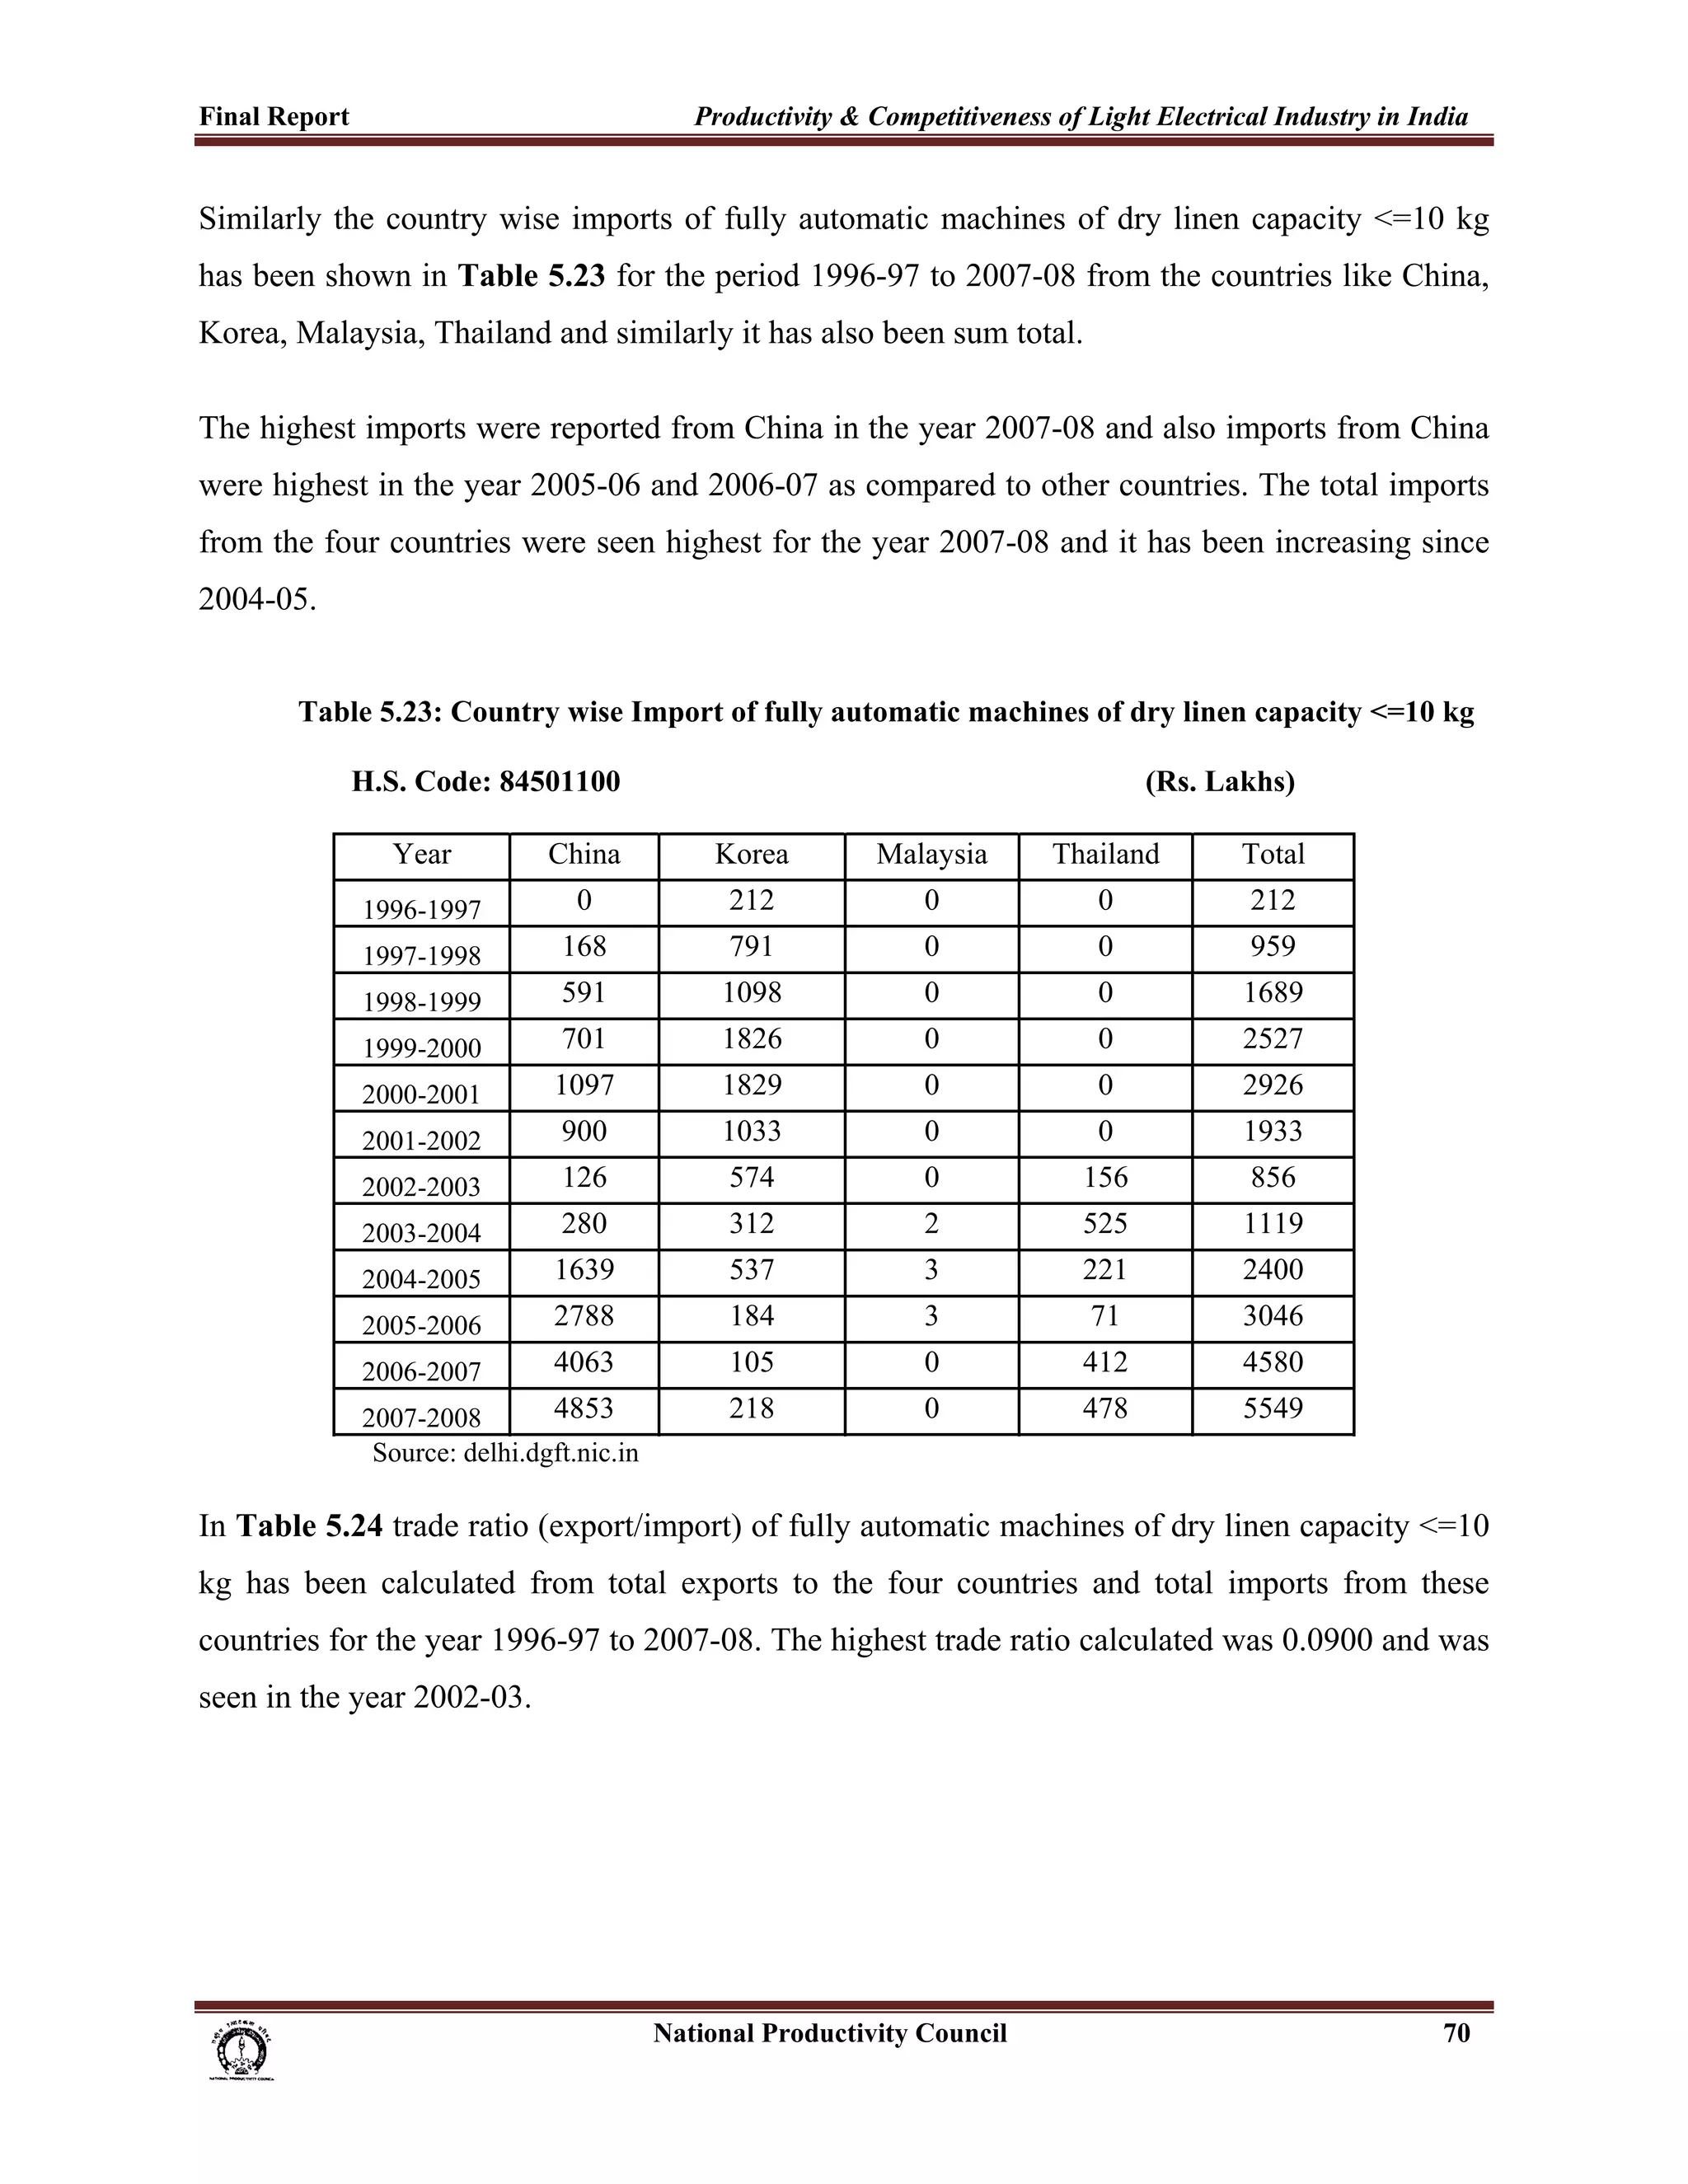
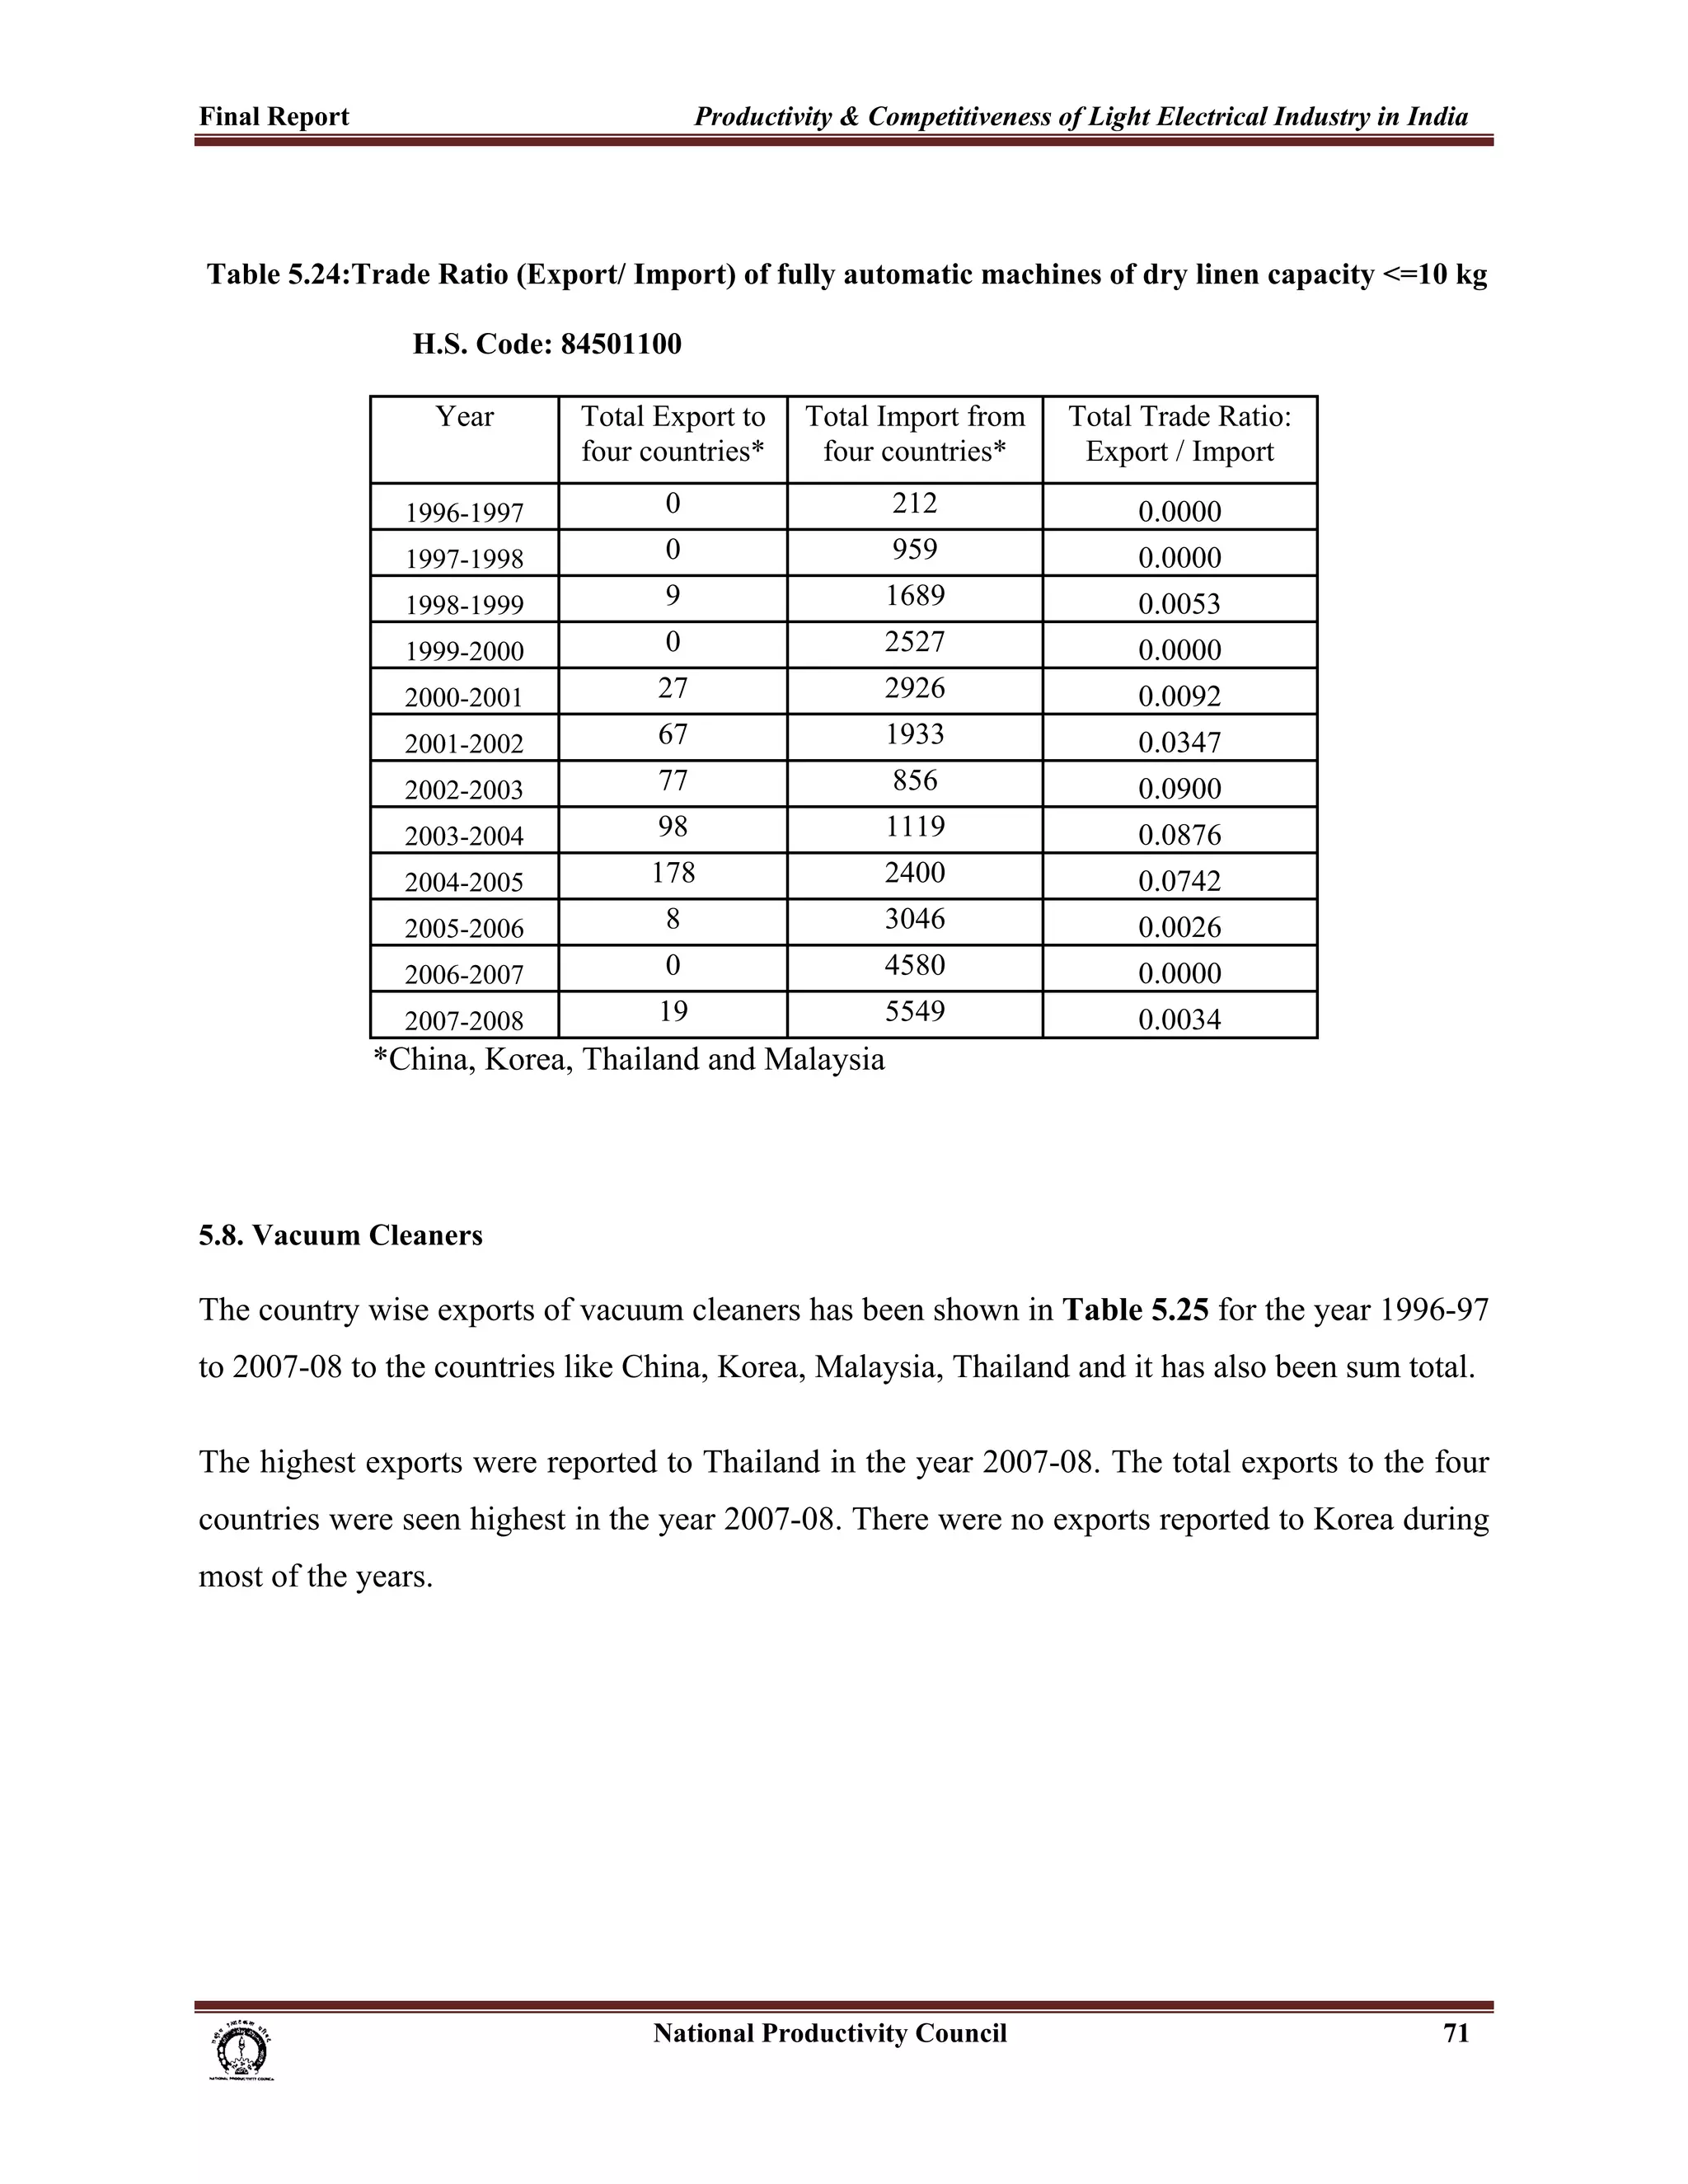
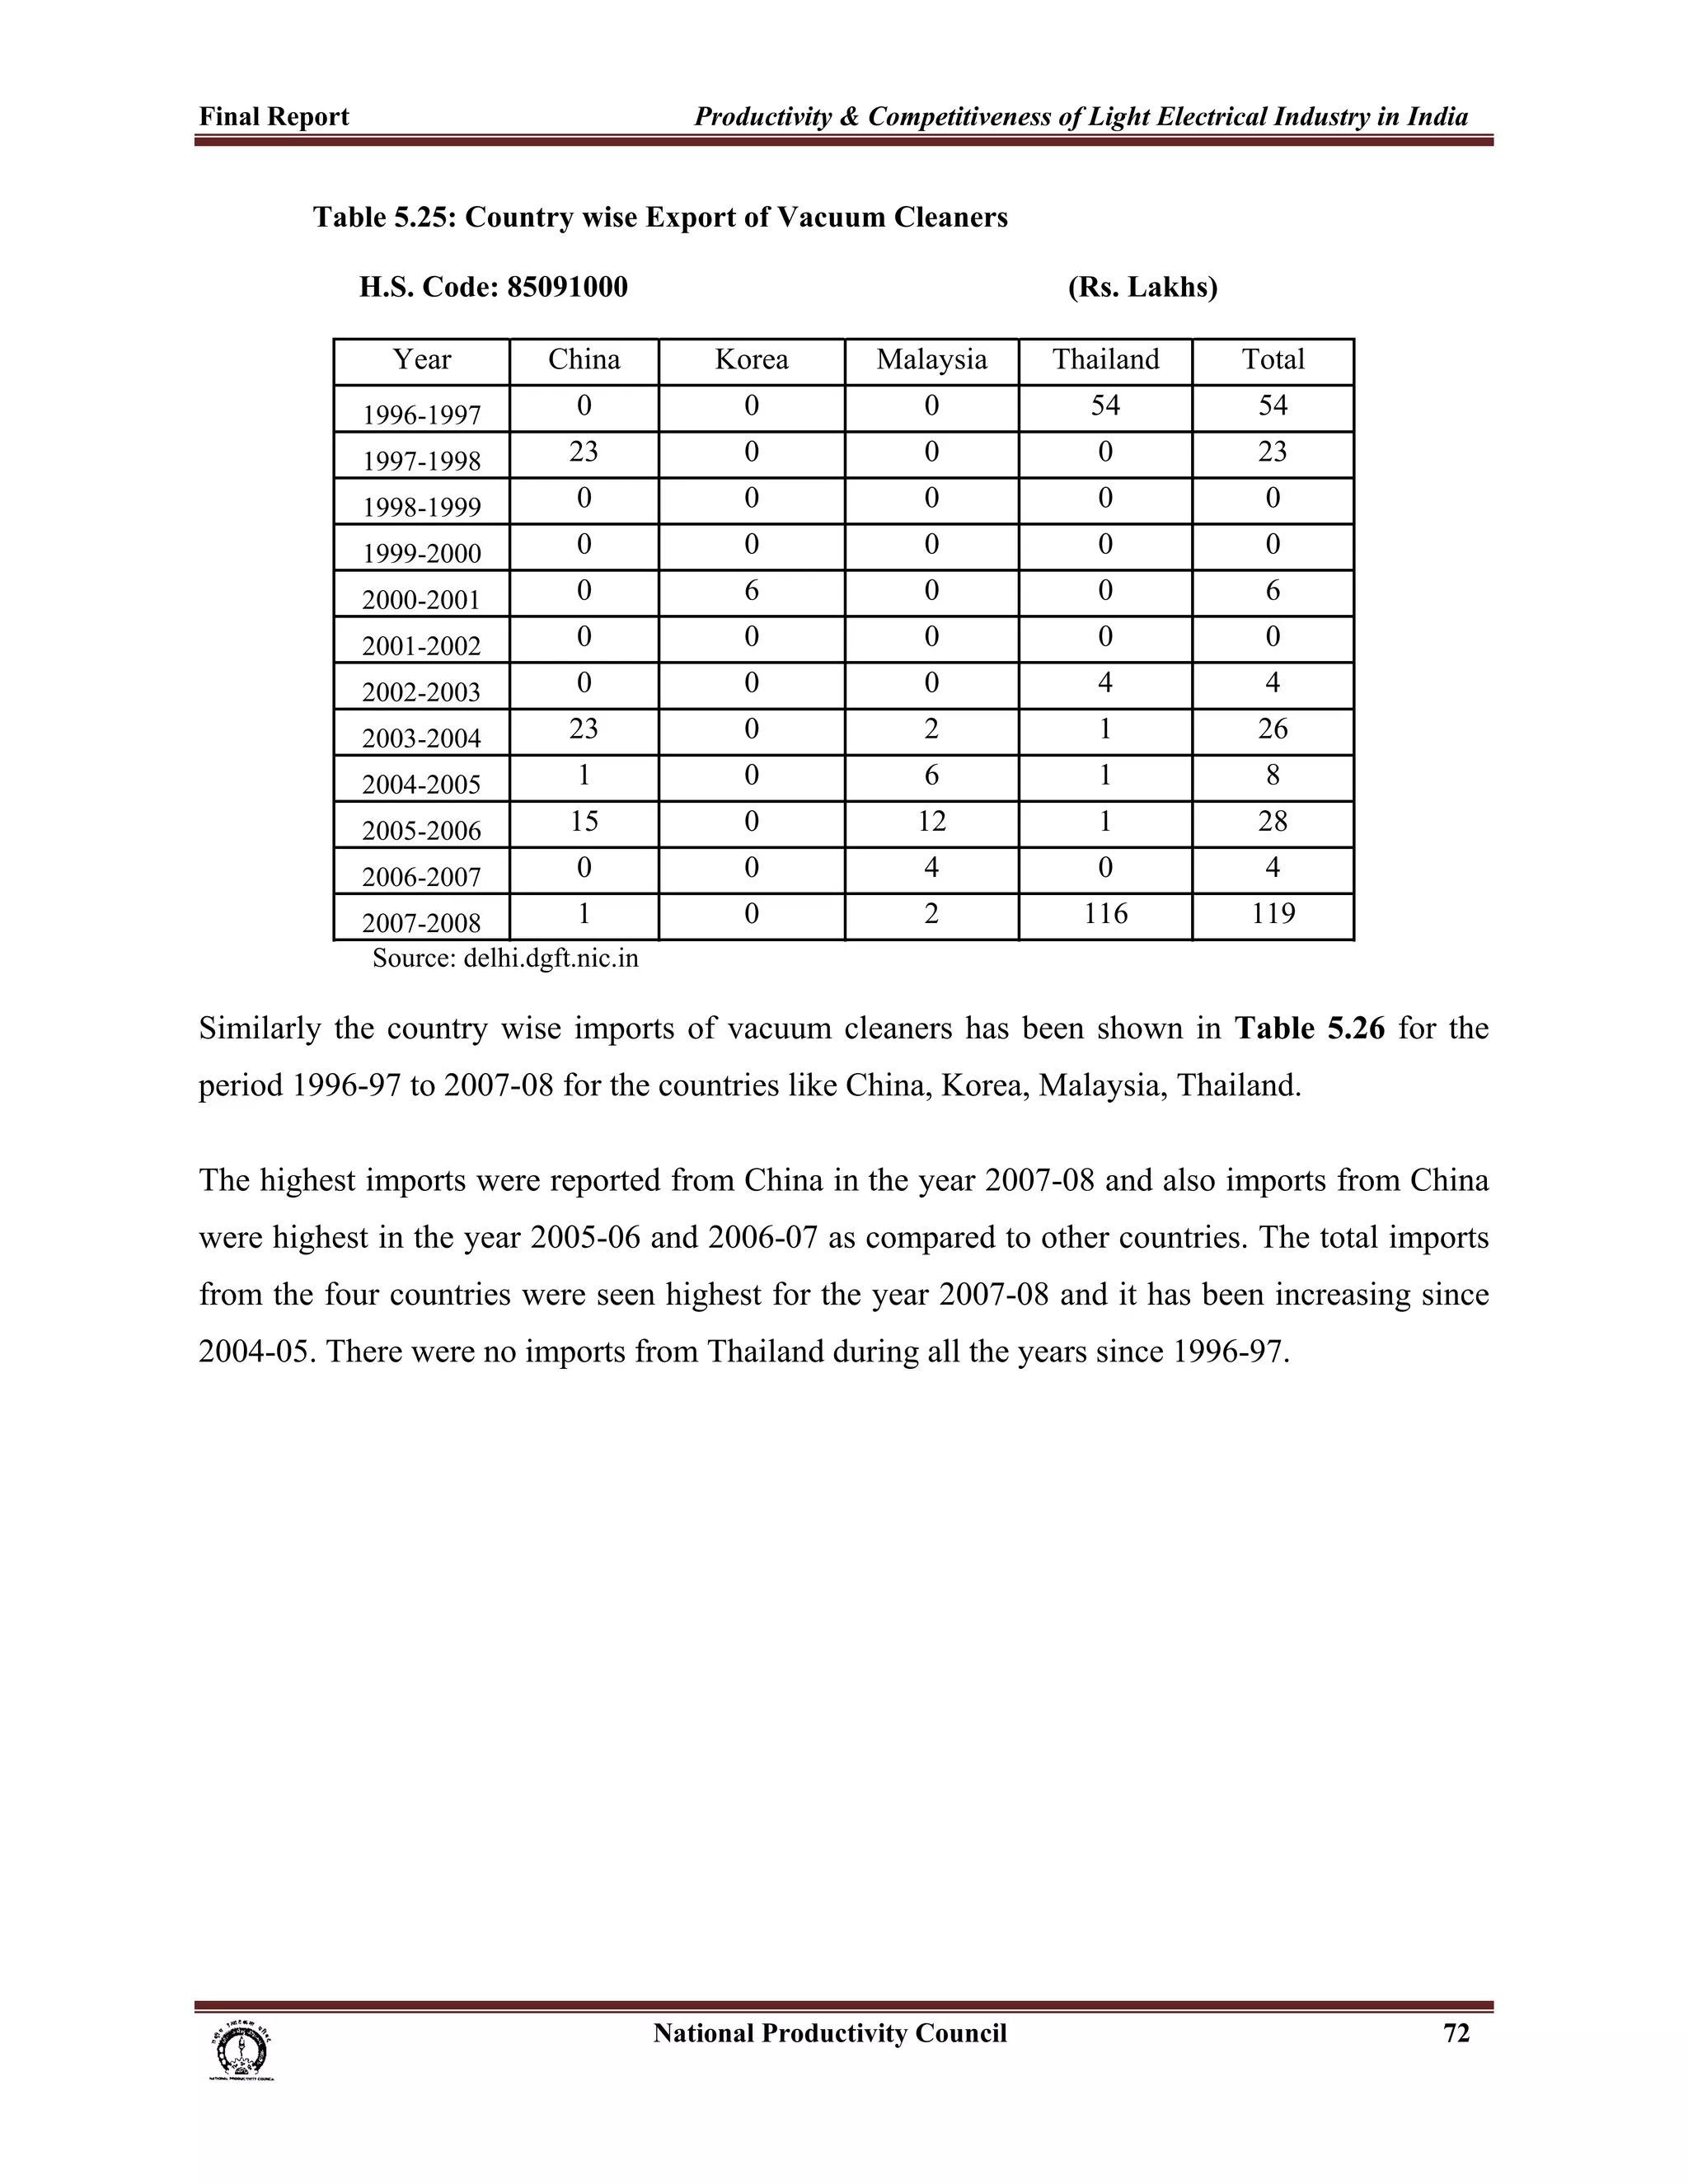
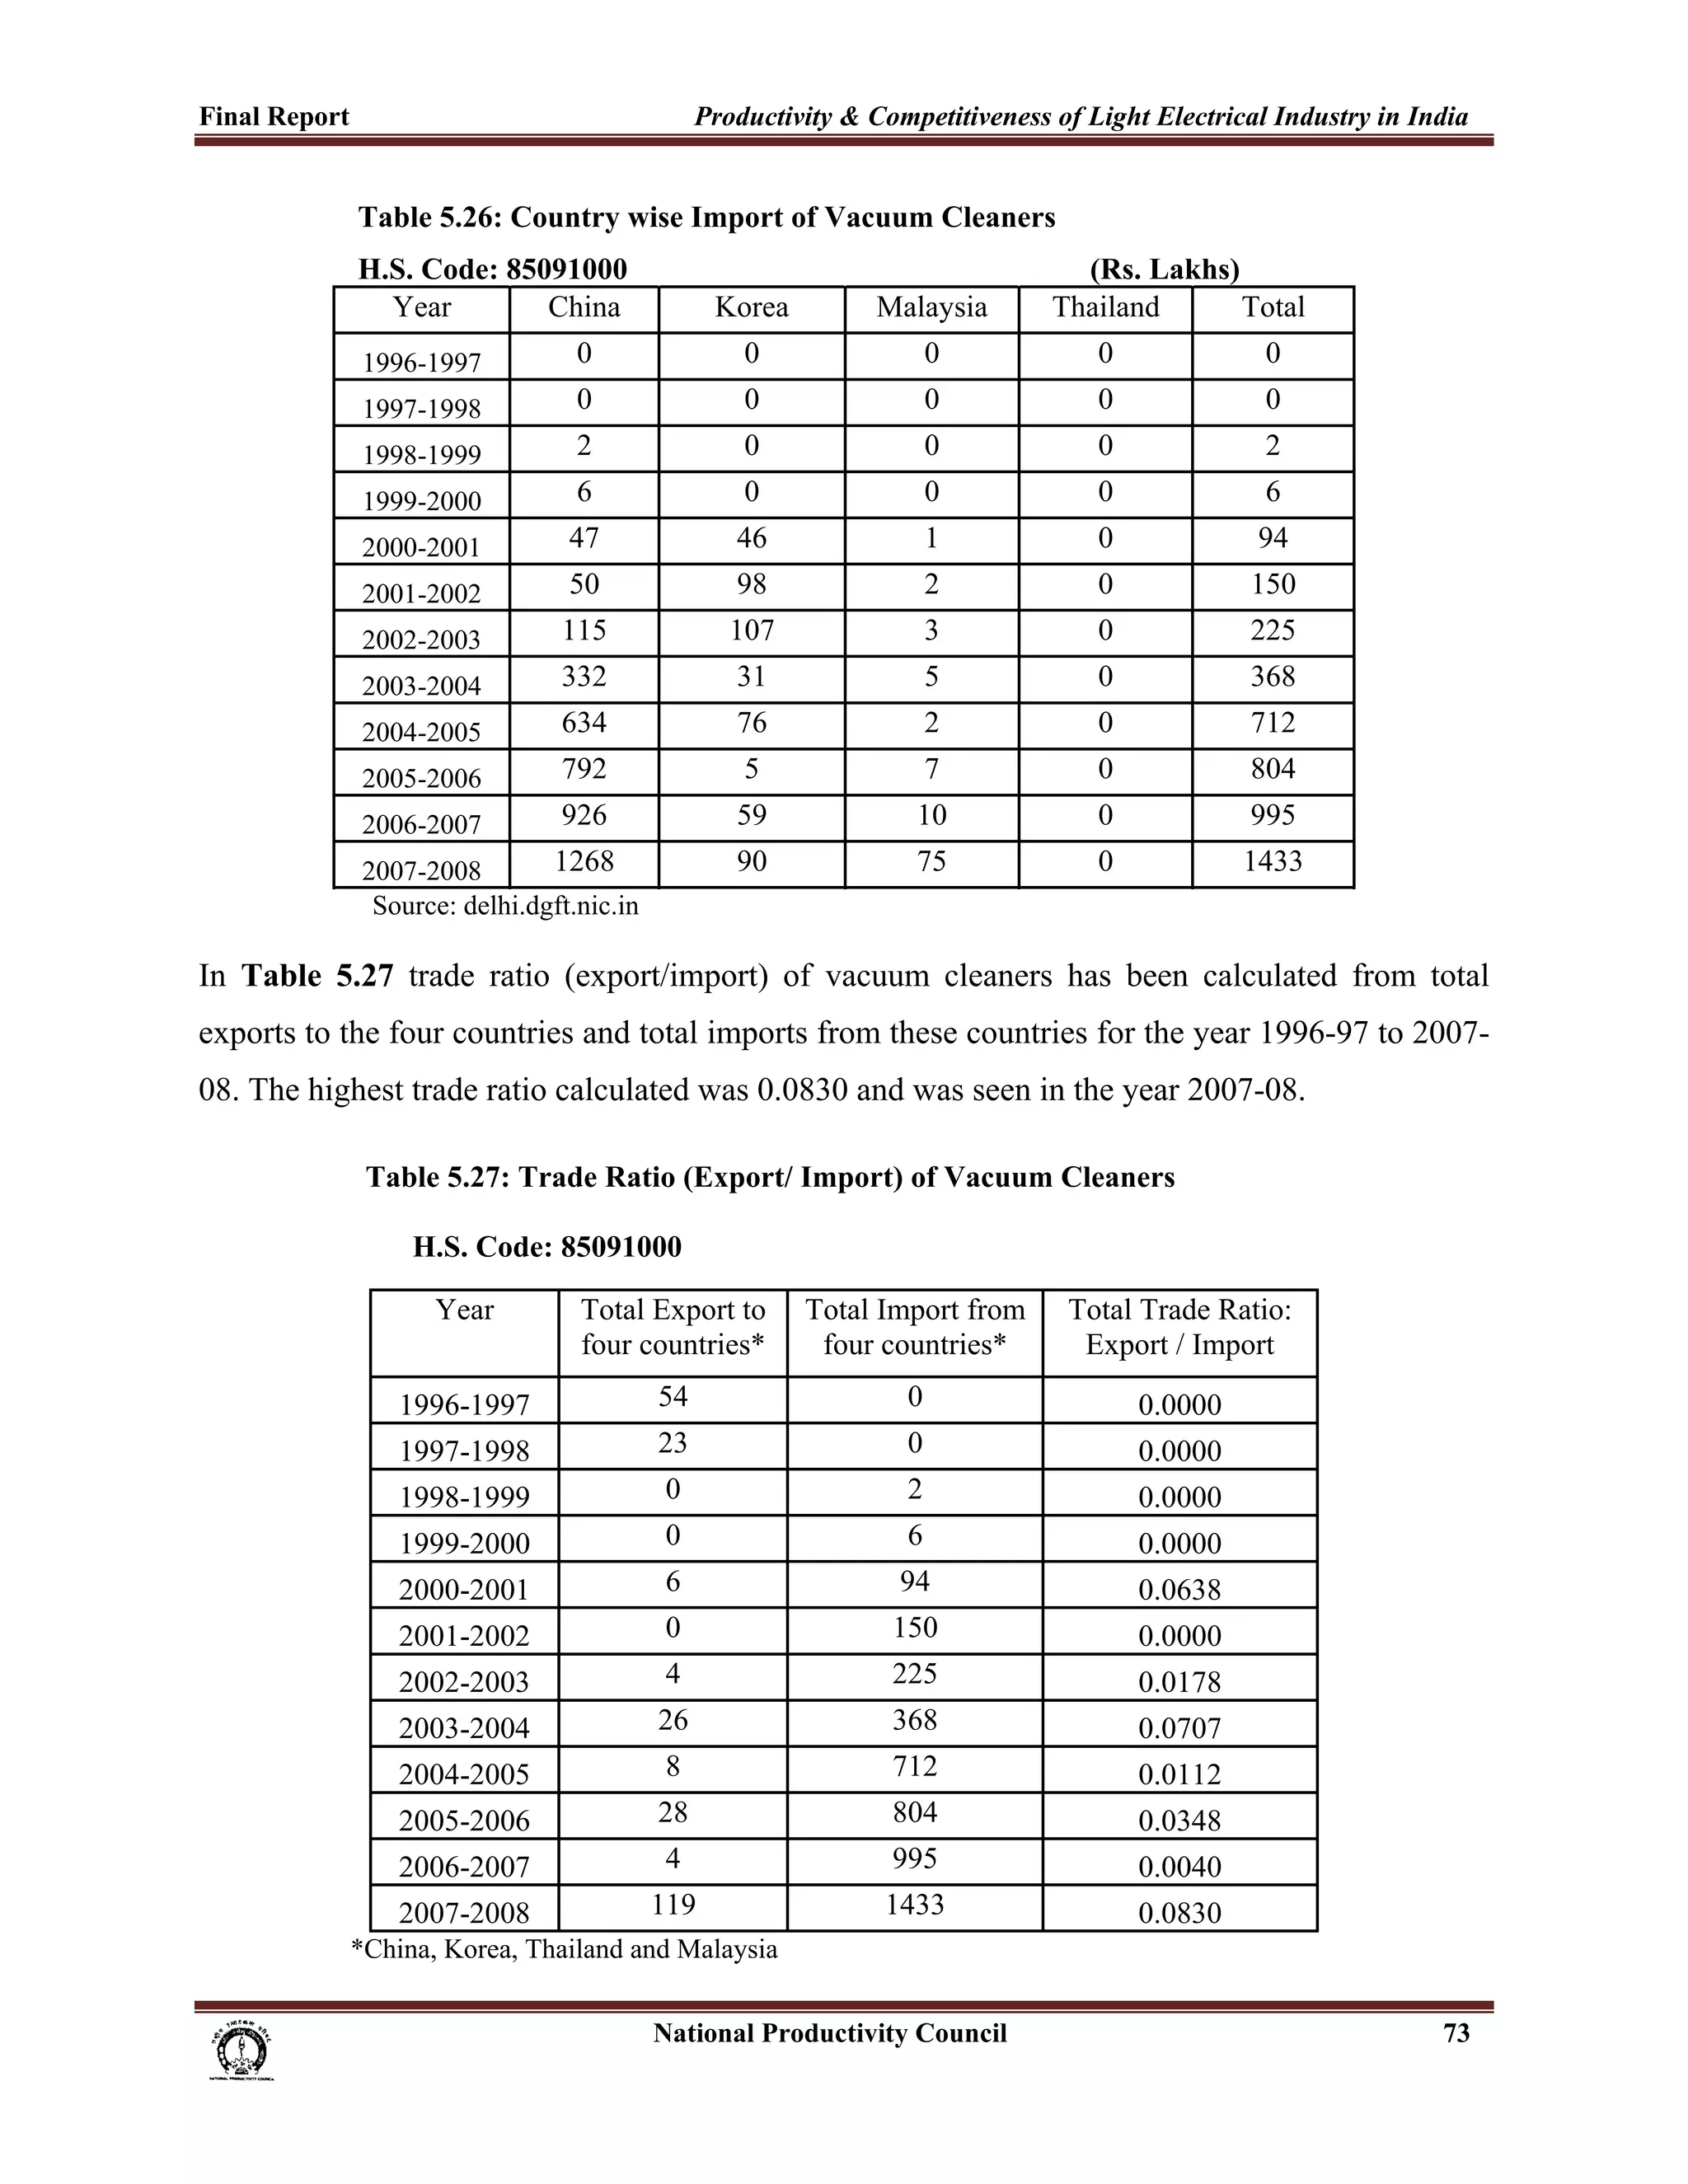
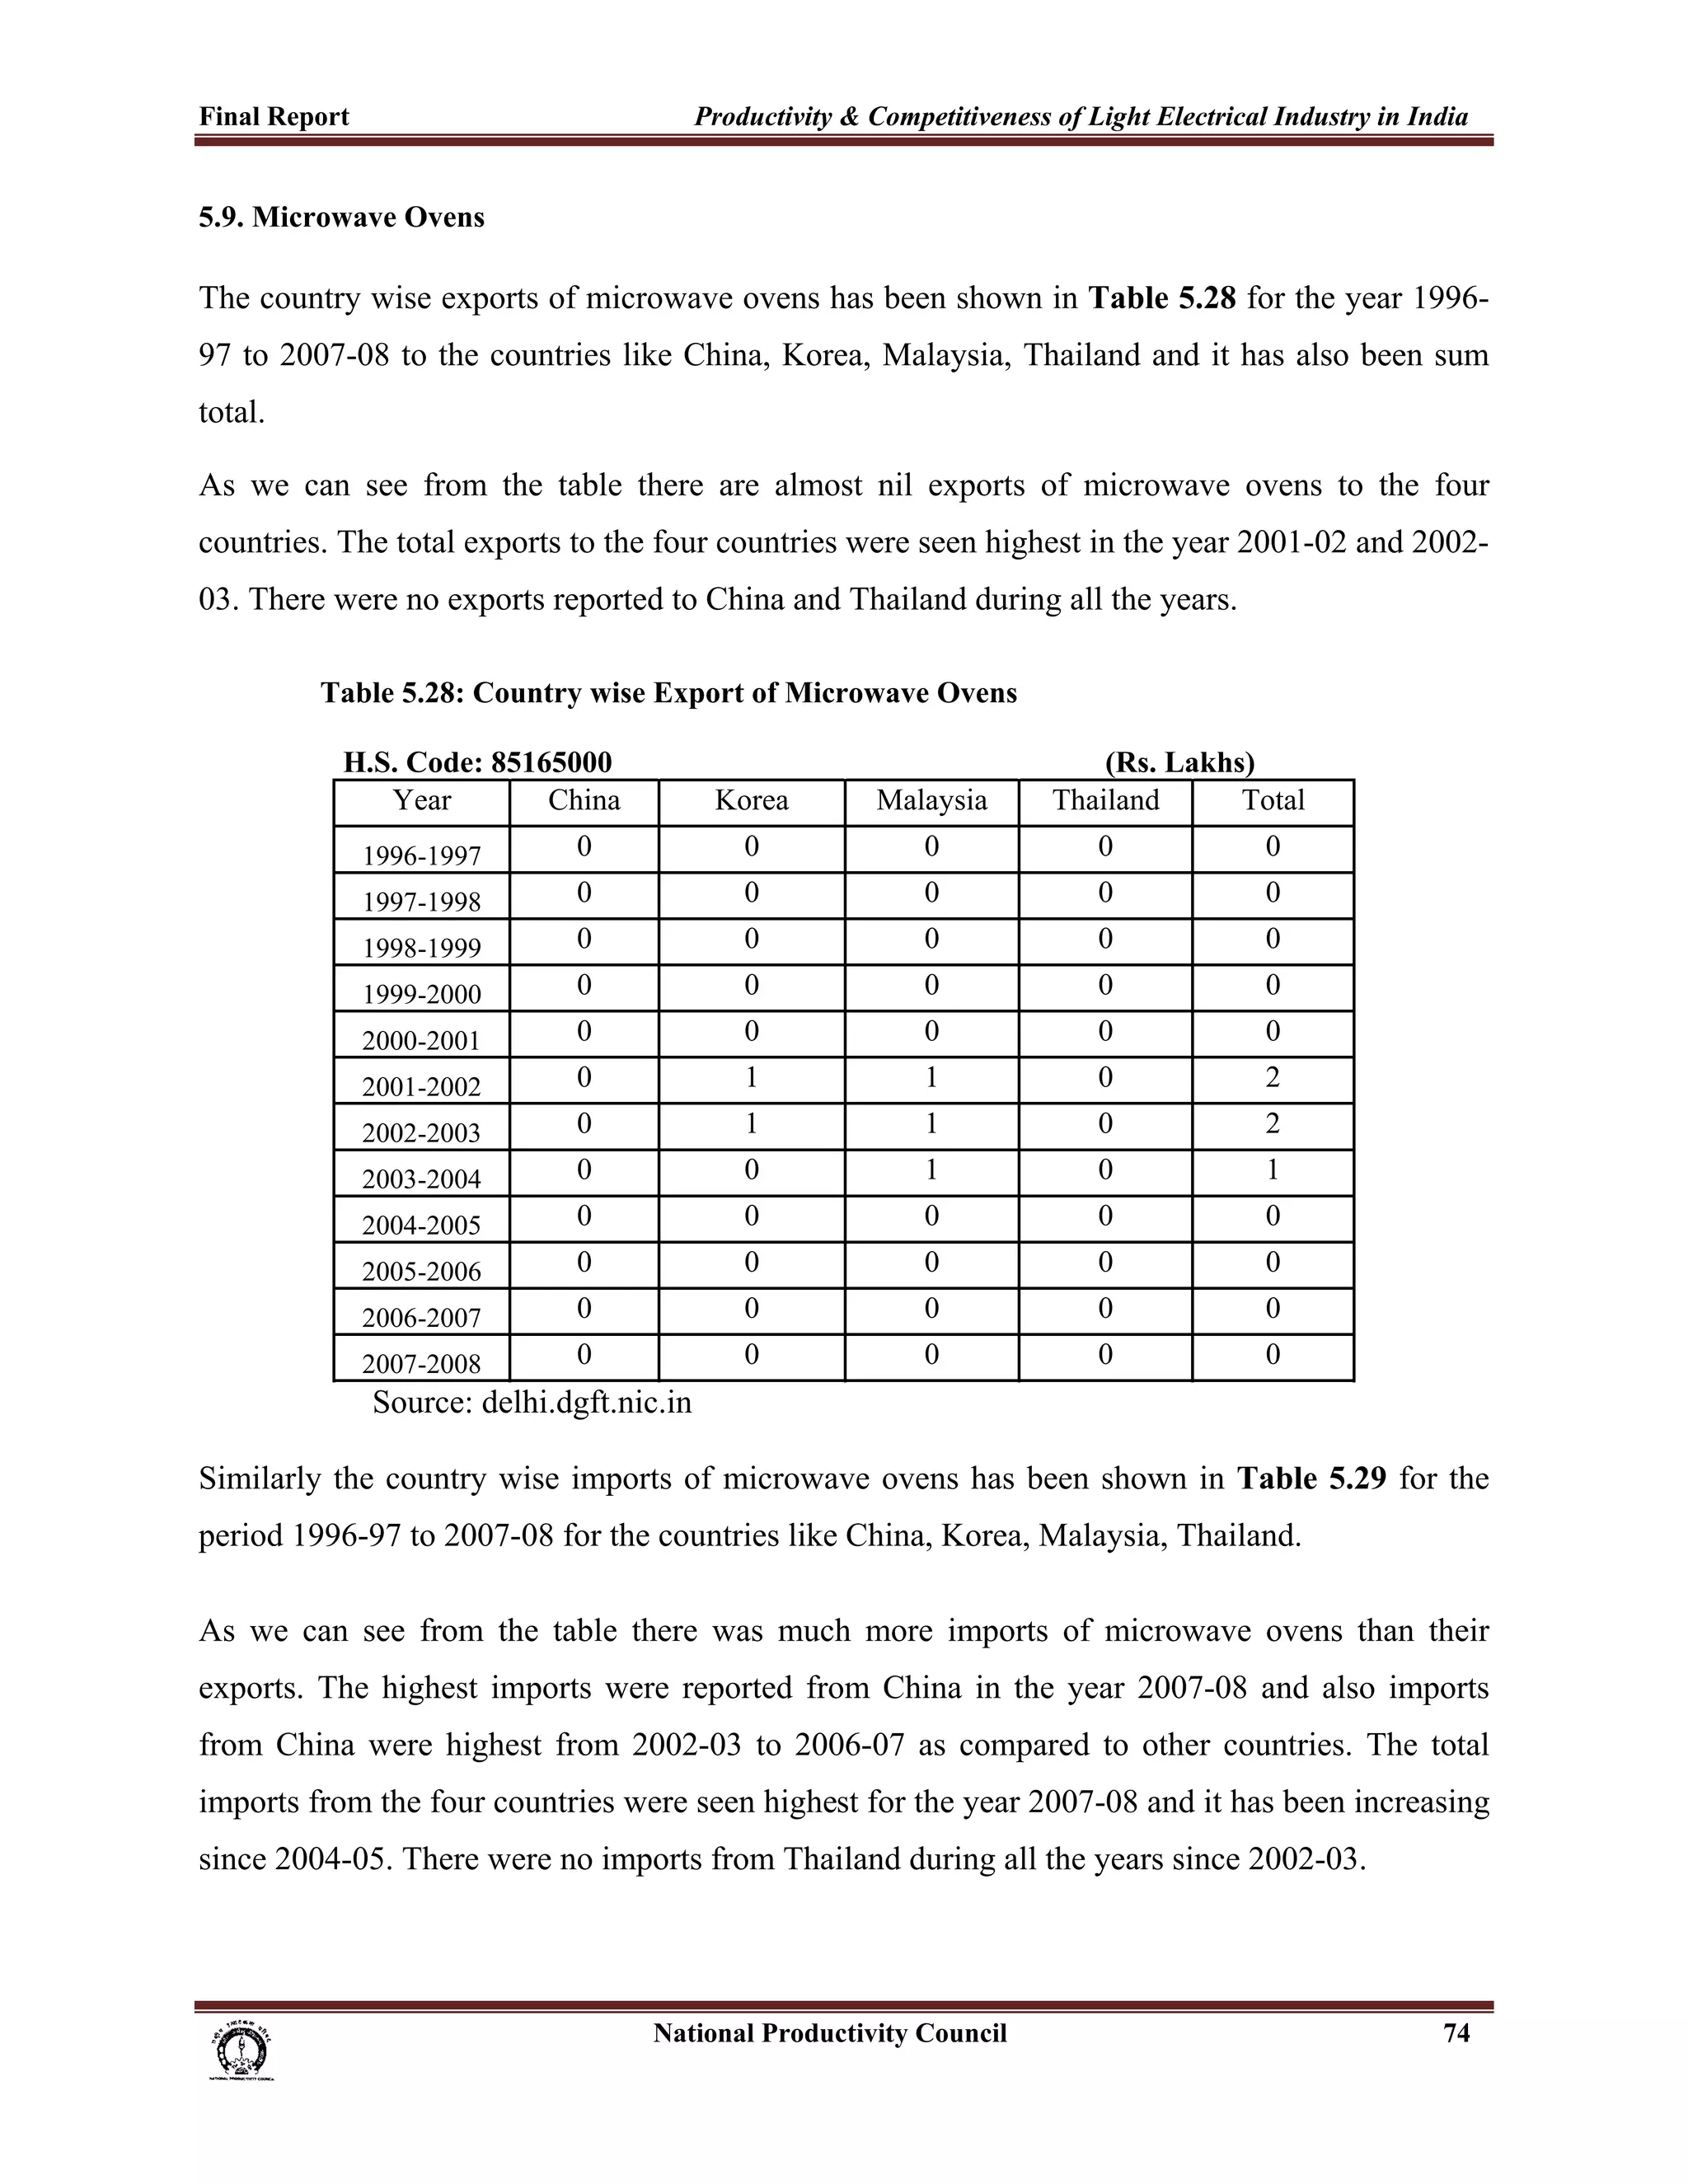
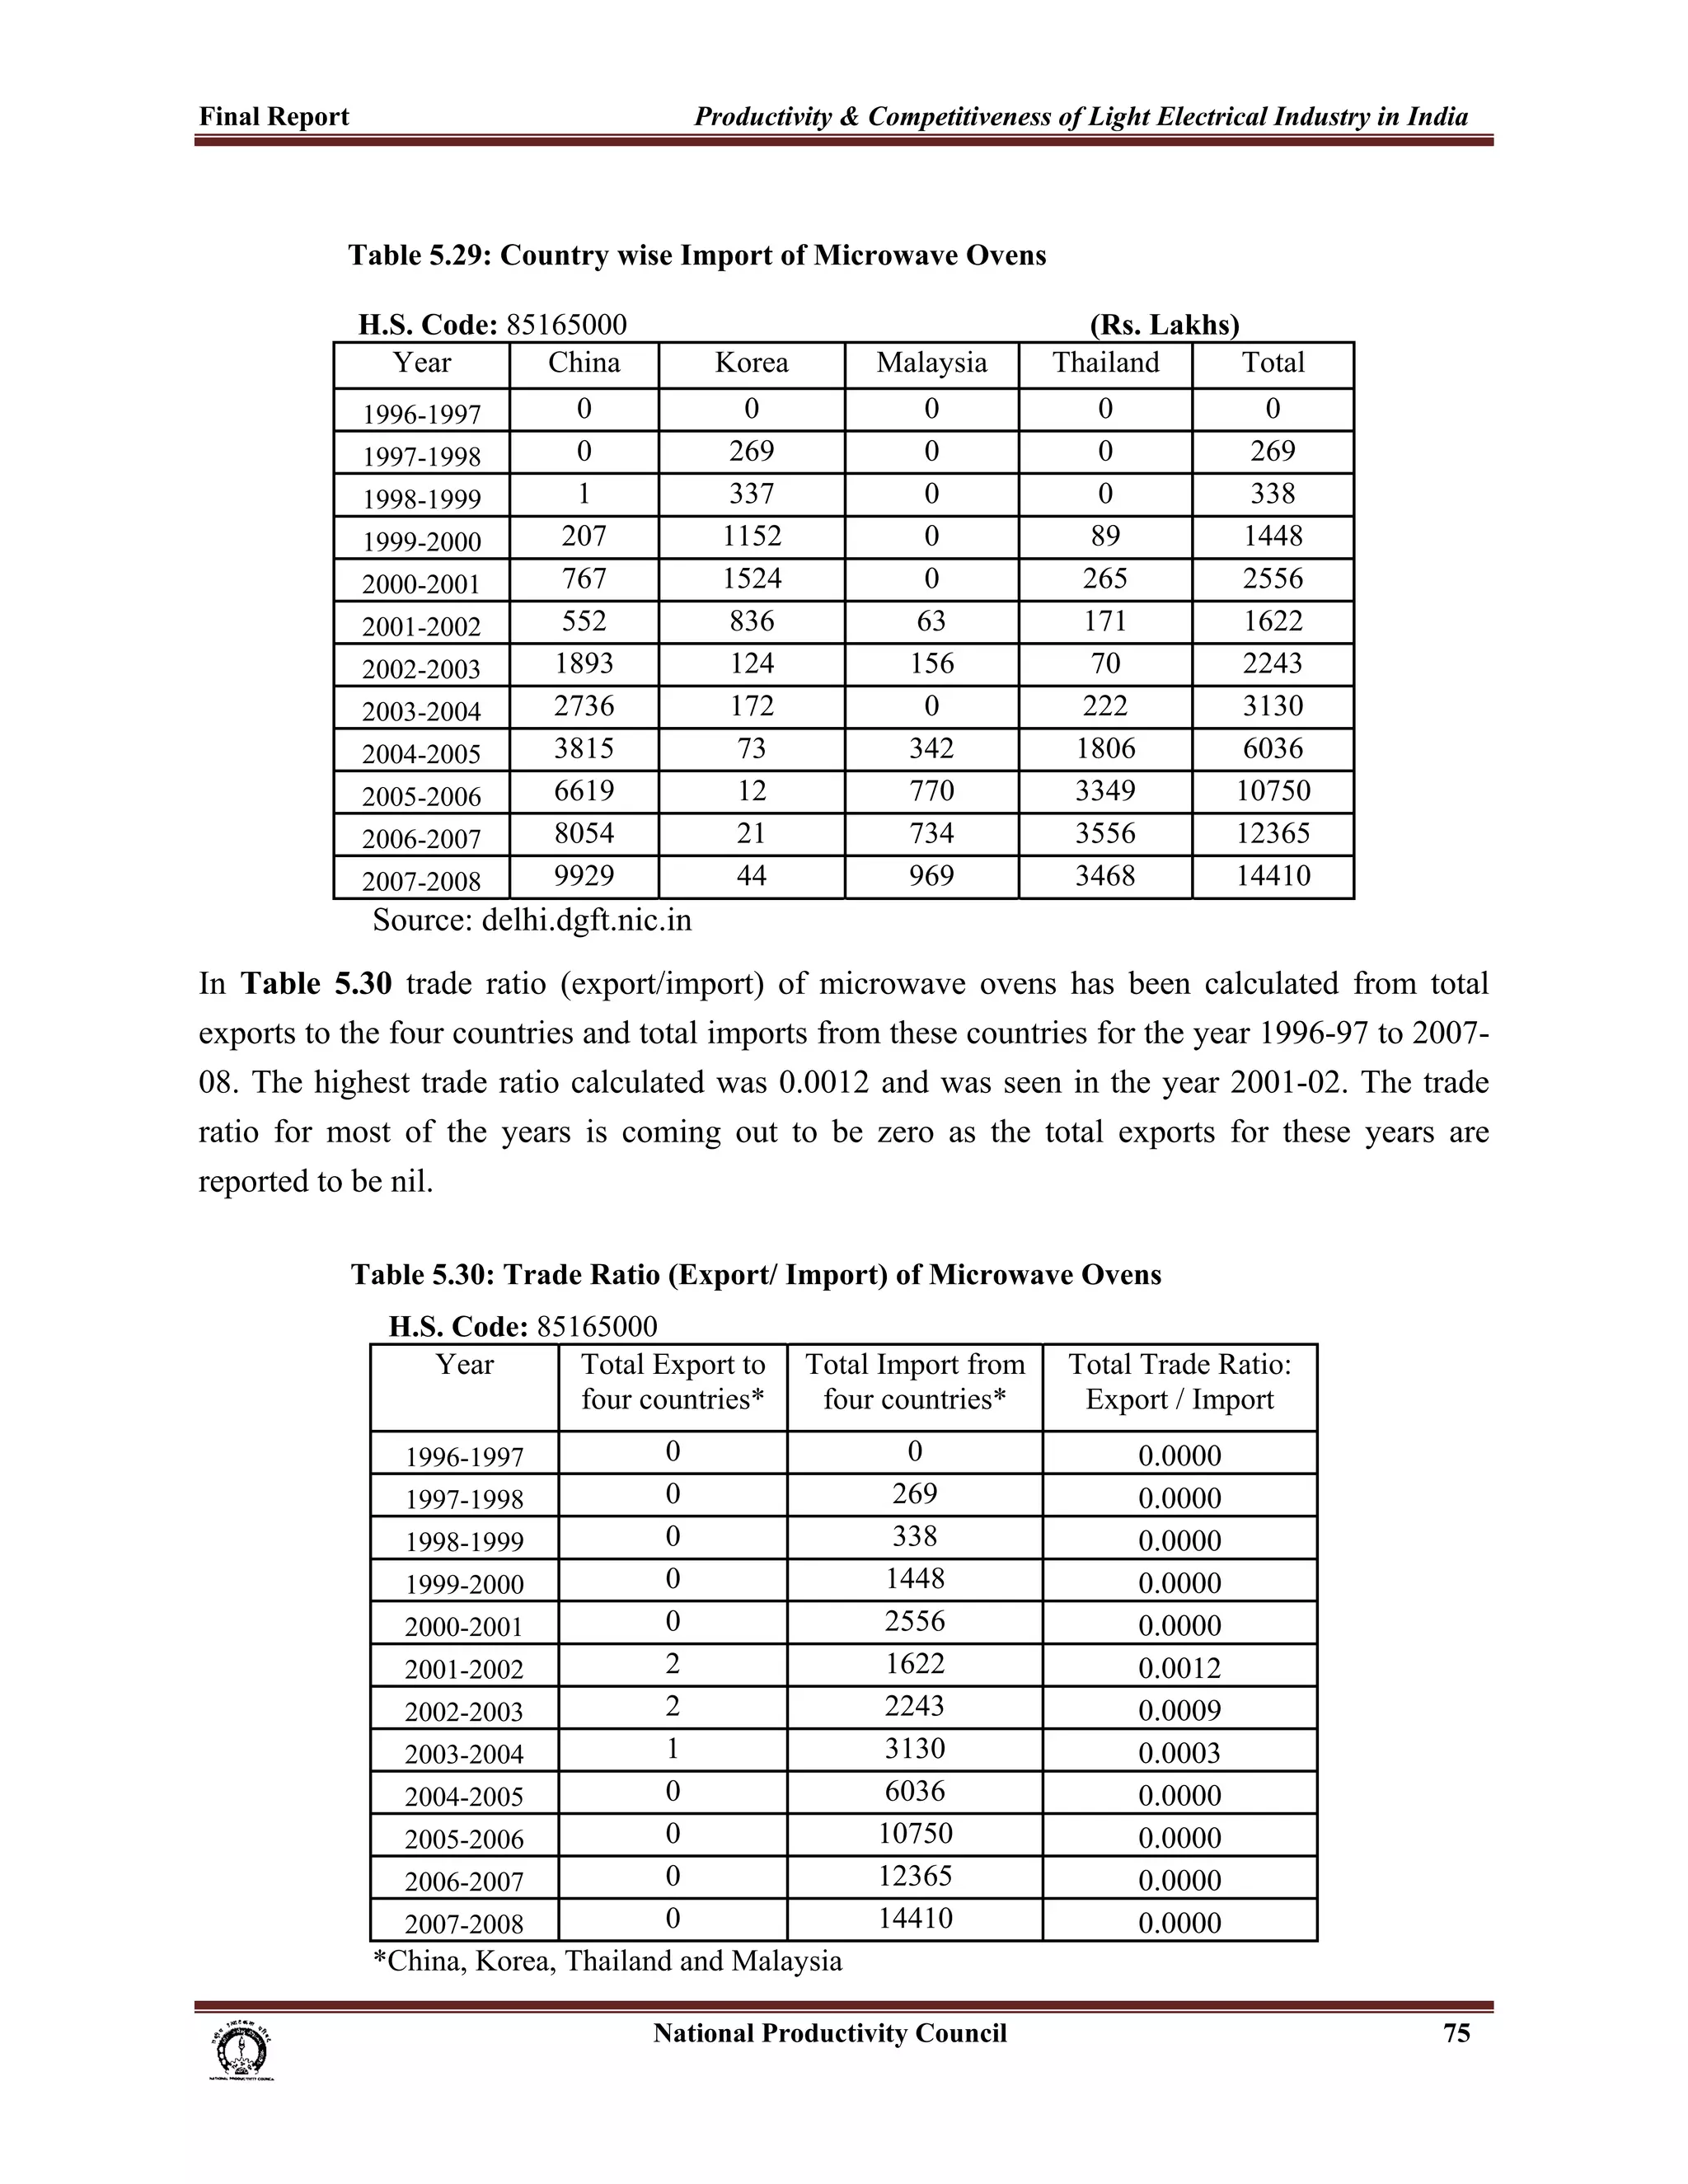
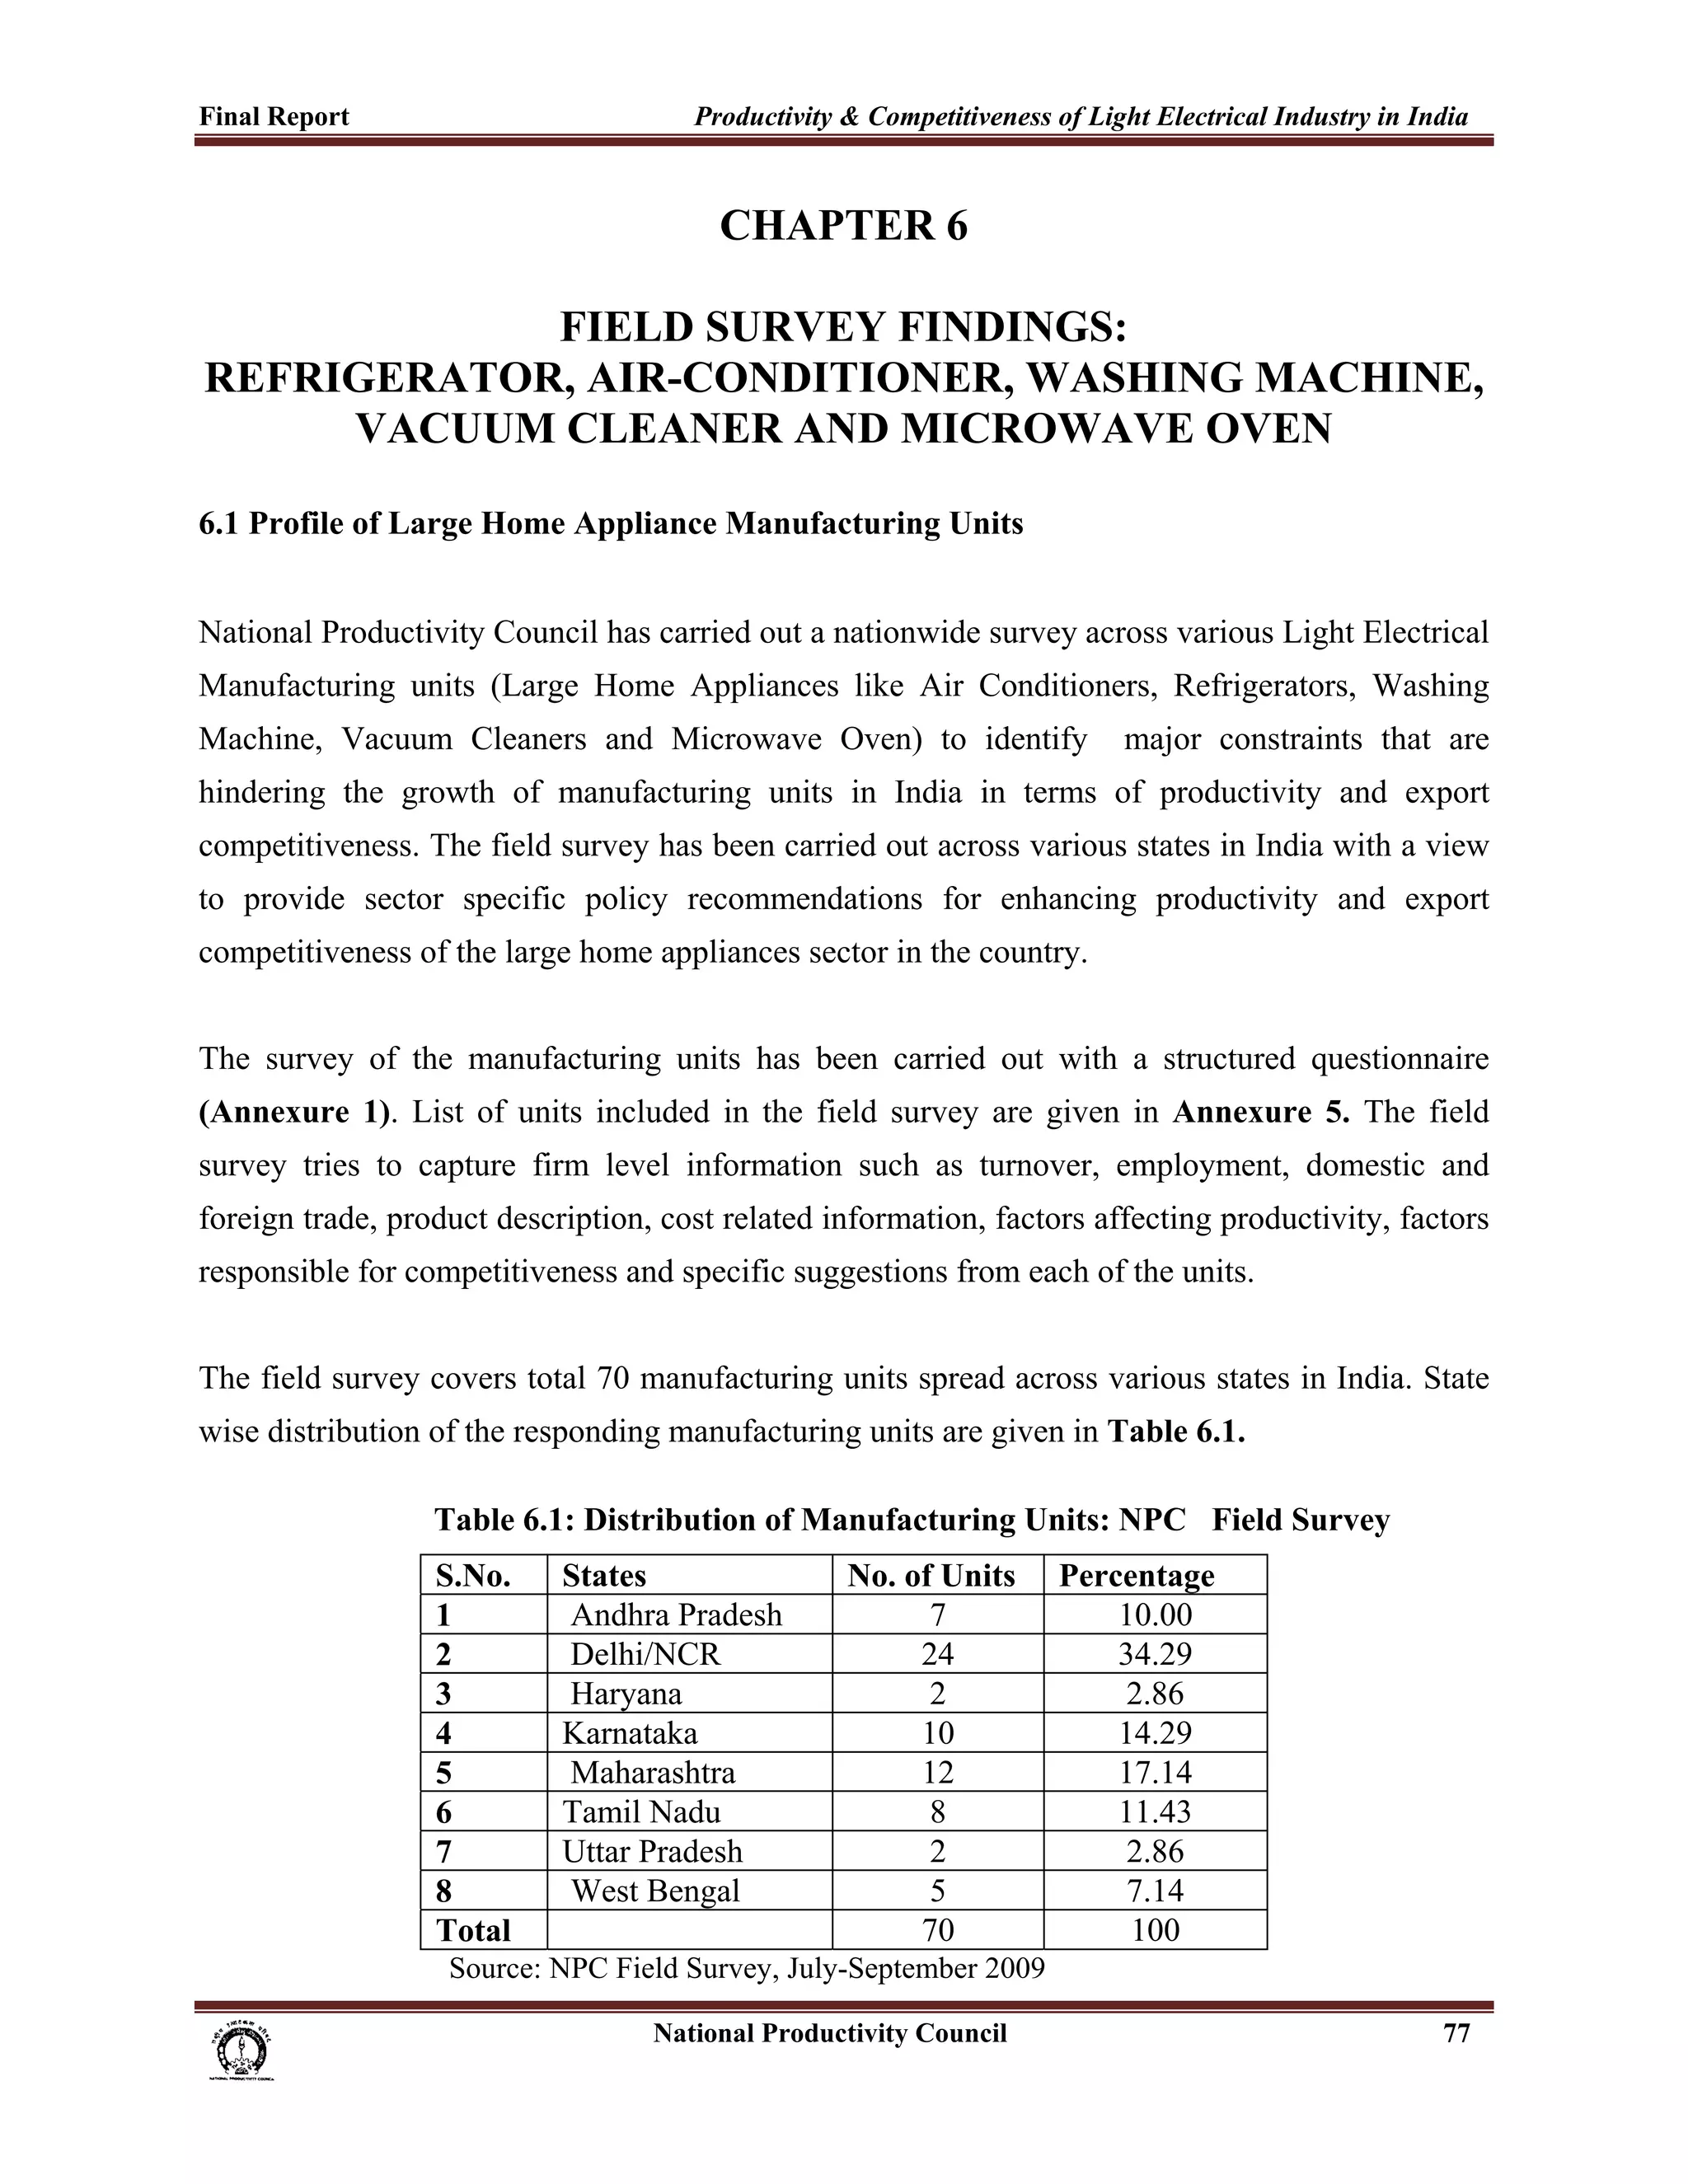
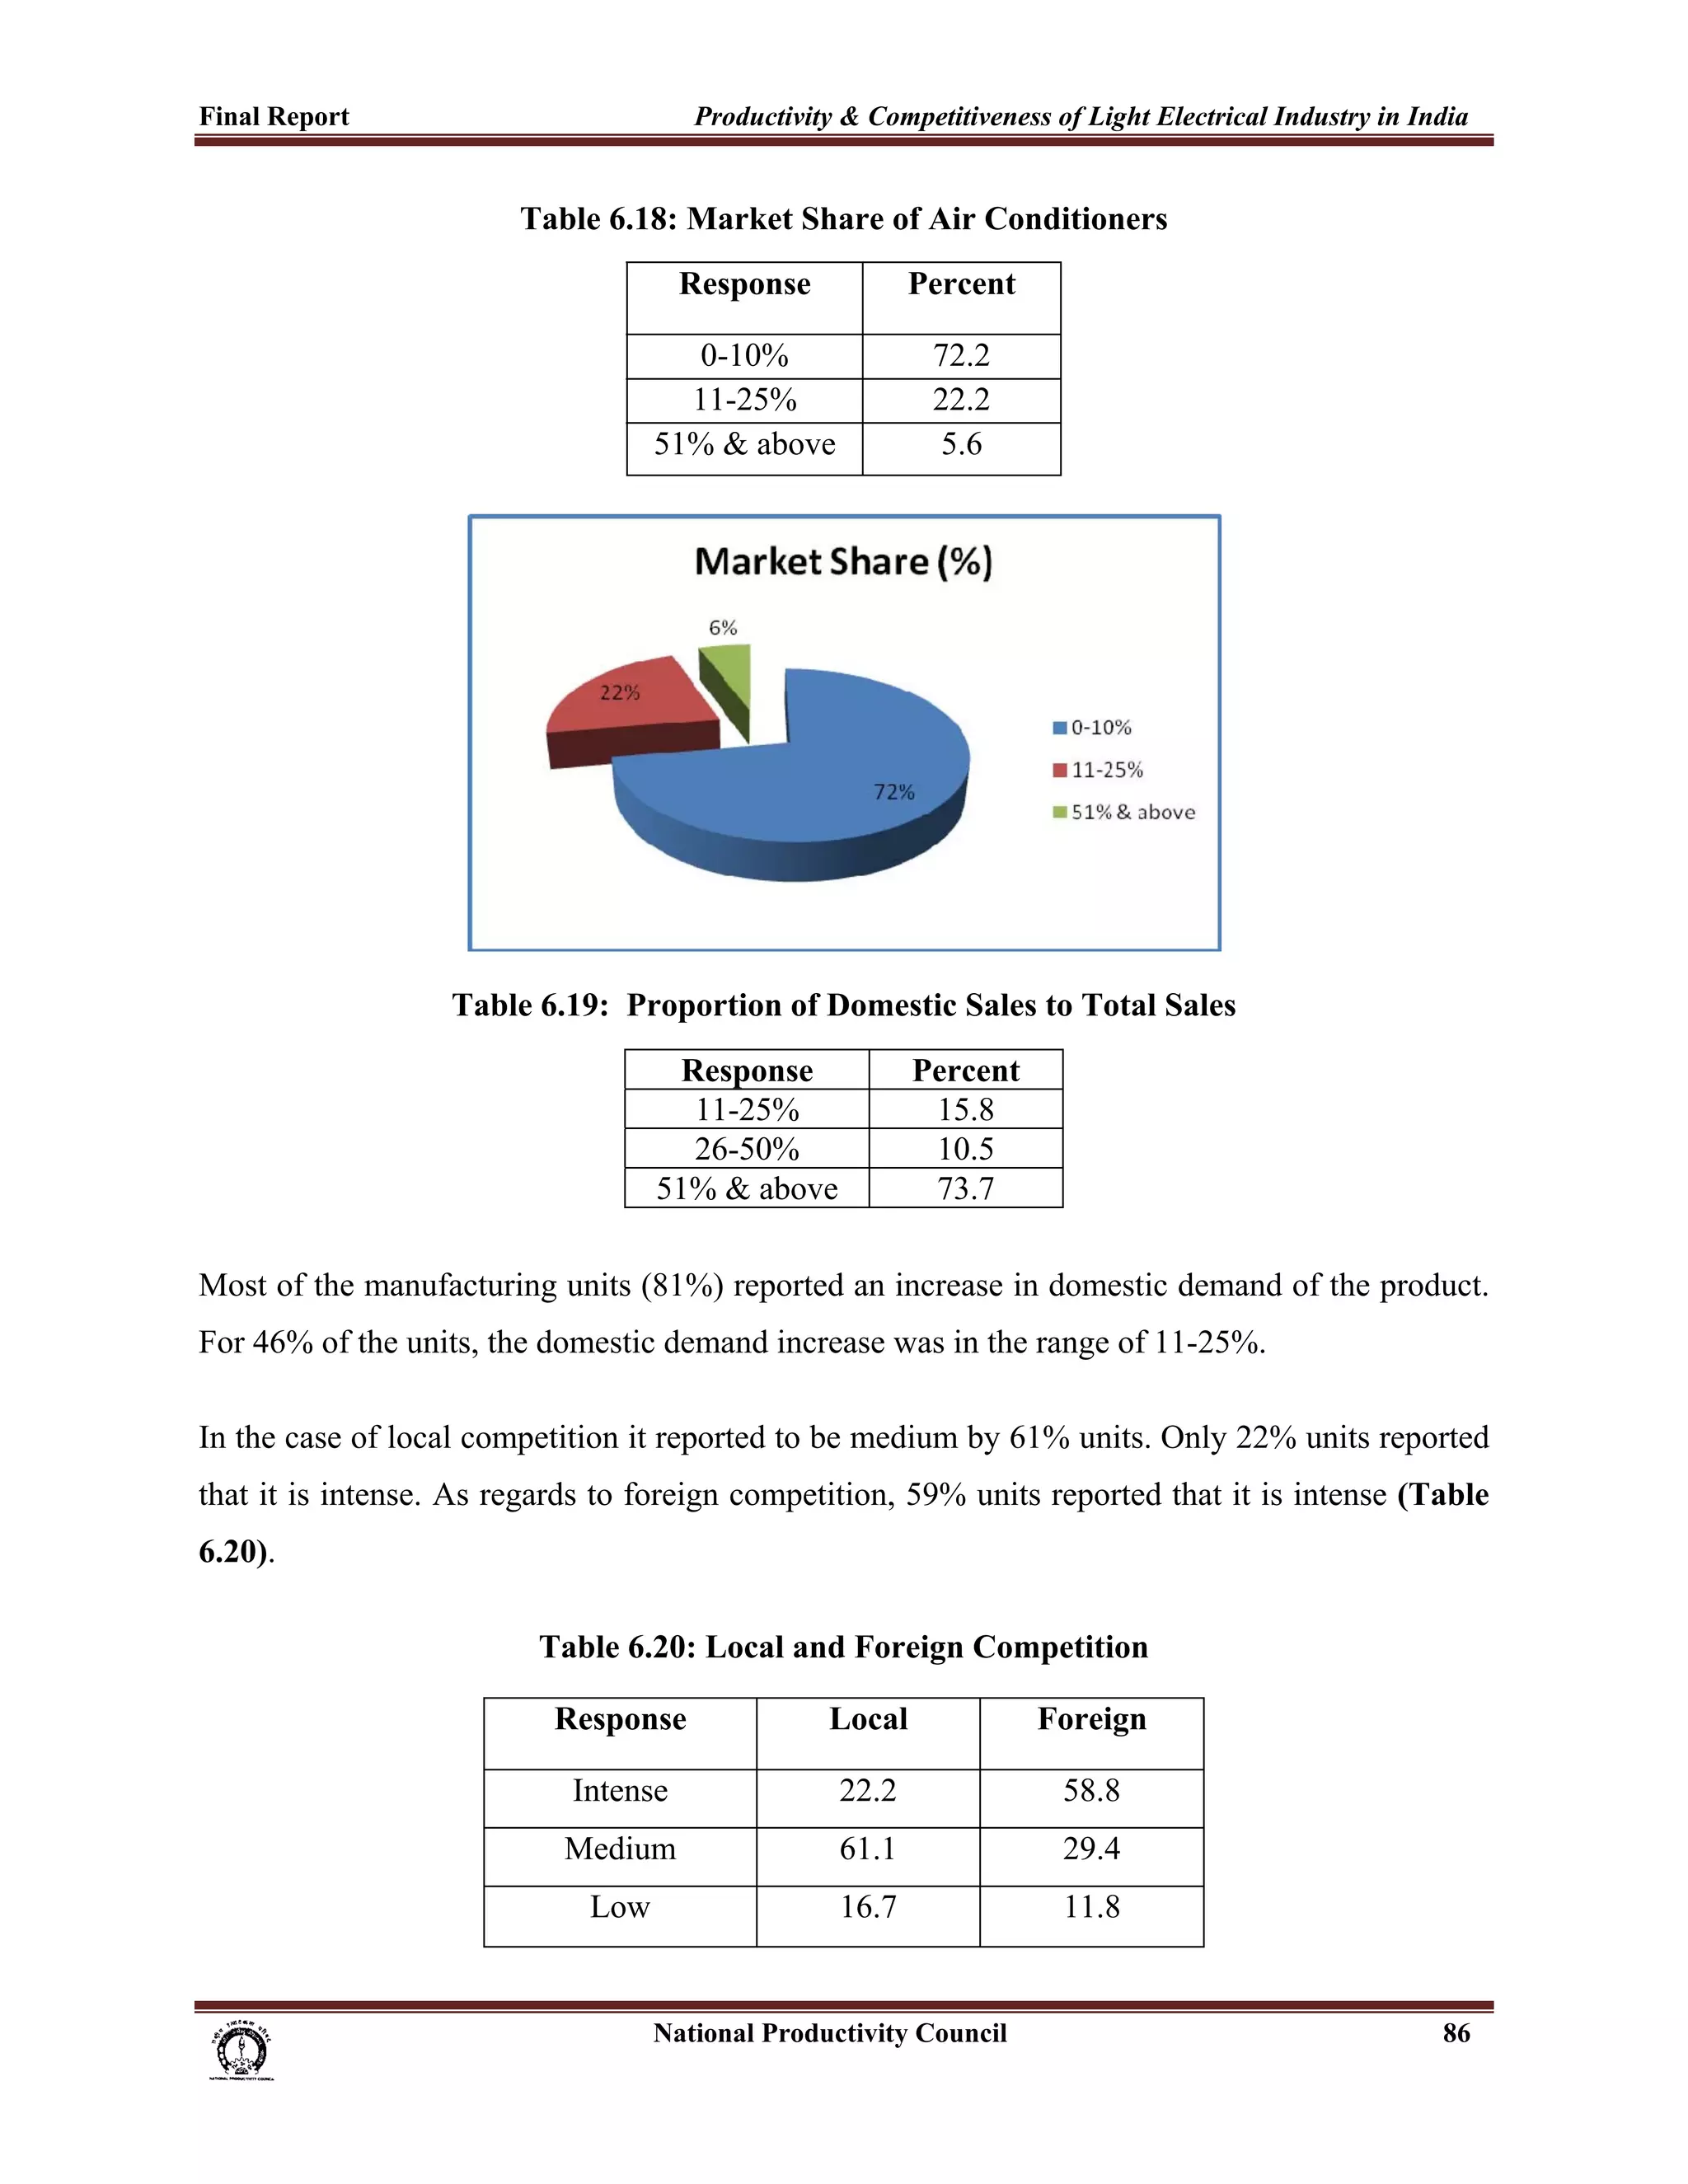
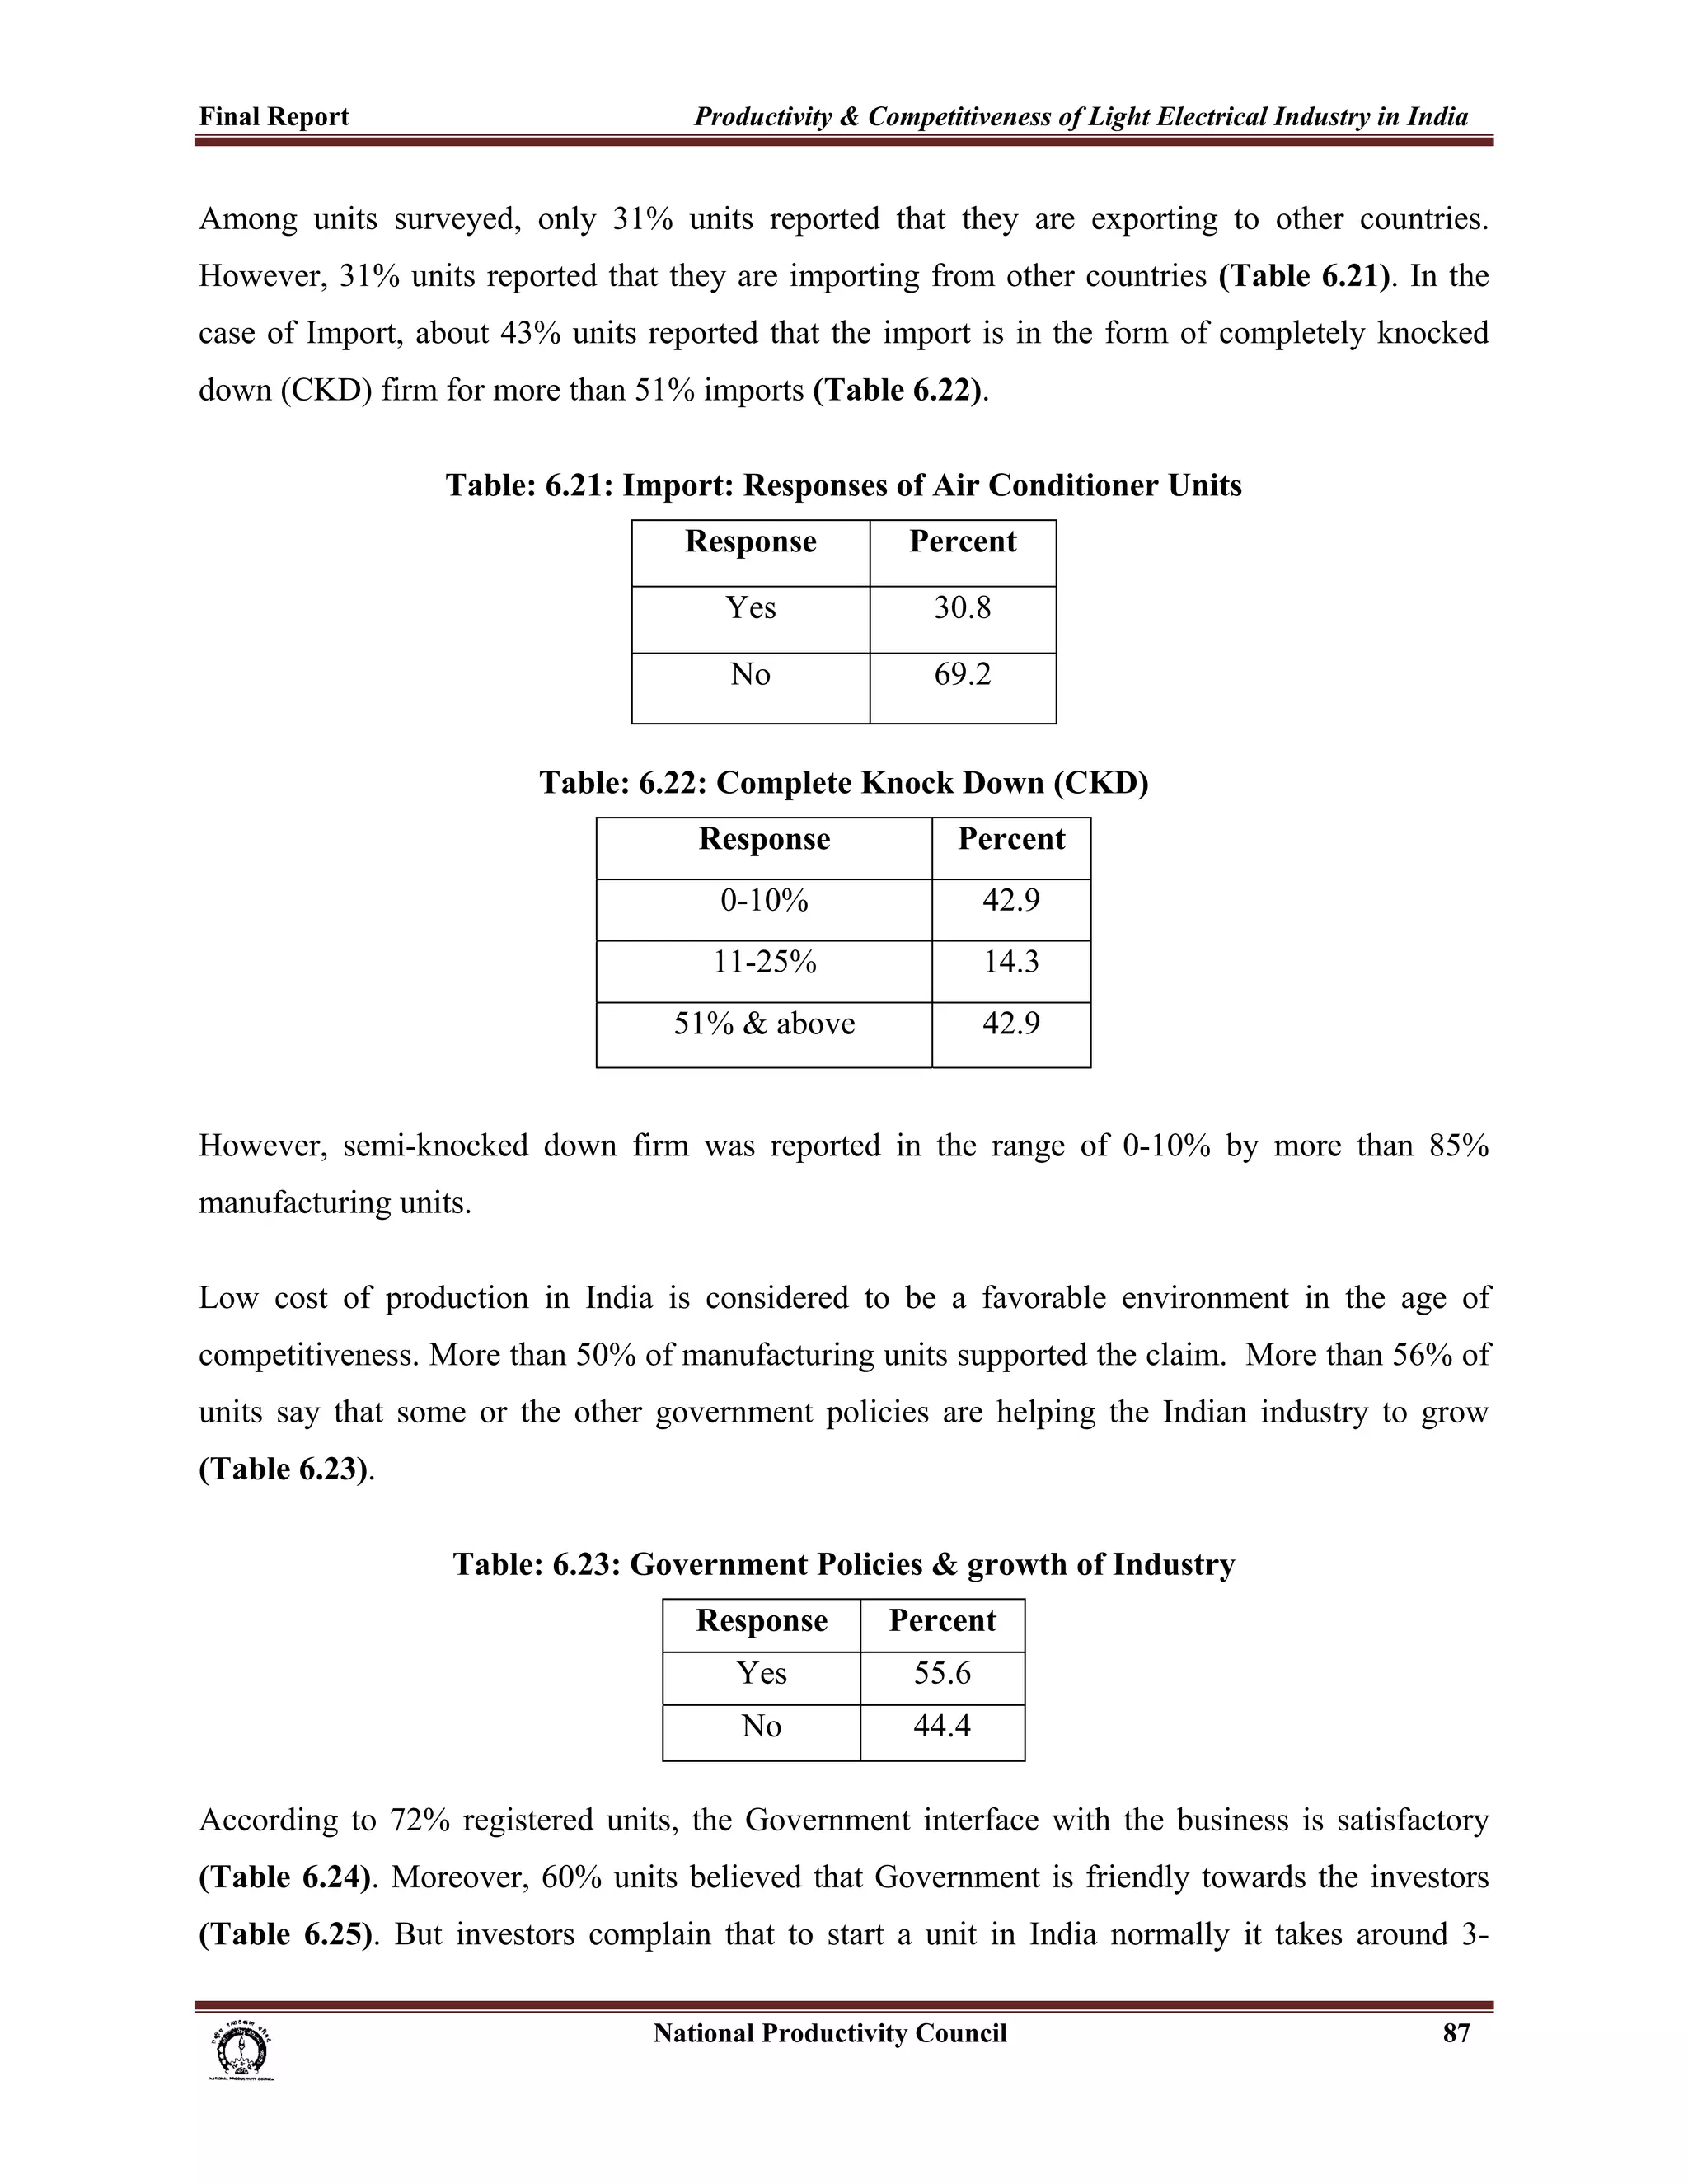
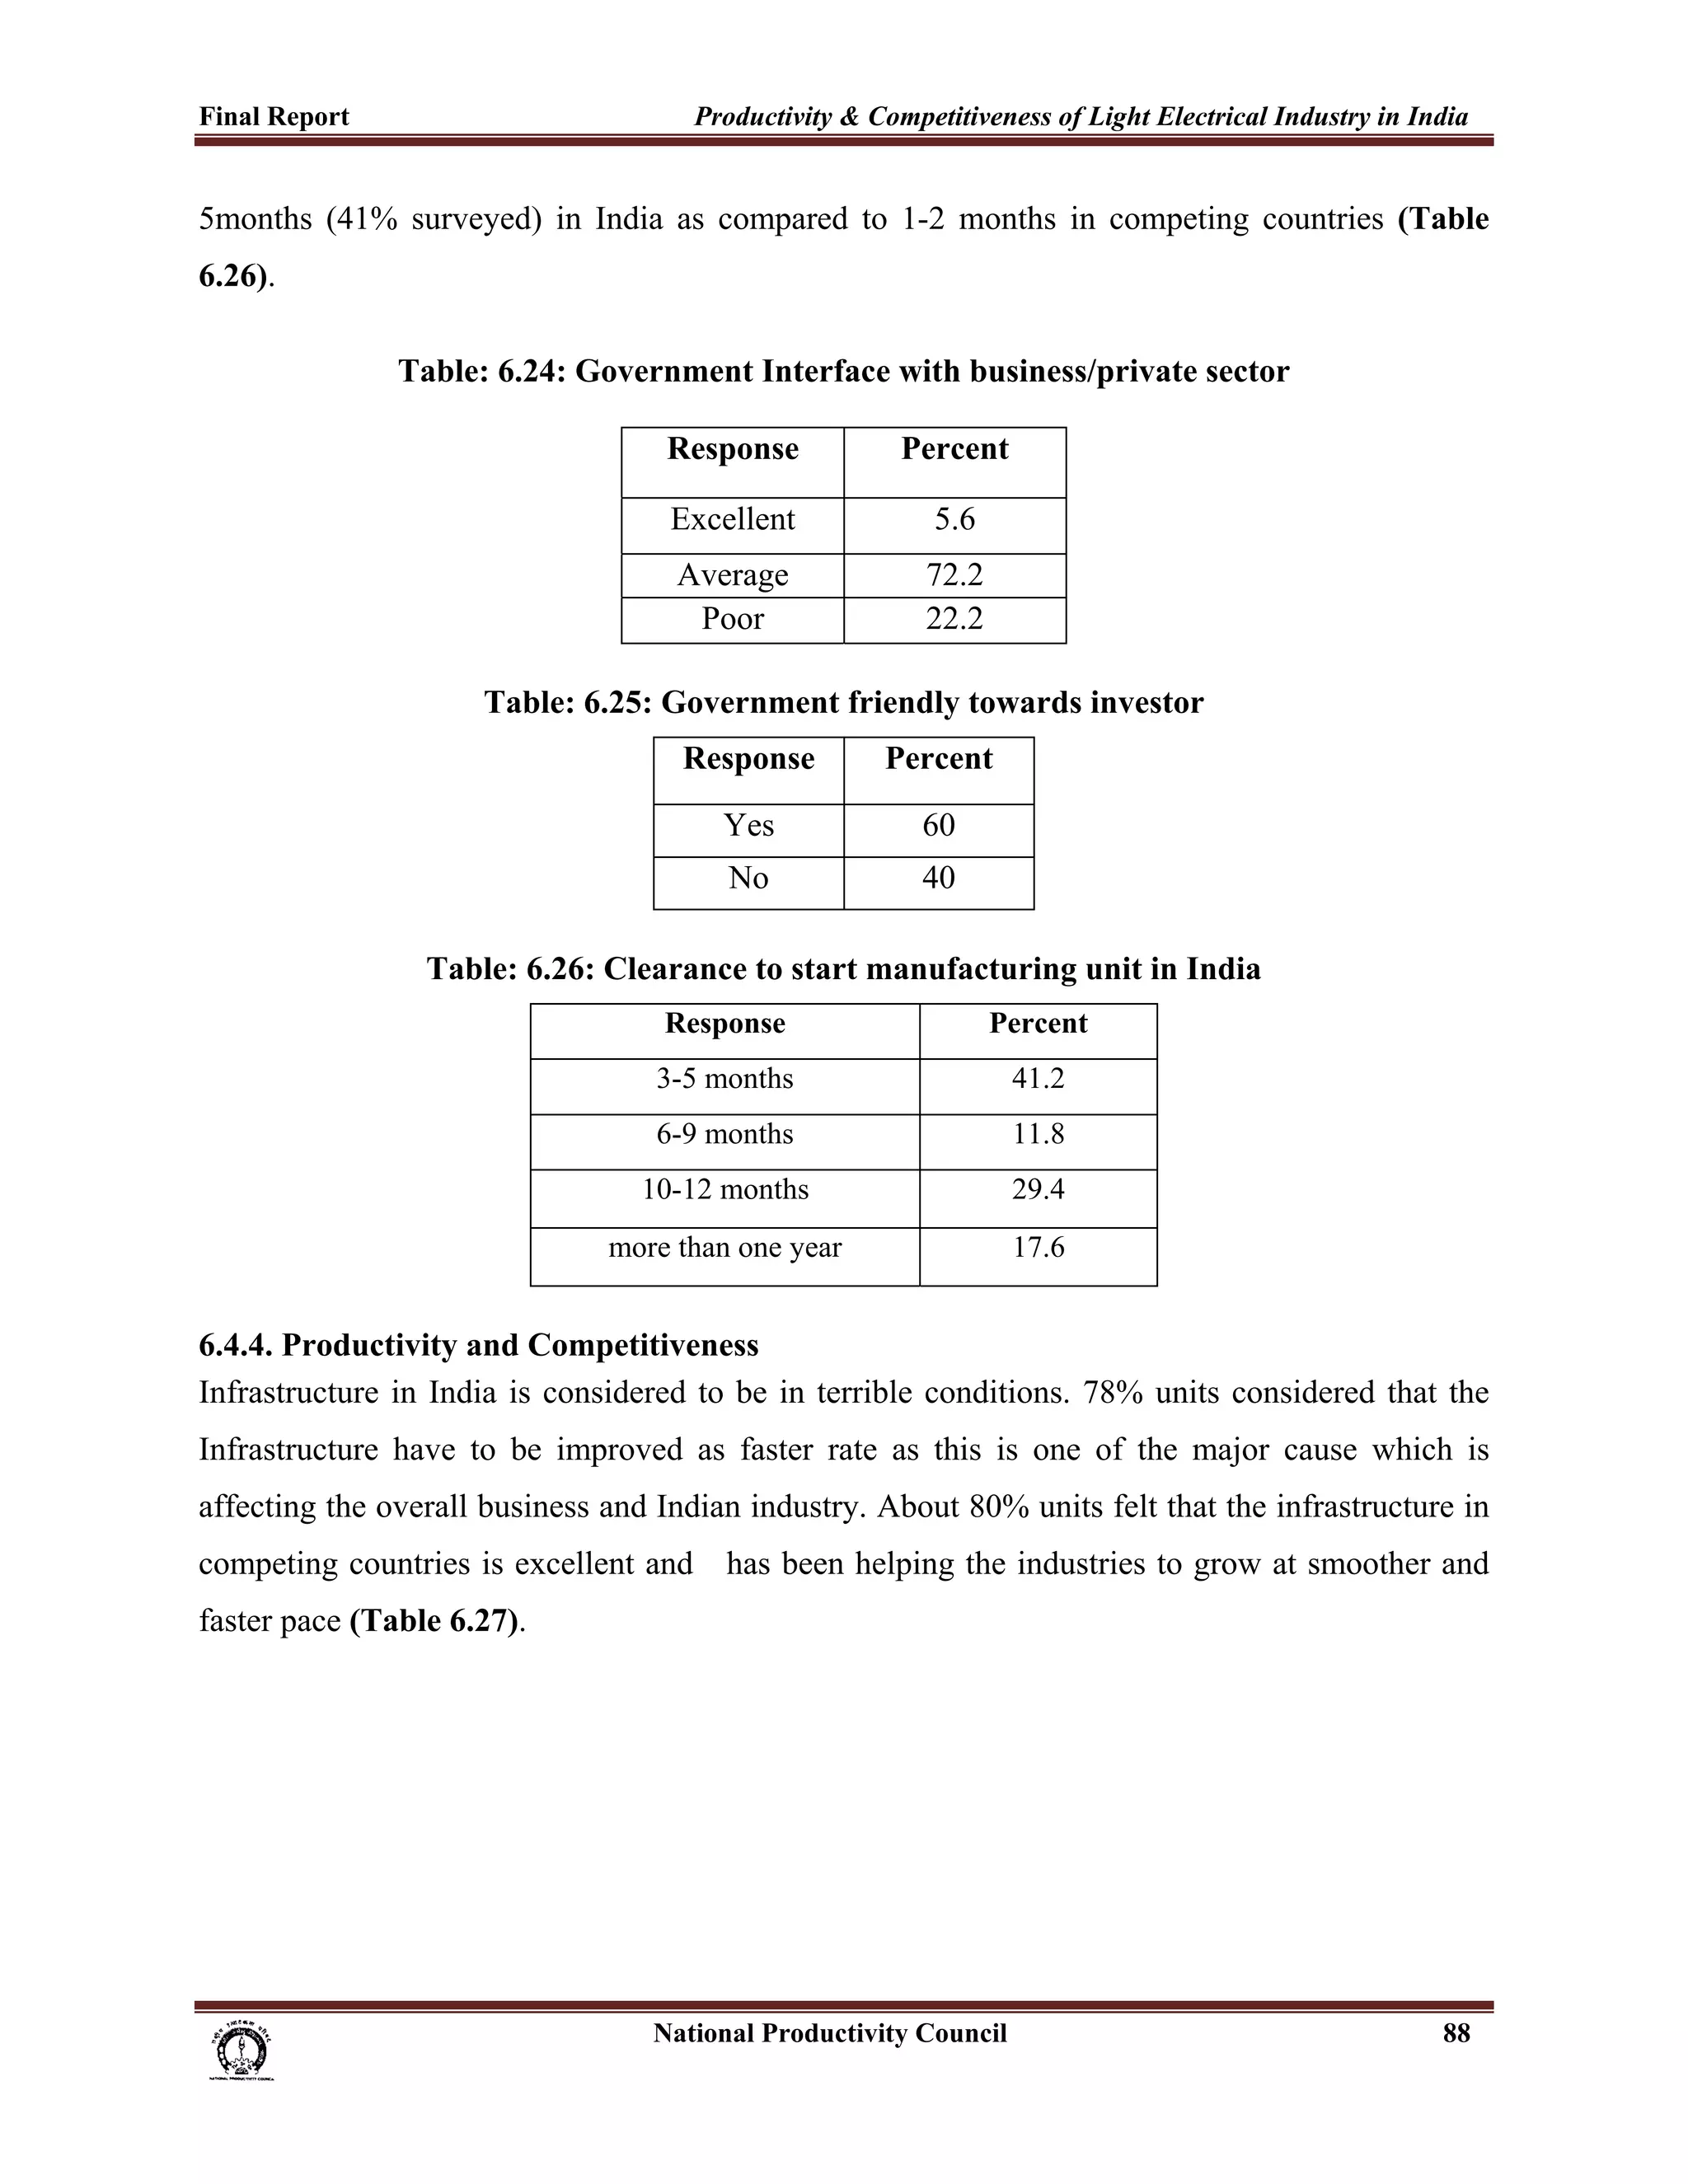
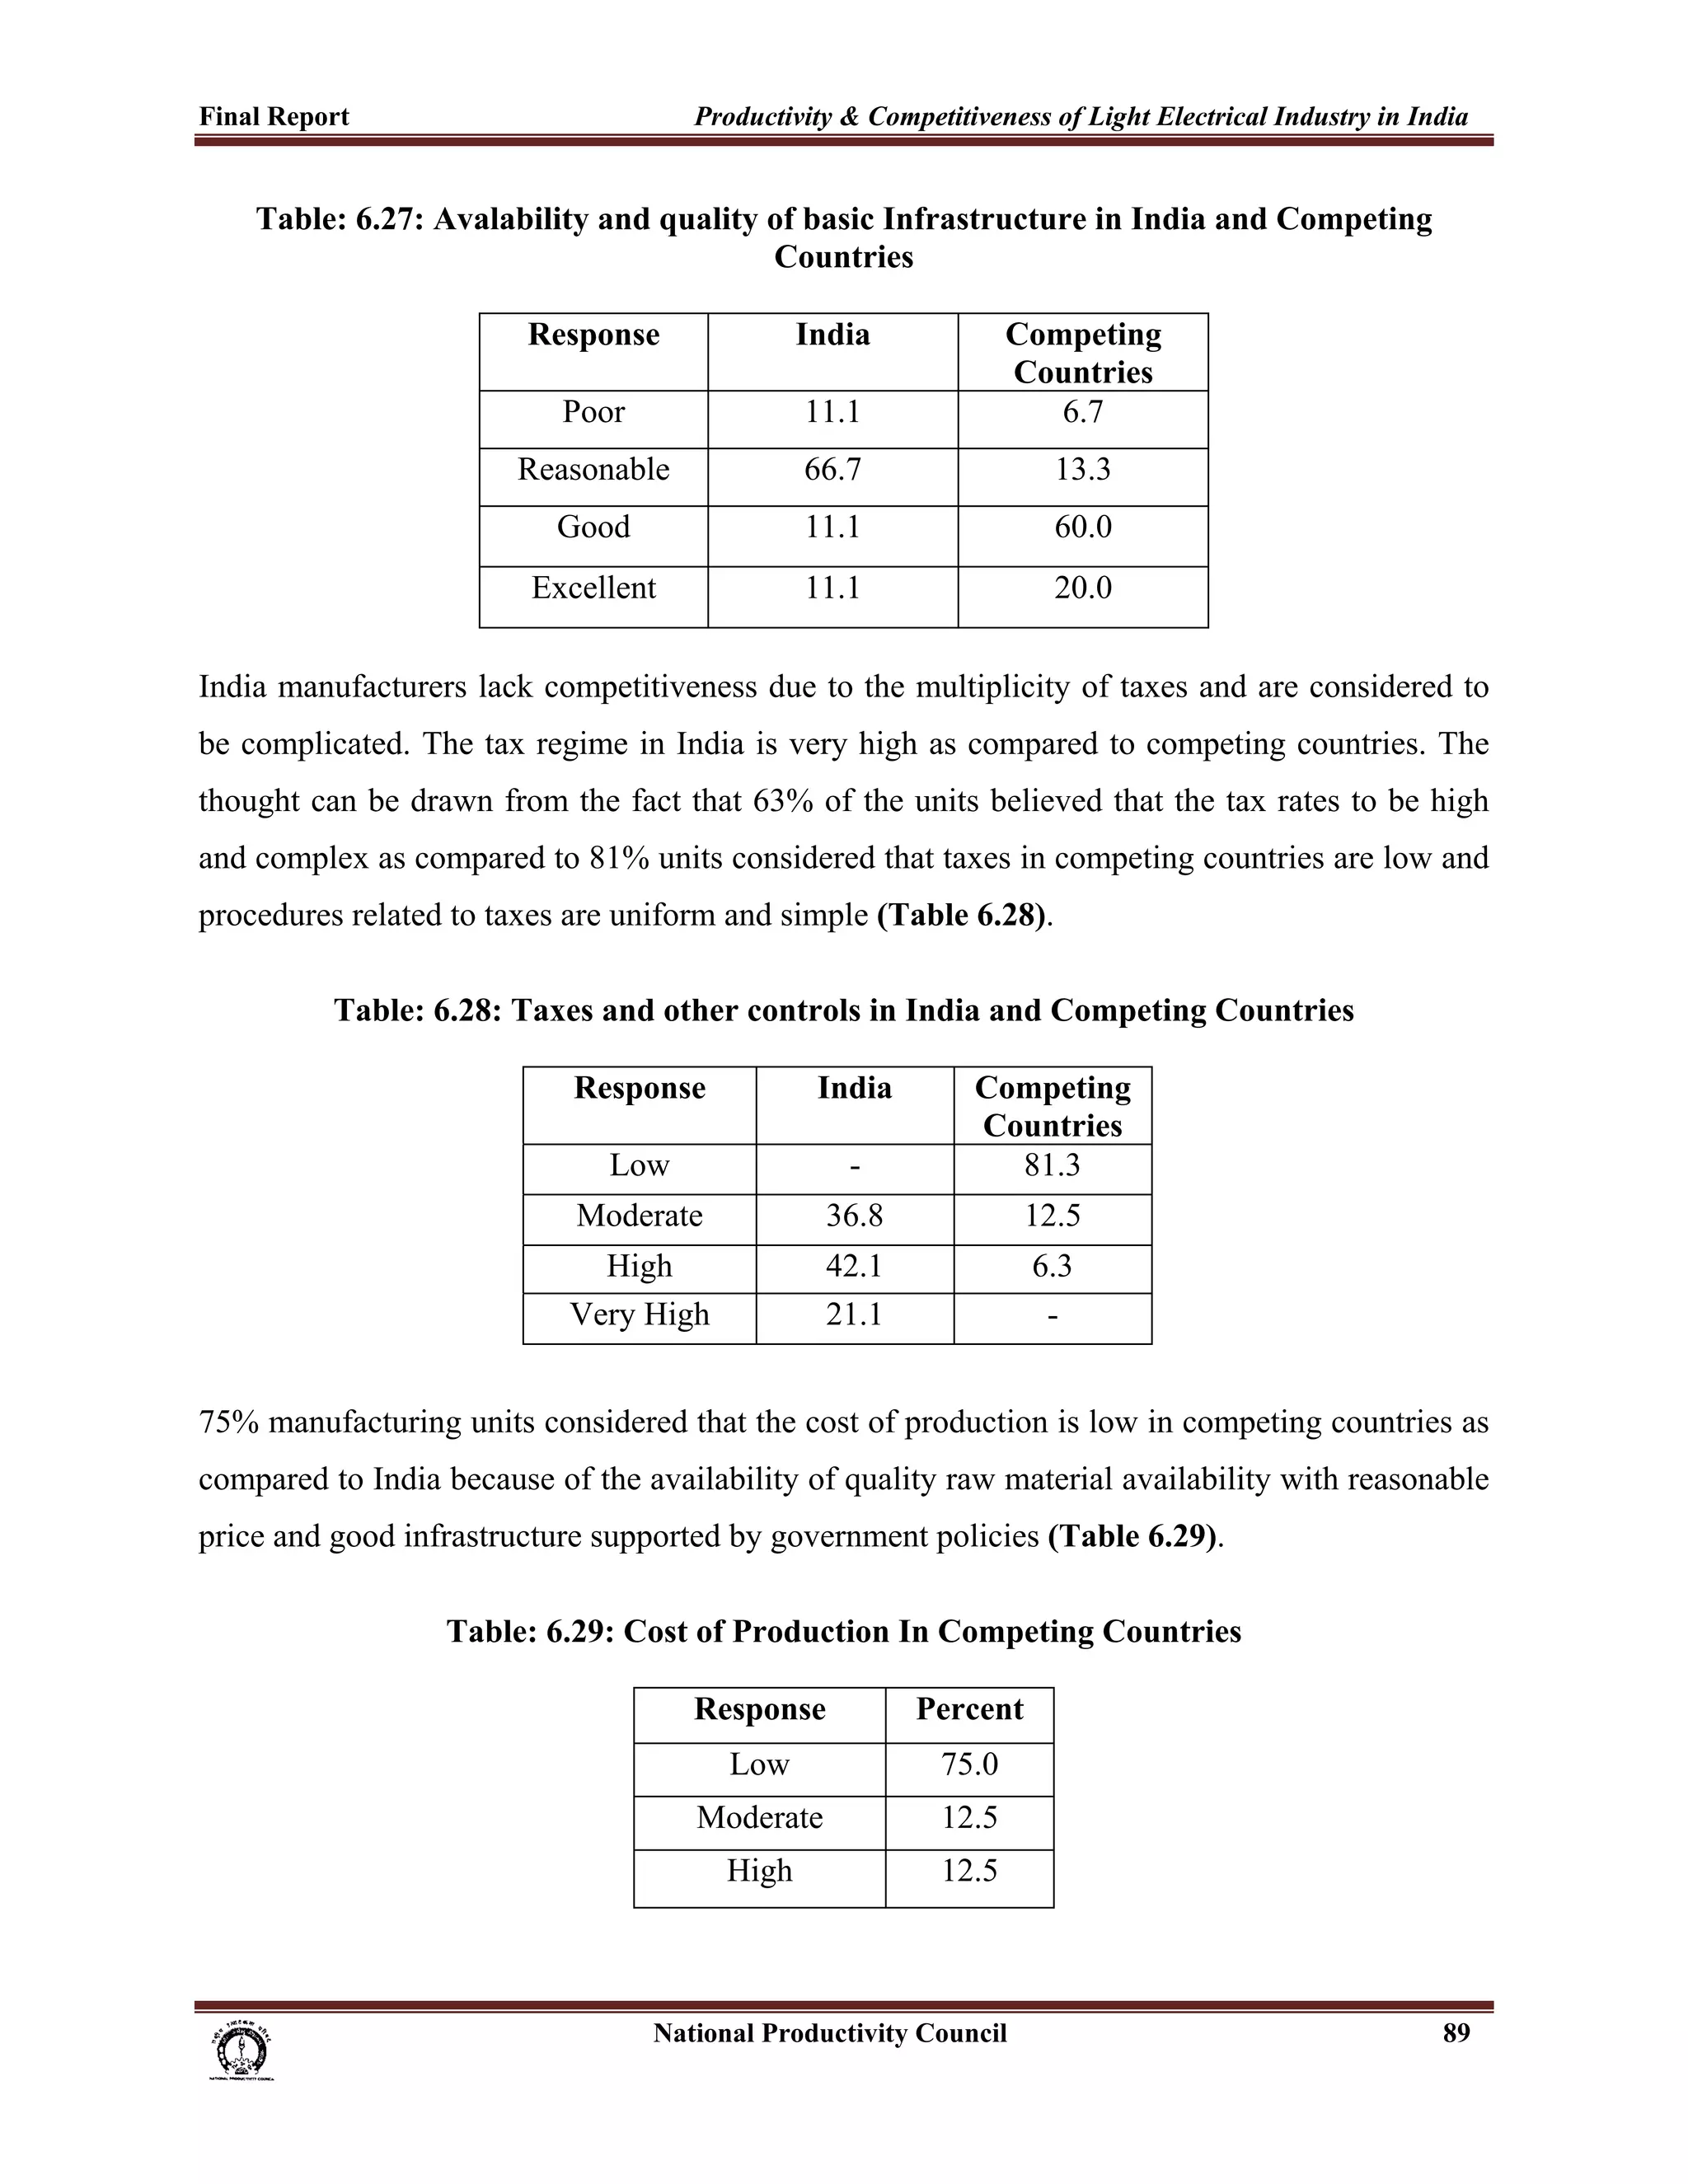
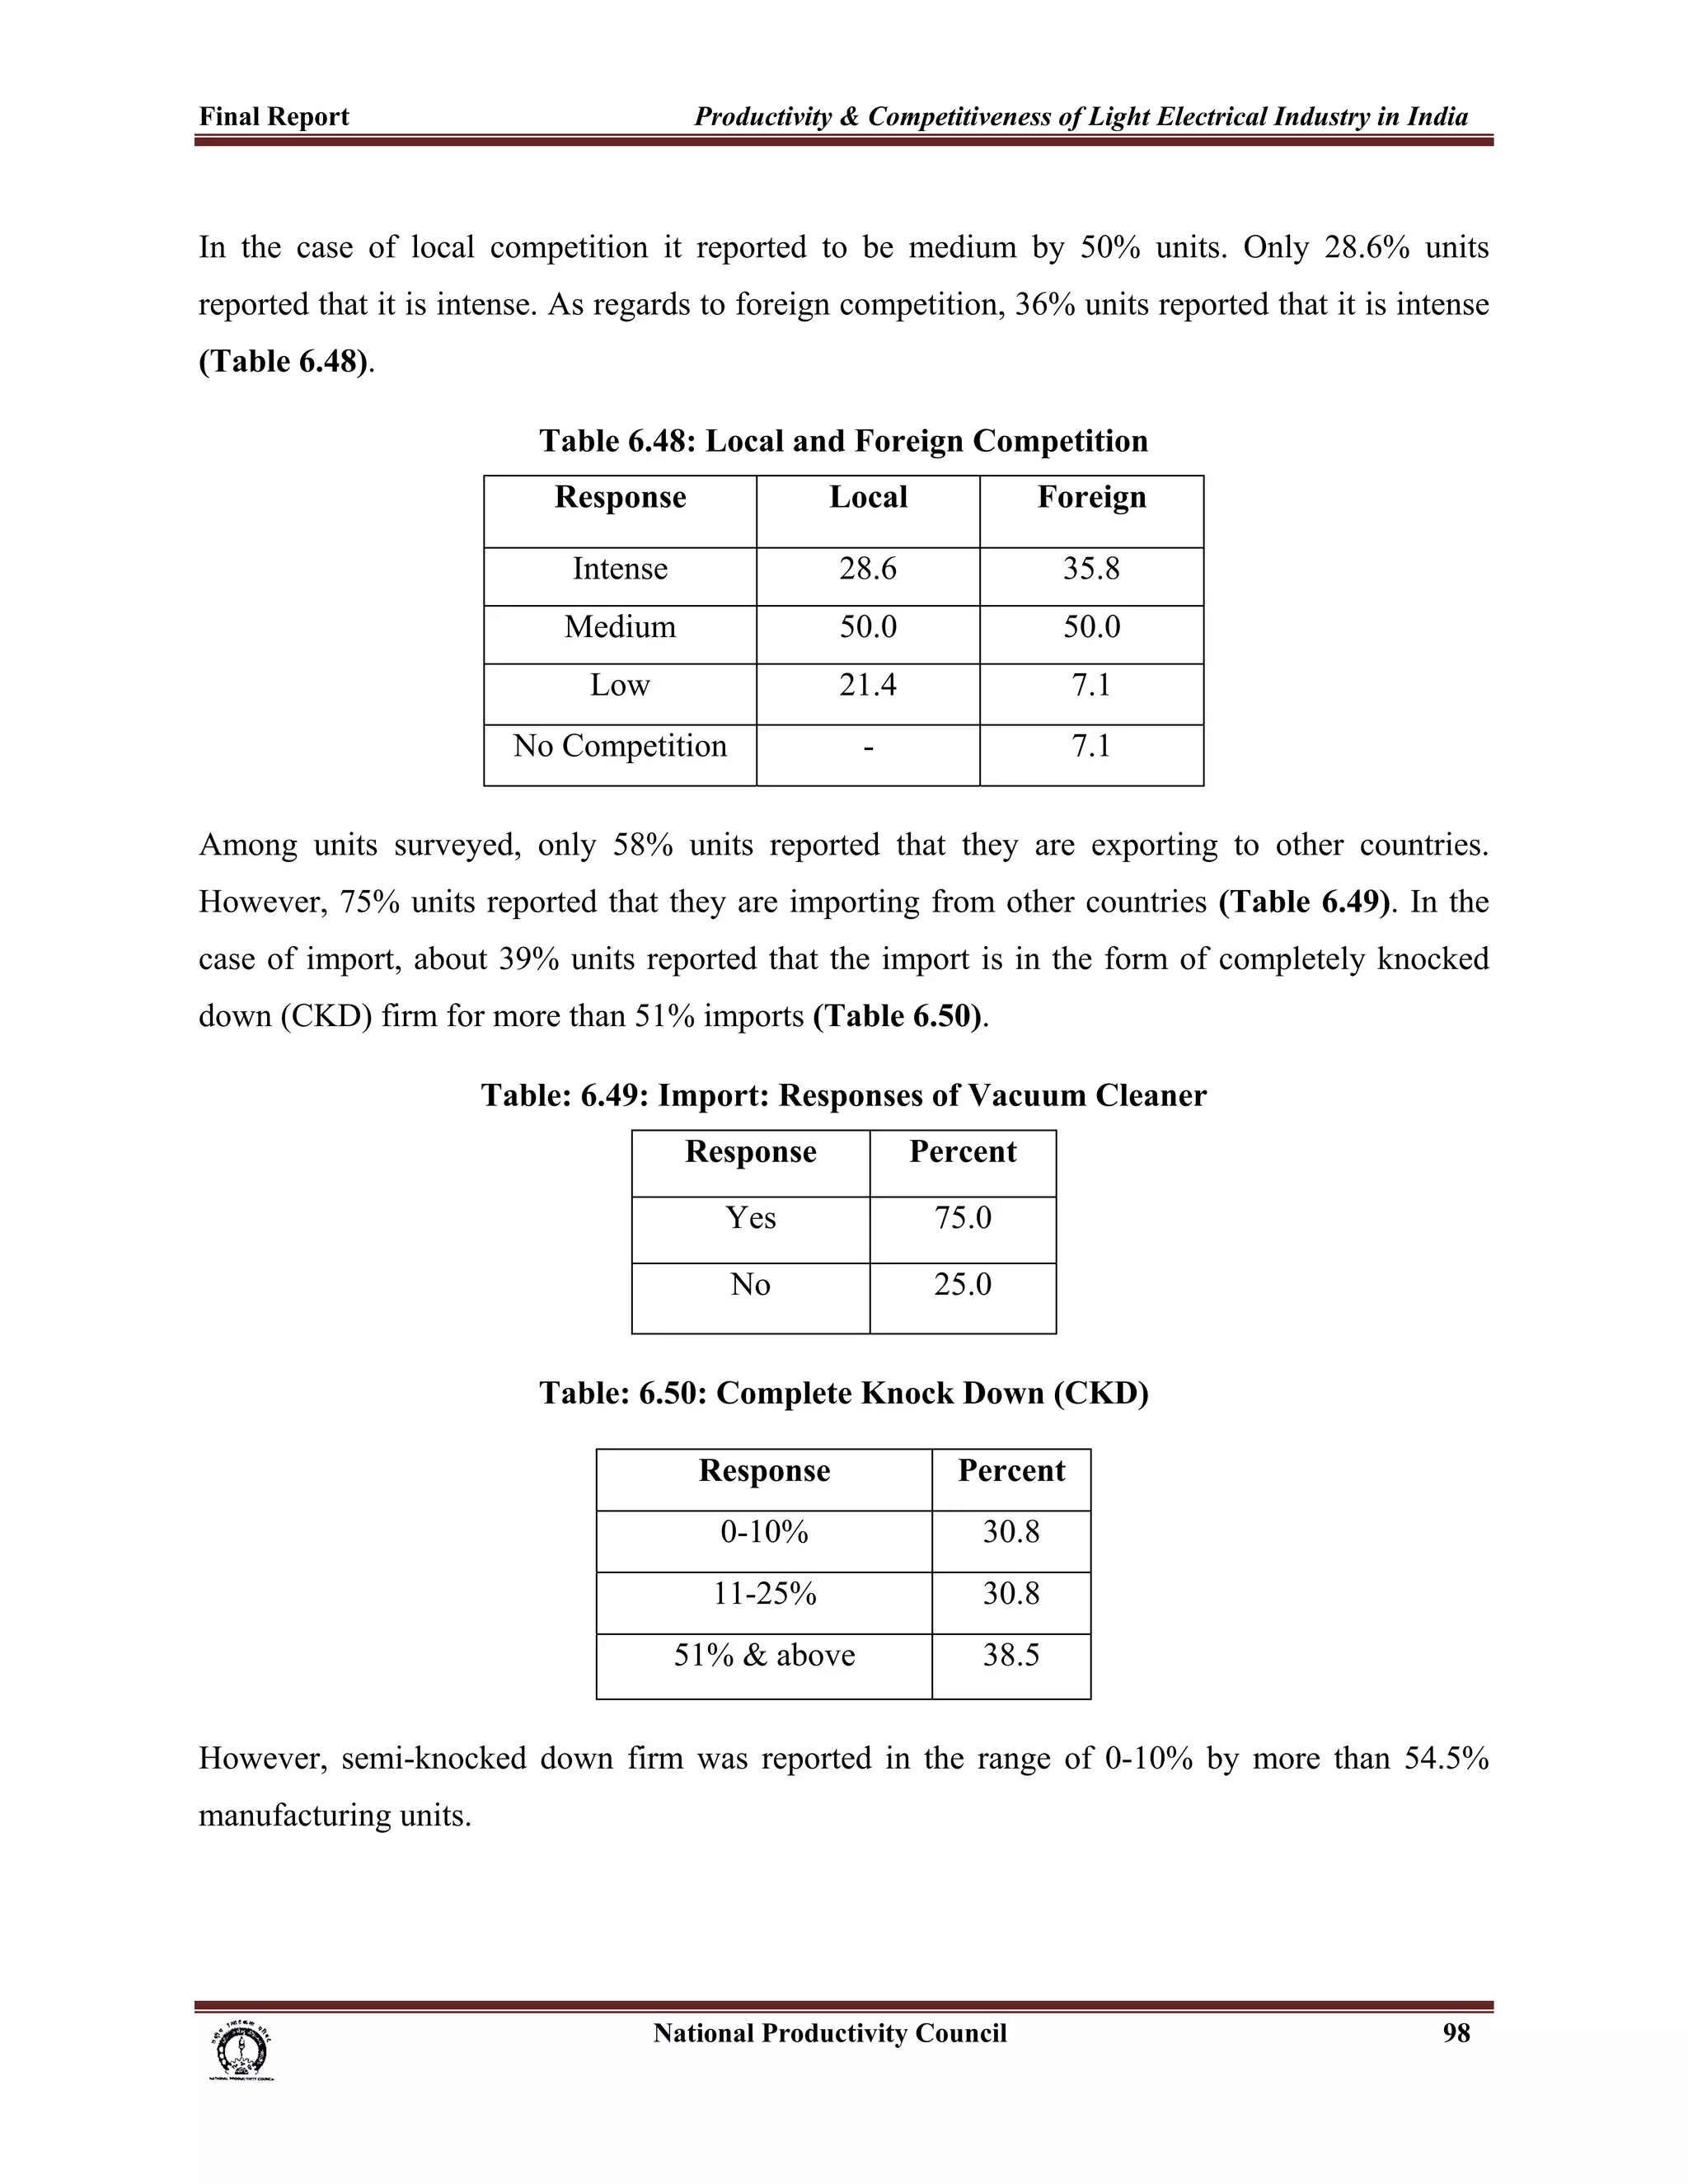
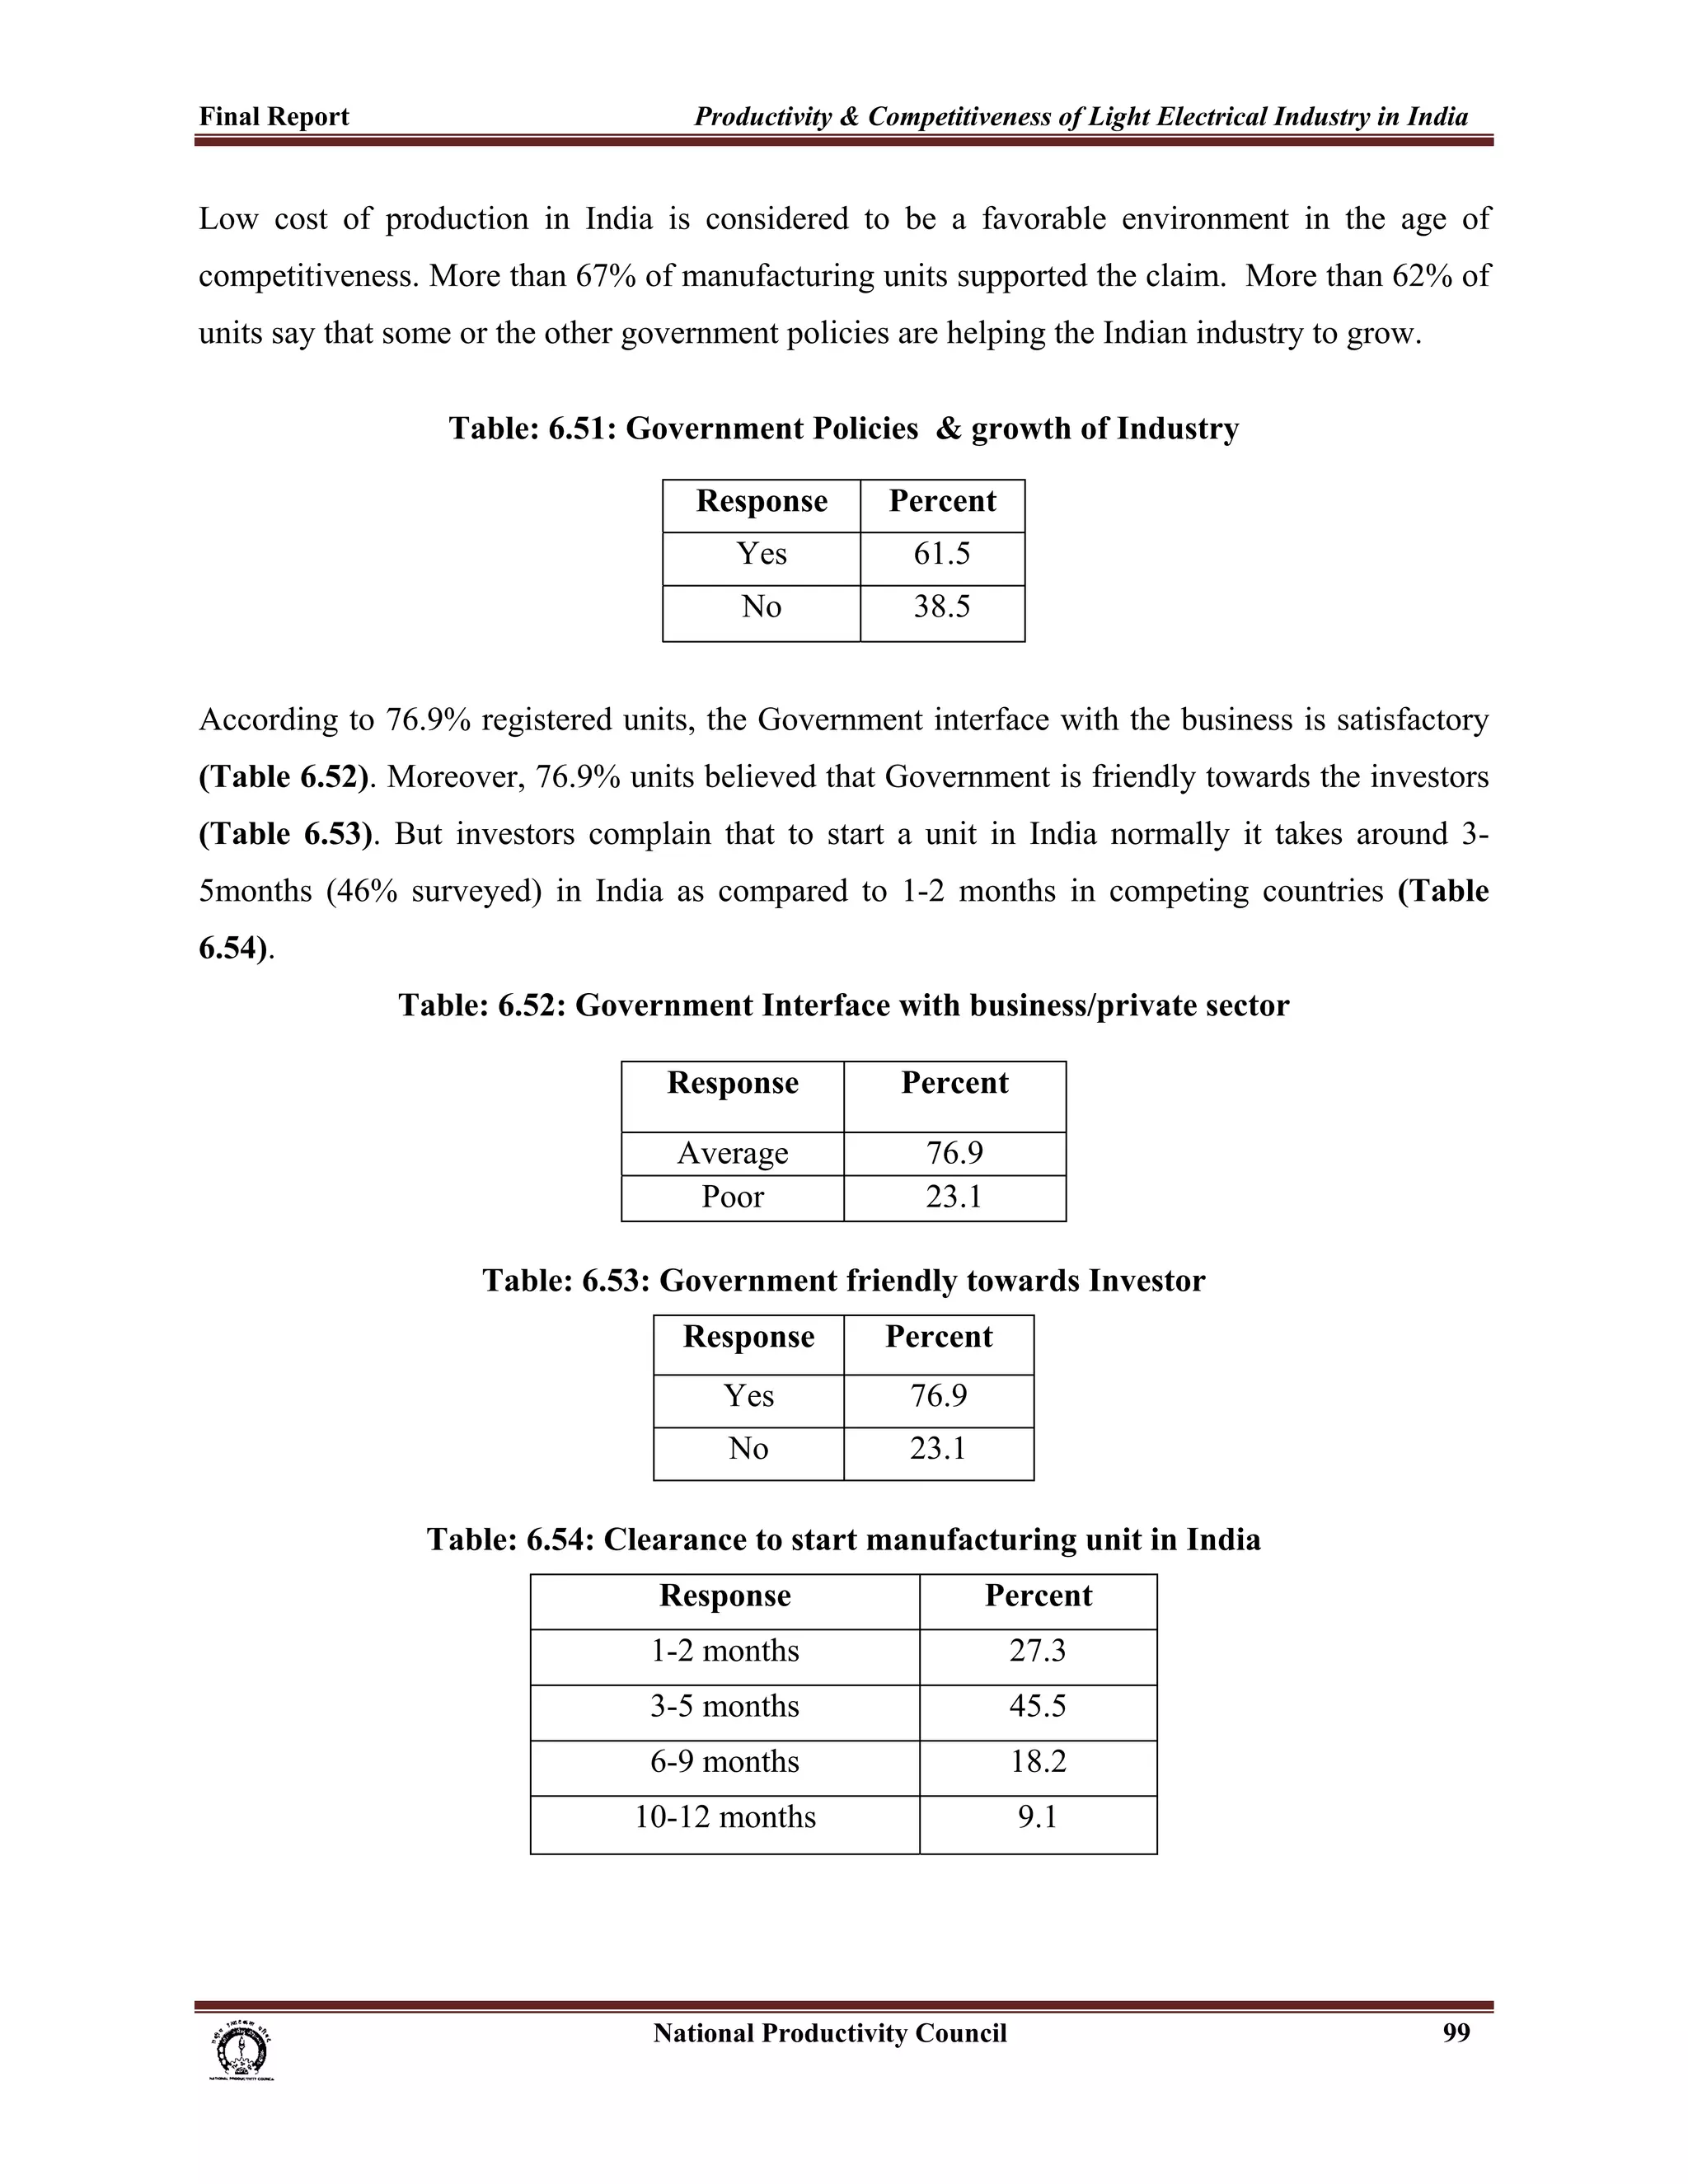
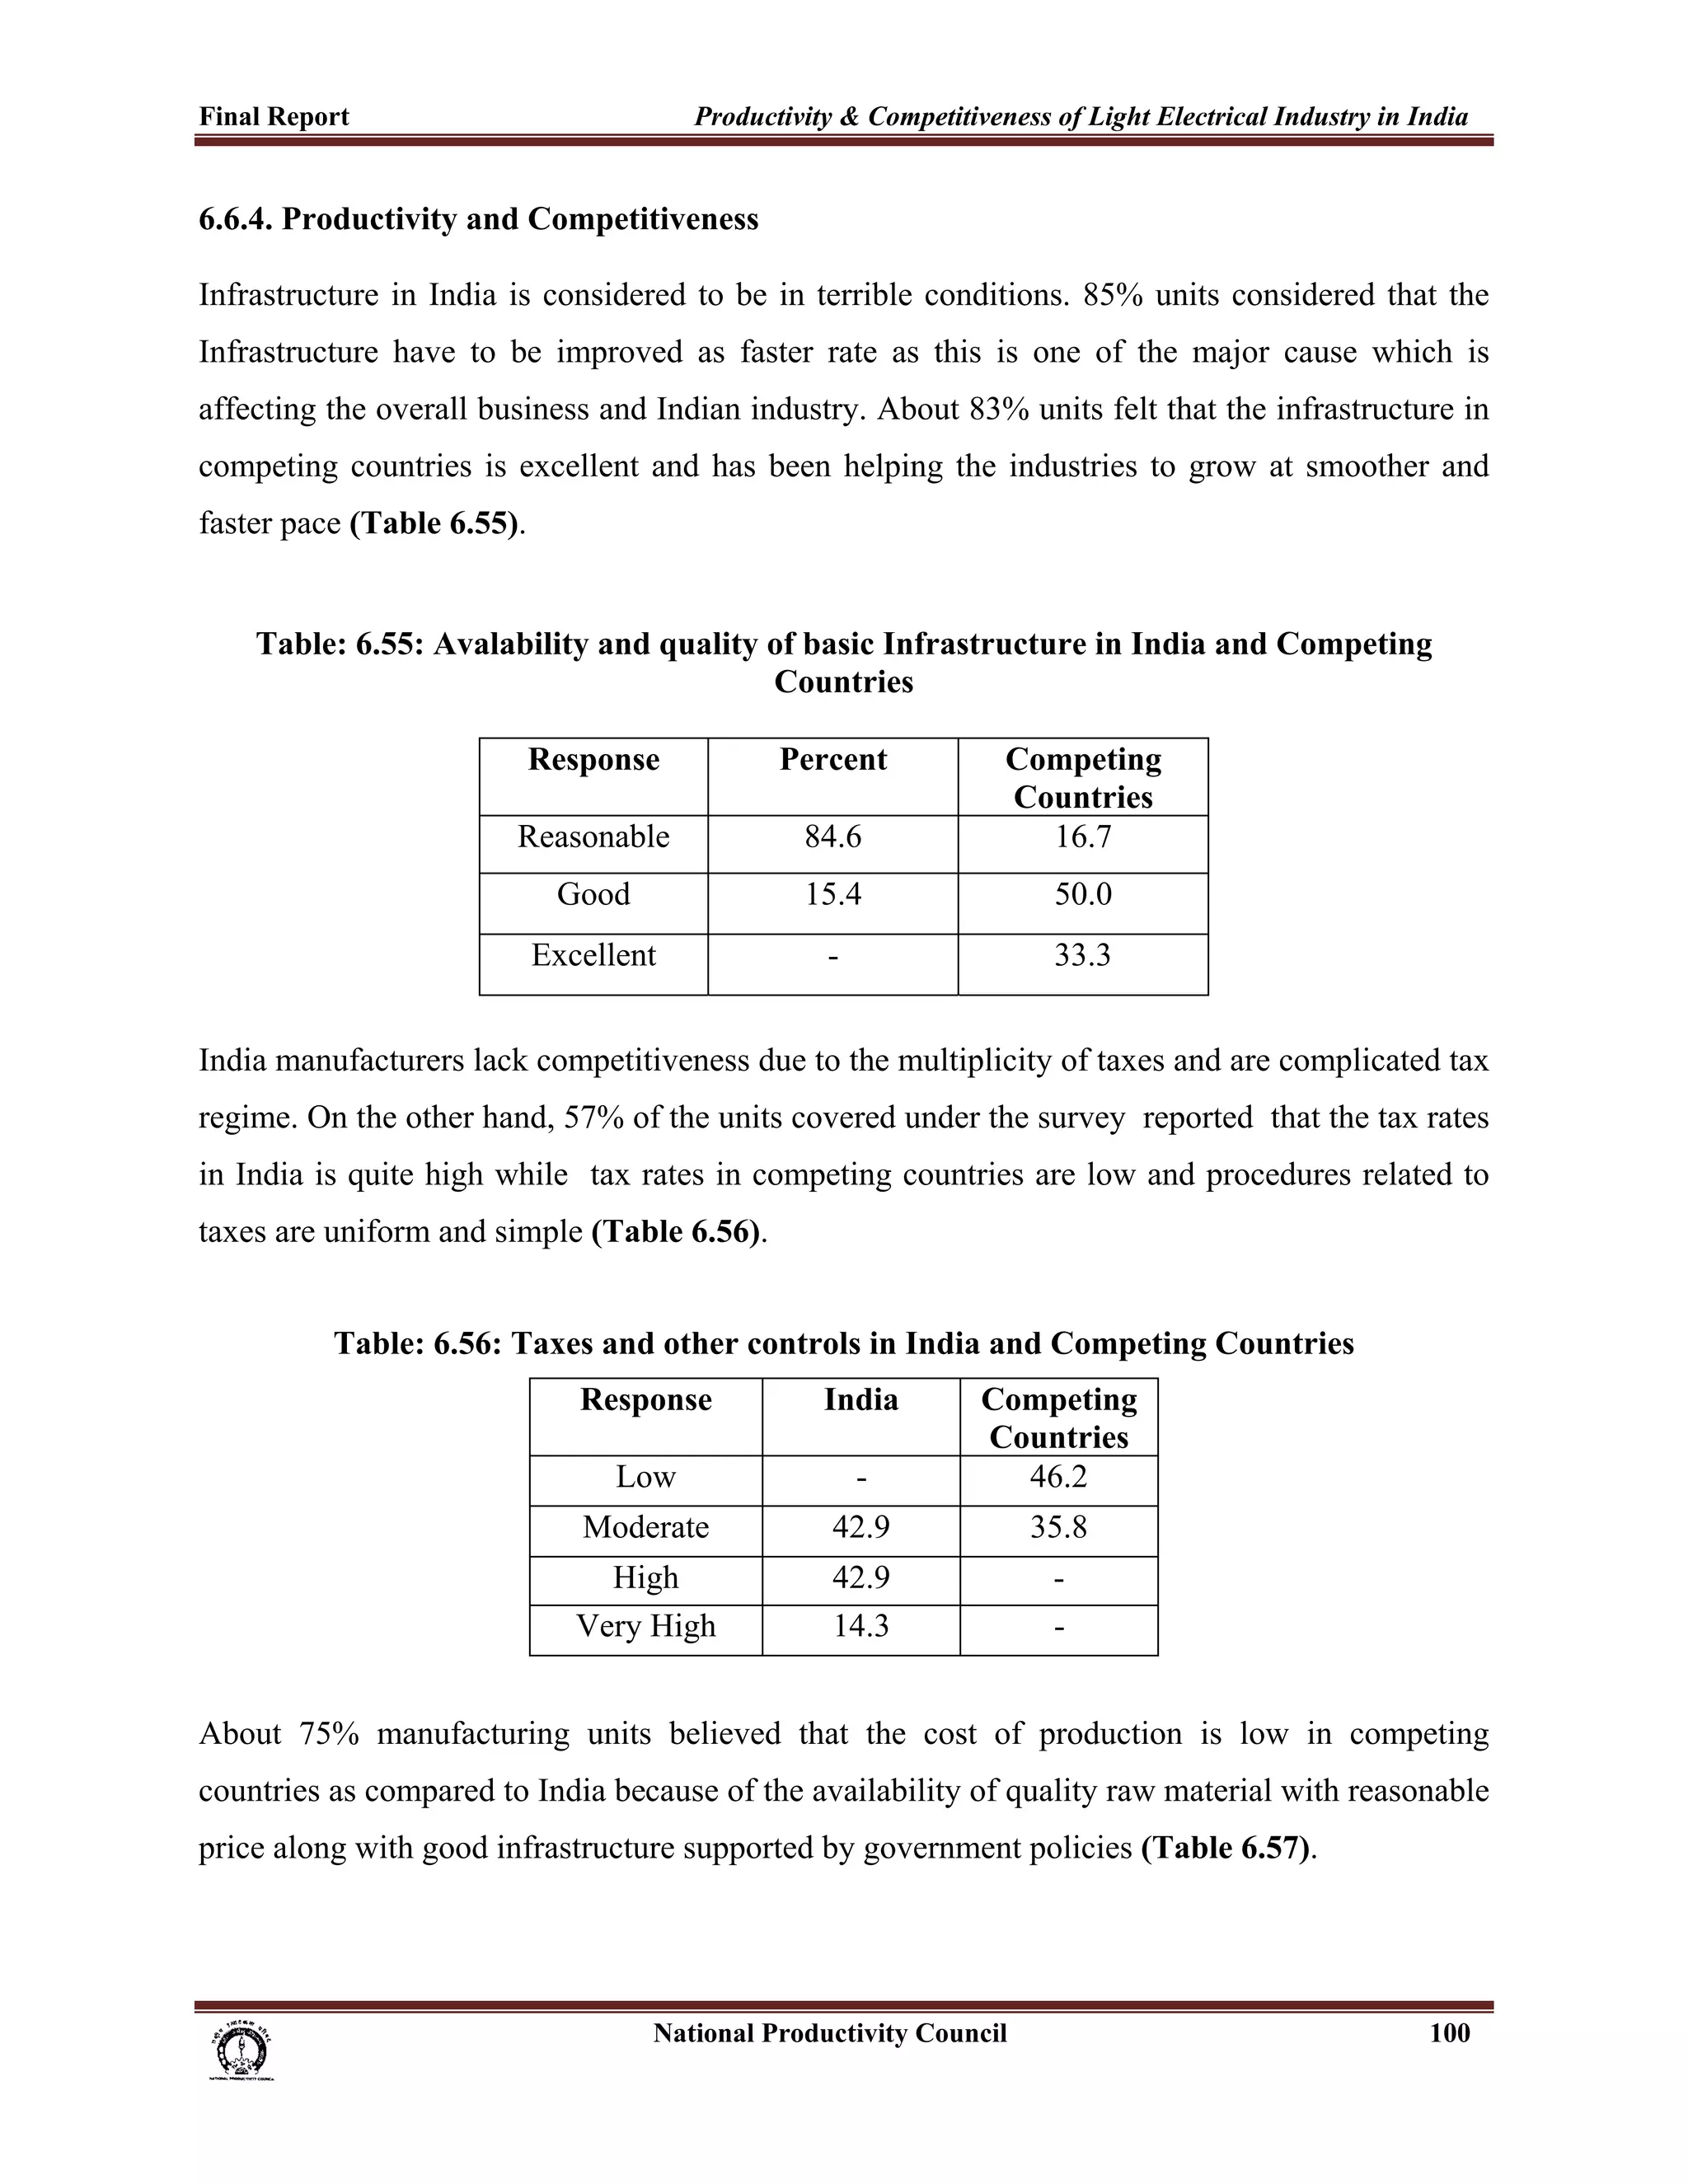
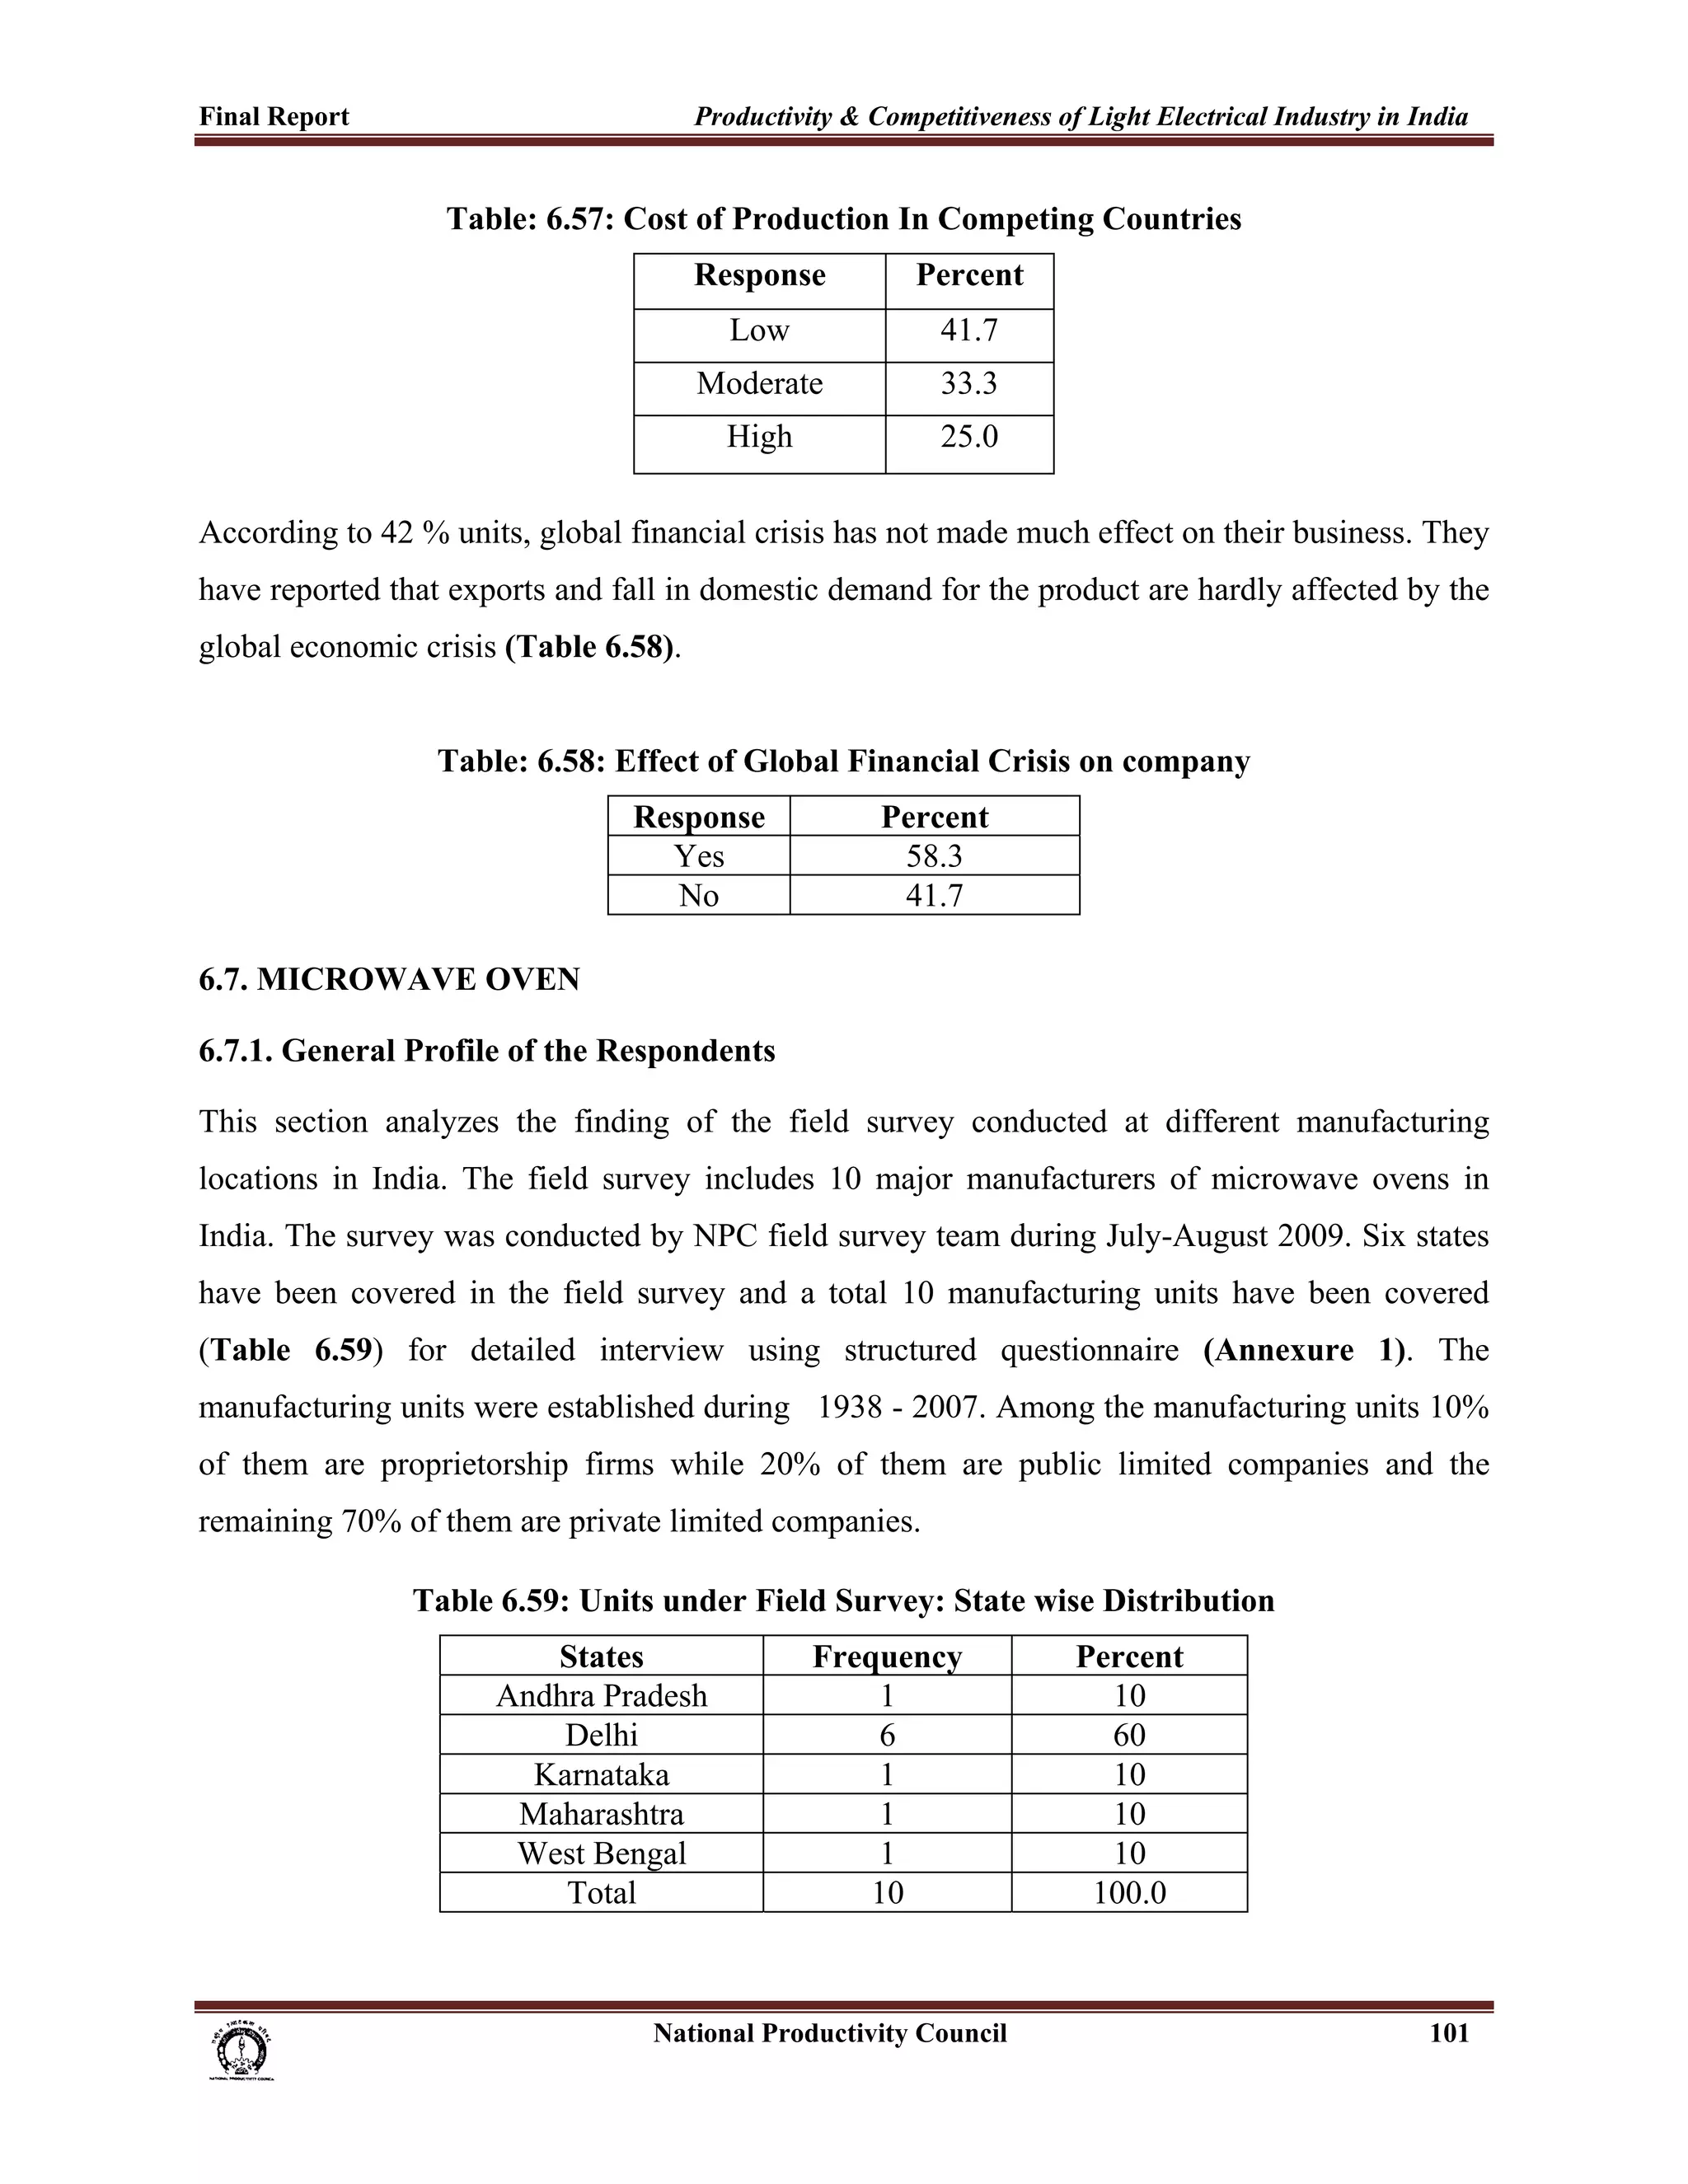
This document provides a summary of the light electrical industry in India, with a focus on large home appliances. It discusses key segments like air conditioners, refrigerators, washing machines, vacuum cleaners and microwave ovens. It analyzes industry trends, major players, productivity growth, export competitiveness, findings from a field survey of manufacturers, SWOT analyses, constraints on growth and recommendations. Government policies to promote the industry are also examined.


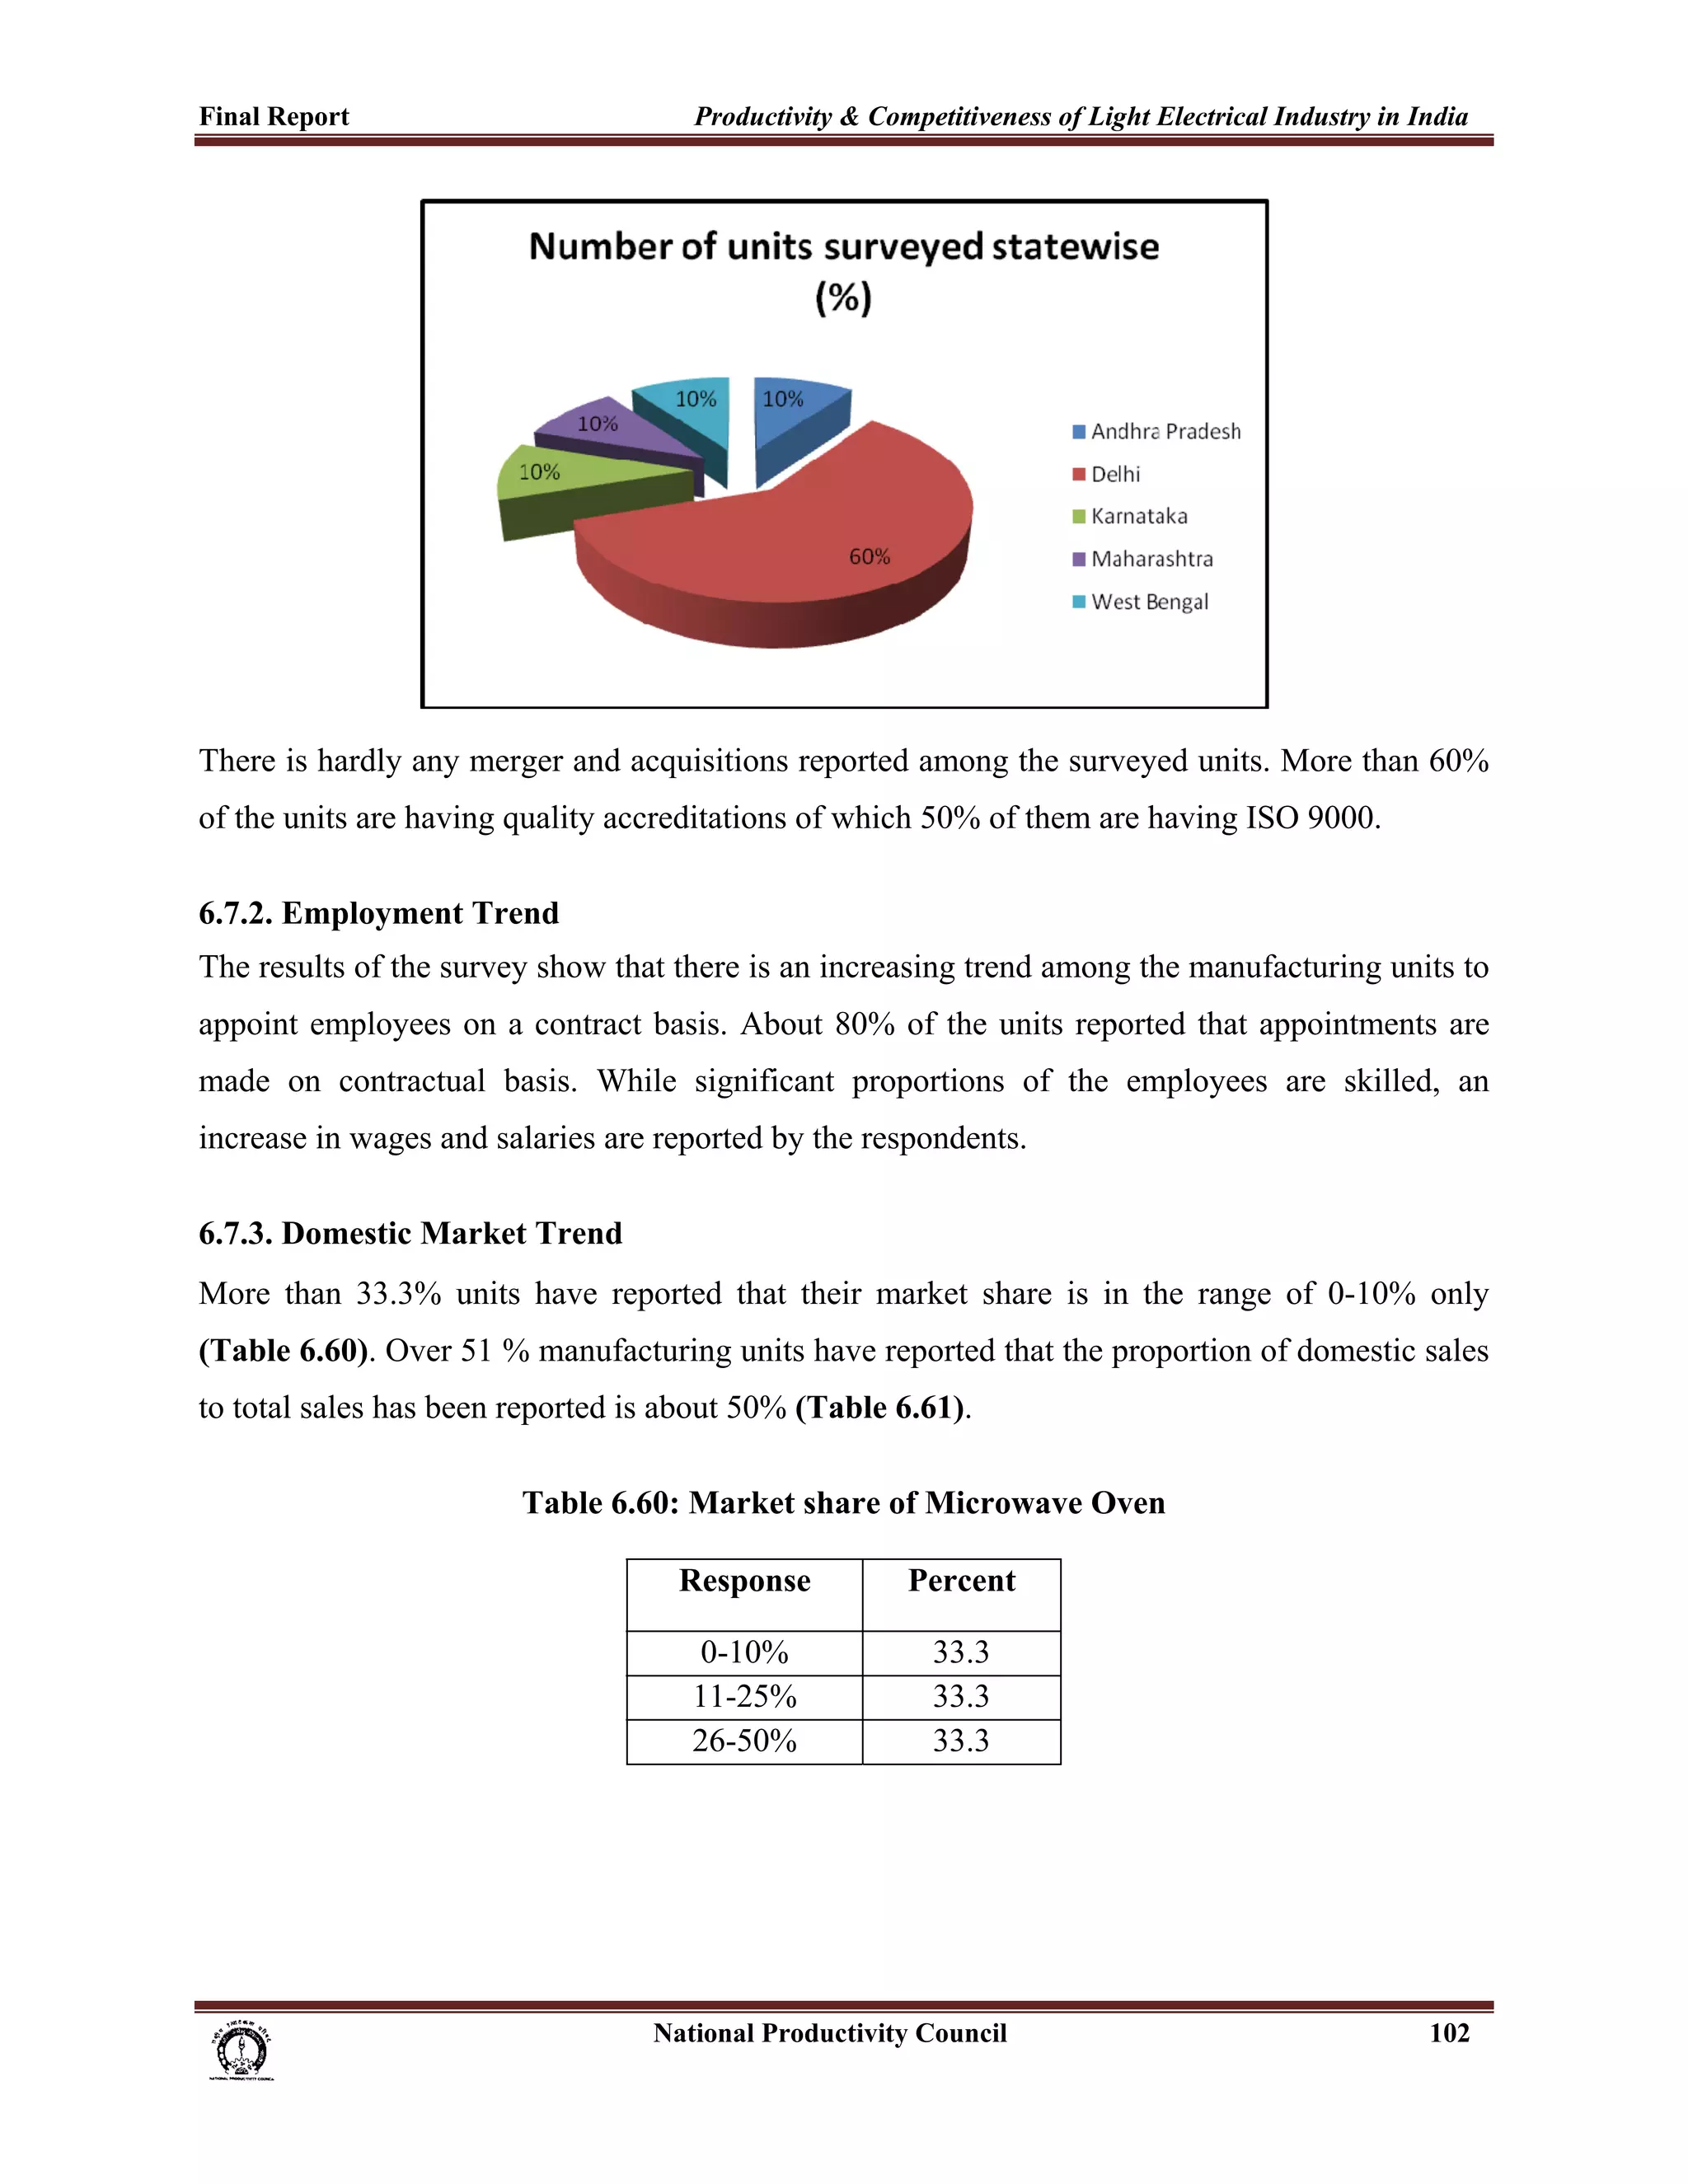
![Final Report Productivity & Competitiveness of Light Electrical Industry in India
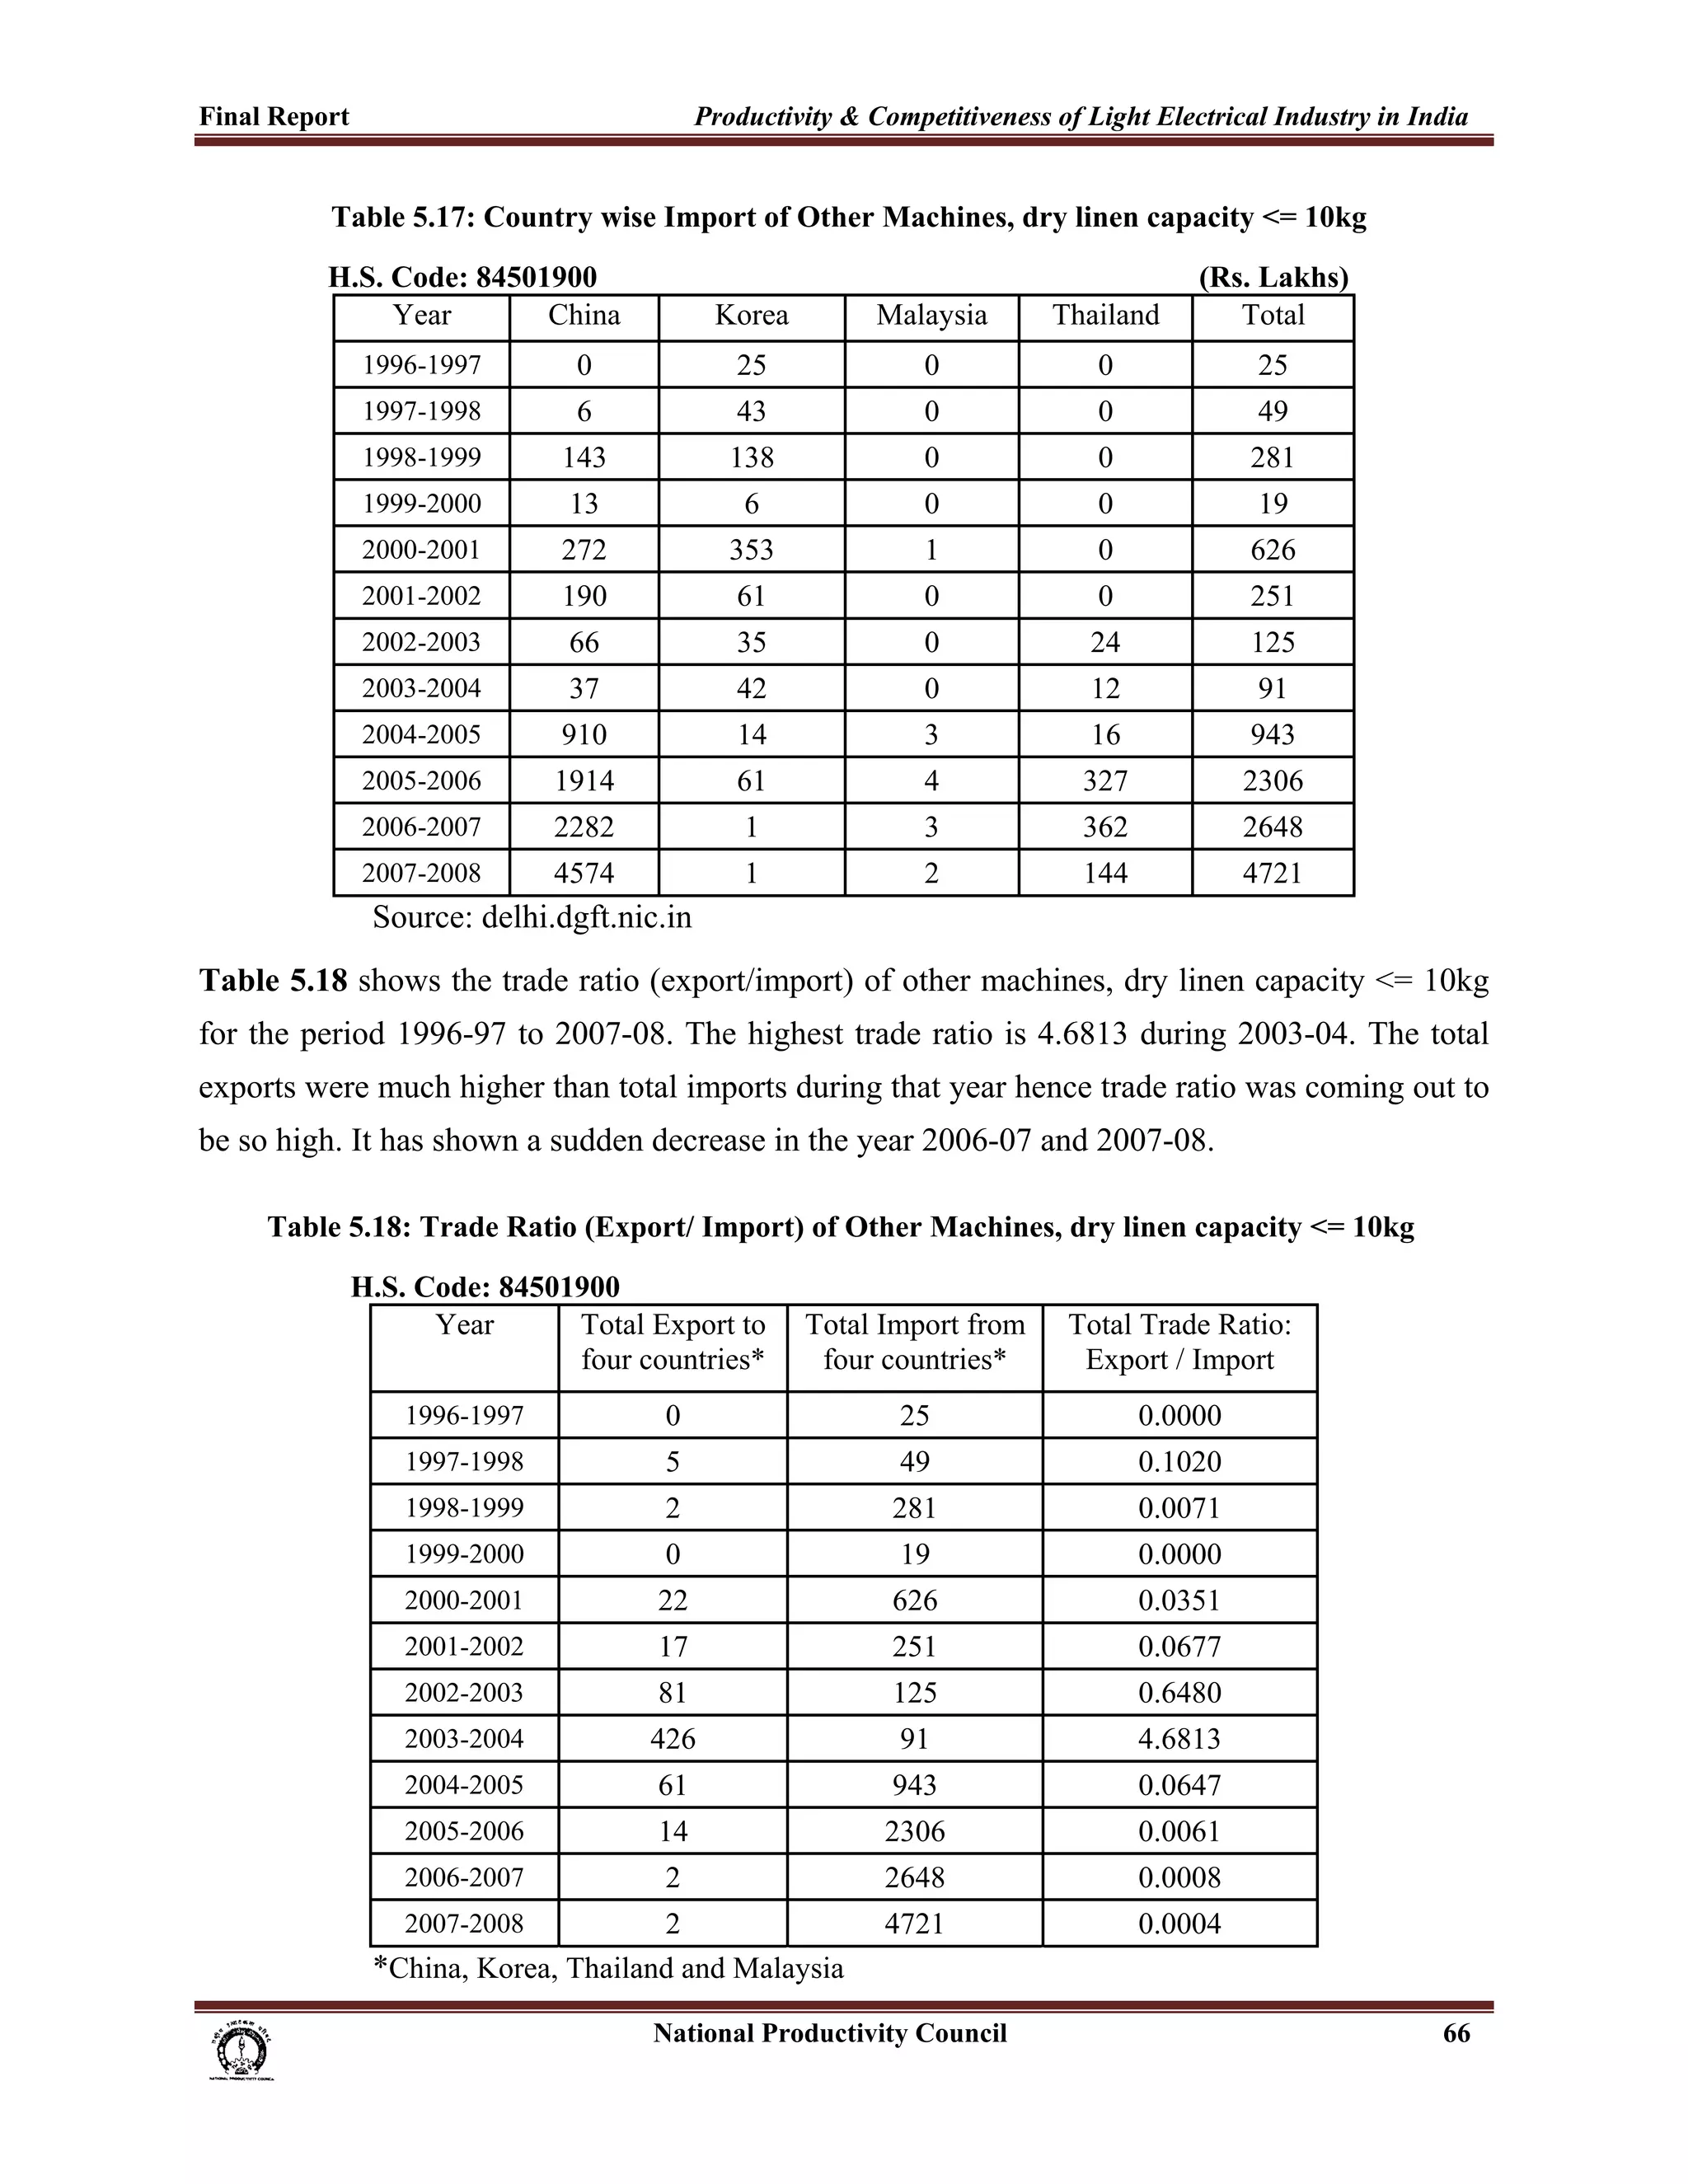
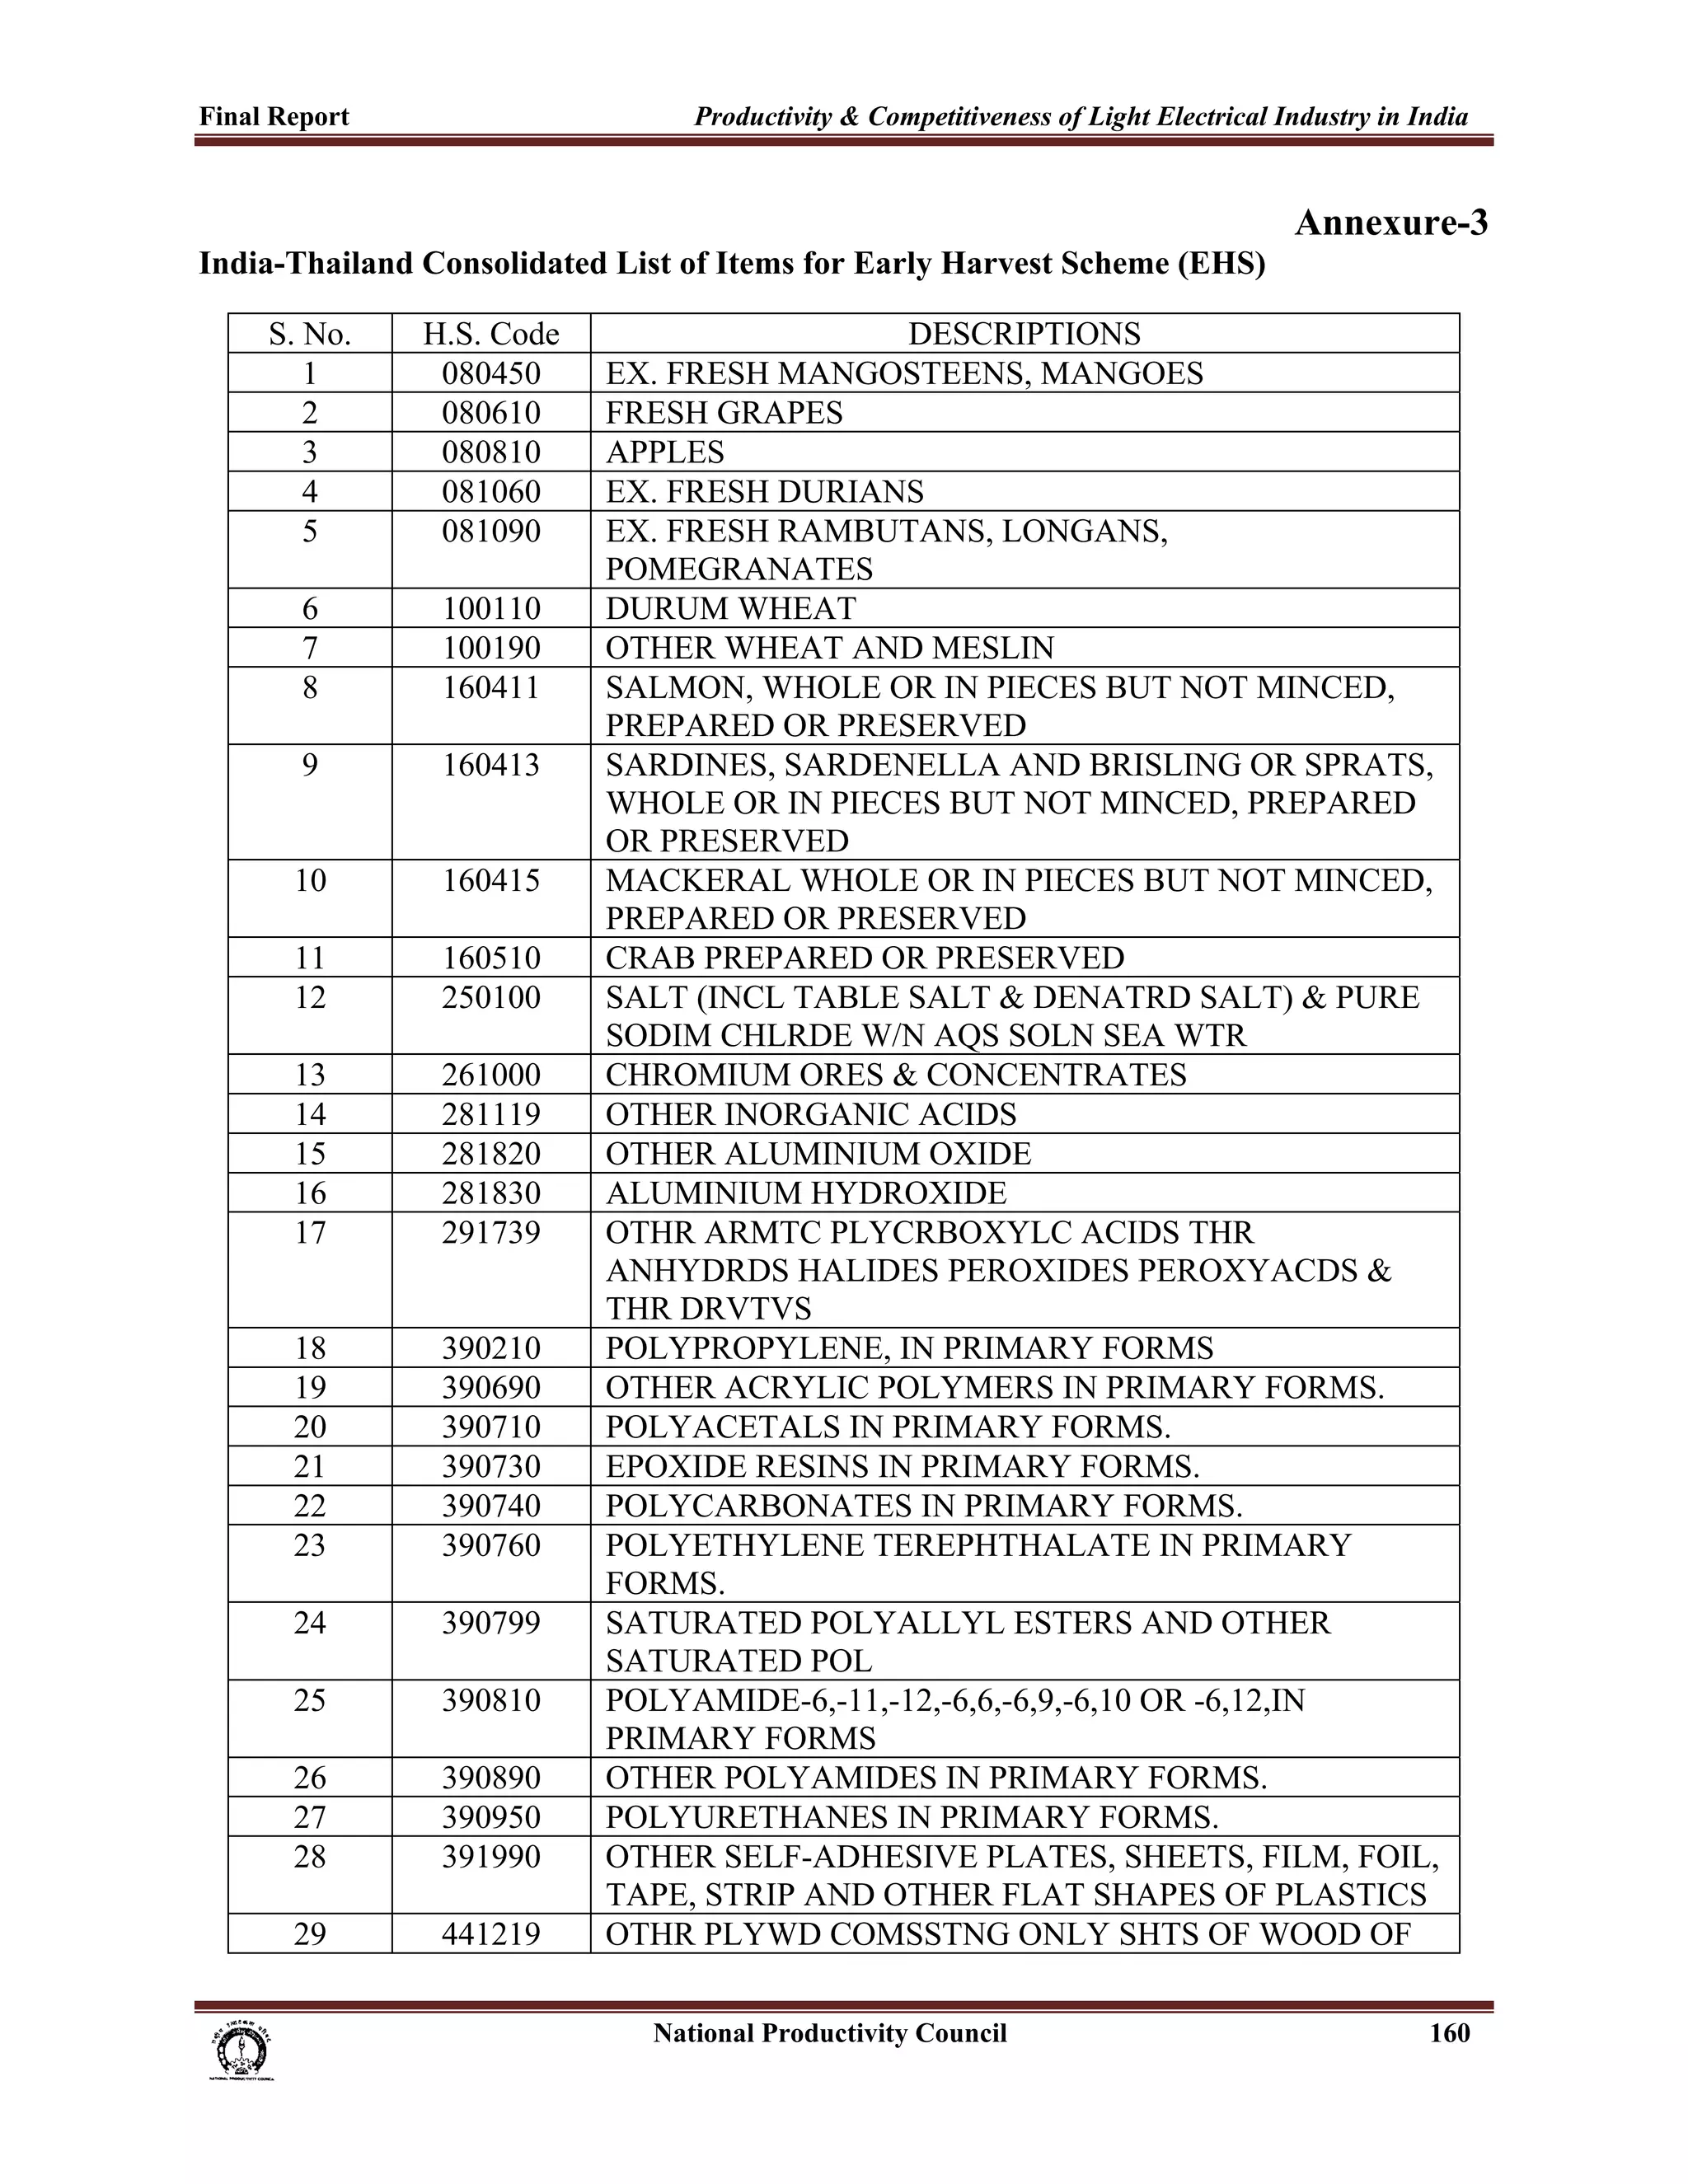
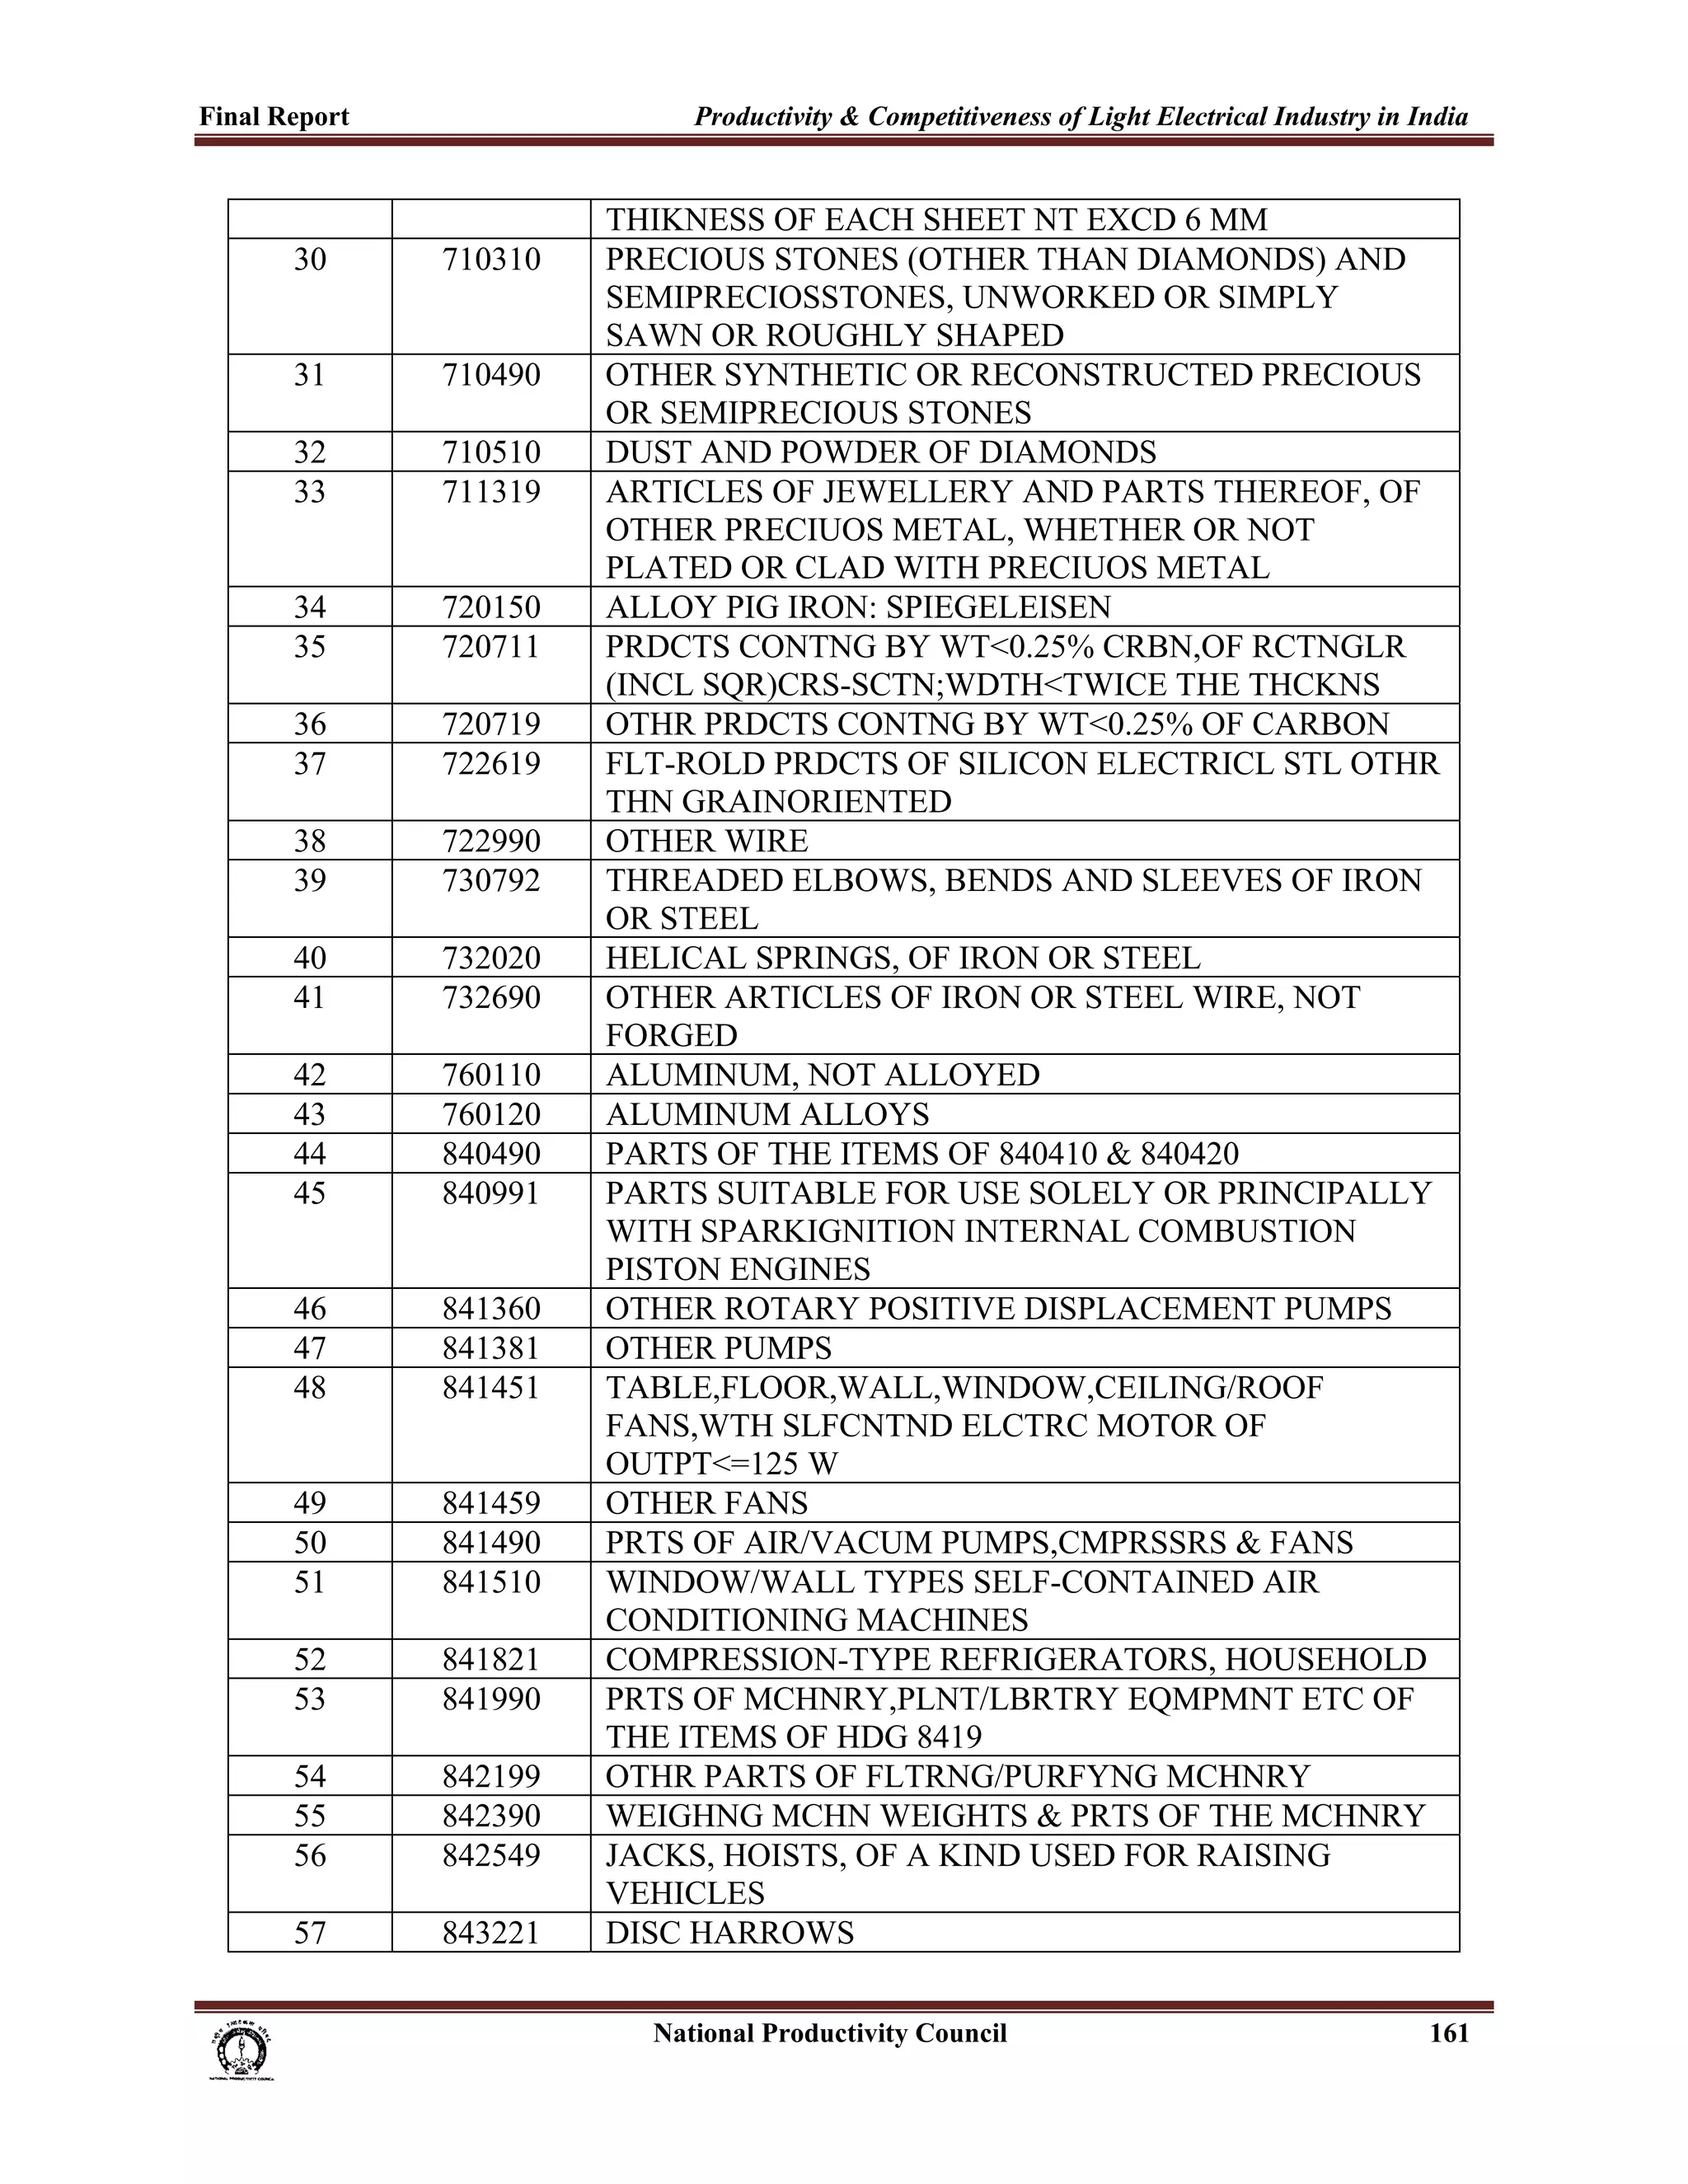
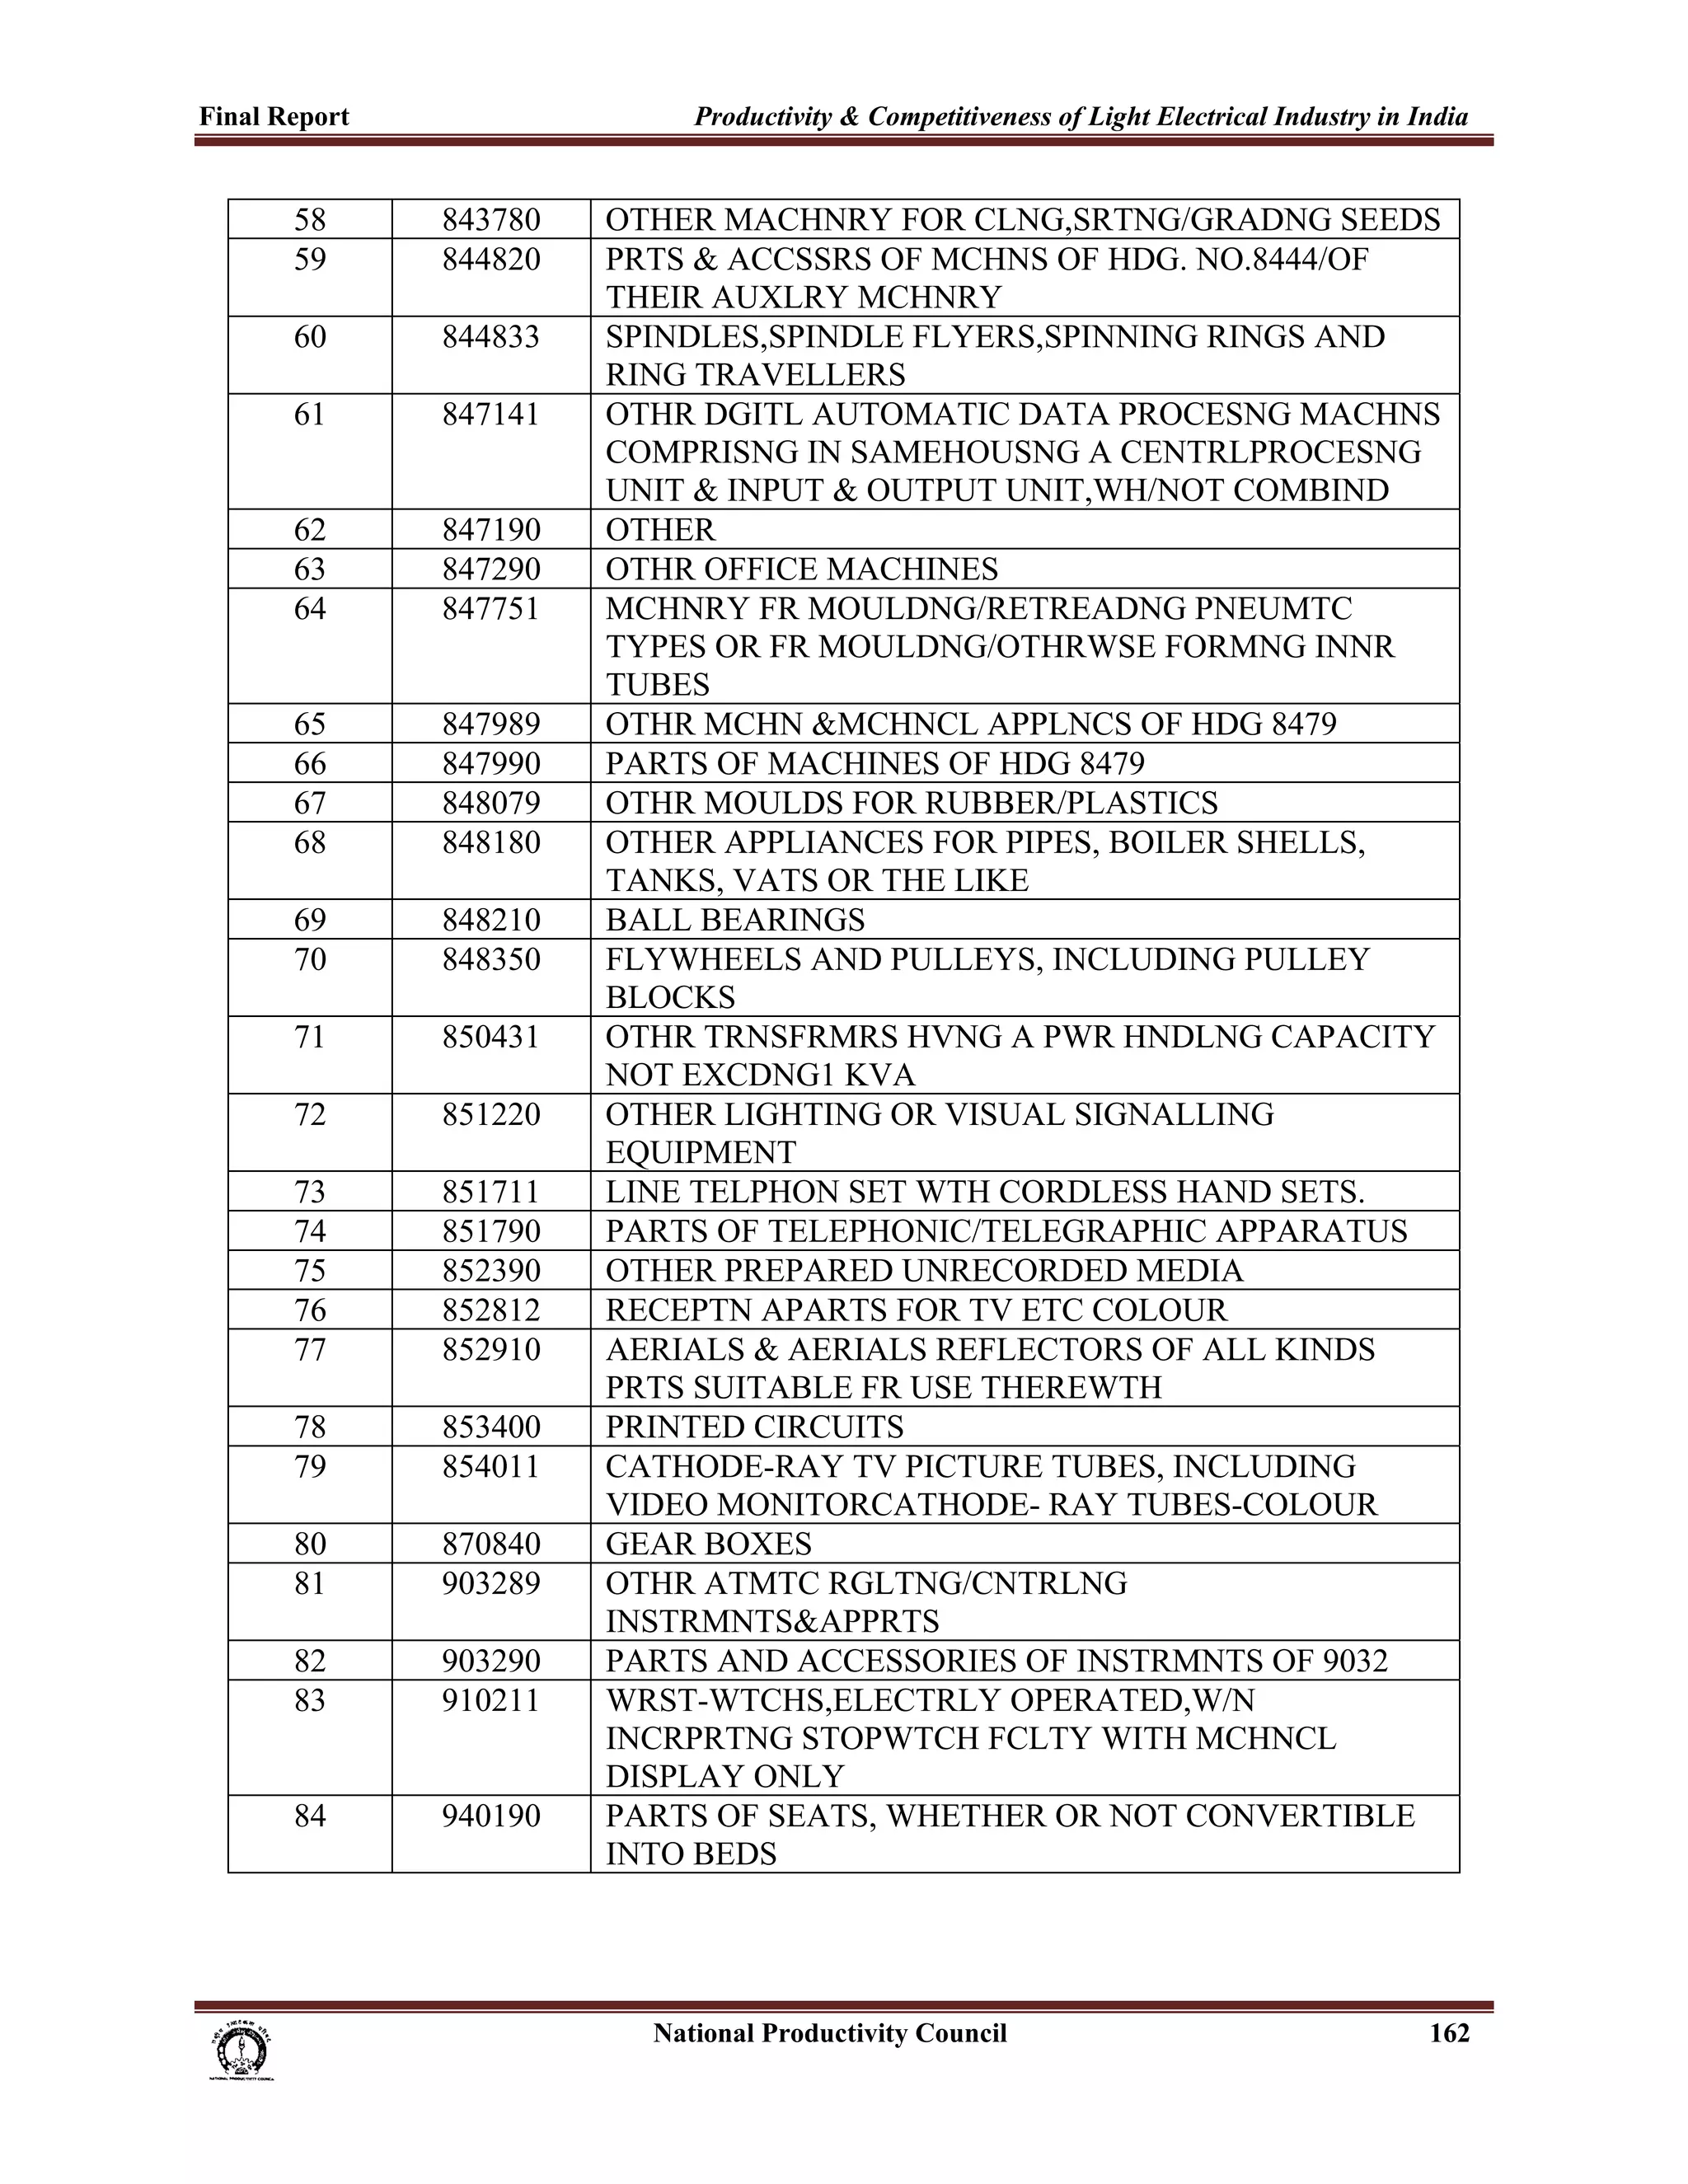
Results of econometric analysis confirmed that only two out of 84 import items from India that the
Thailand India Free Trade Agreements (TIFTA-EHS) tariff reductions have had positive impacts on
raising their import shares and caused trade diversion. (Ake –Aroon Auansakul, 2007)
Thailand is certainly benefiting over India with respect to the TIFTA- EHS as total exports’
values to India have increased much more than its total imports from India. The TIFTA-EHS
agreement is now ended. Thailand, in particular, should support a continuation and extension of
the Tifta-EHS and propose a merge of it into the broader Thailand and India FTA for the benefits
of the two countries [Ake –Aroon Auansakul, 2007]. Relevant authorities should be very
carefully in listing the products to be included in the agreement, by examining the trade diversion
impacts on the country’s economic efficiency and welfare.
A FICCI Survey on ‘India Thailand FTA: Emerging Issues, 2006’ notes that imports from Thailand of
the 82 Early Harvest Items stood at USD 104.84 million for the period April-December 2005 as against
USD 84.44 million for the same basket of commodities for the whole of 2003-04.
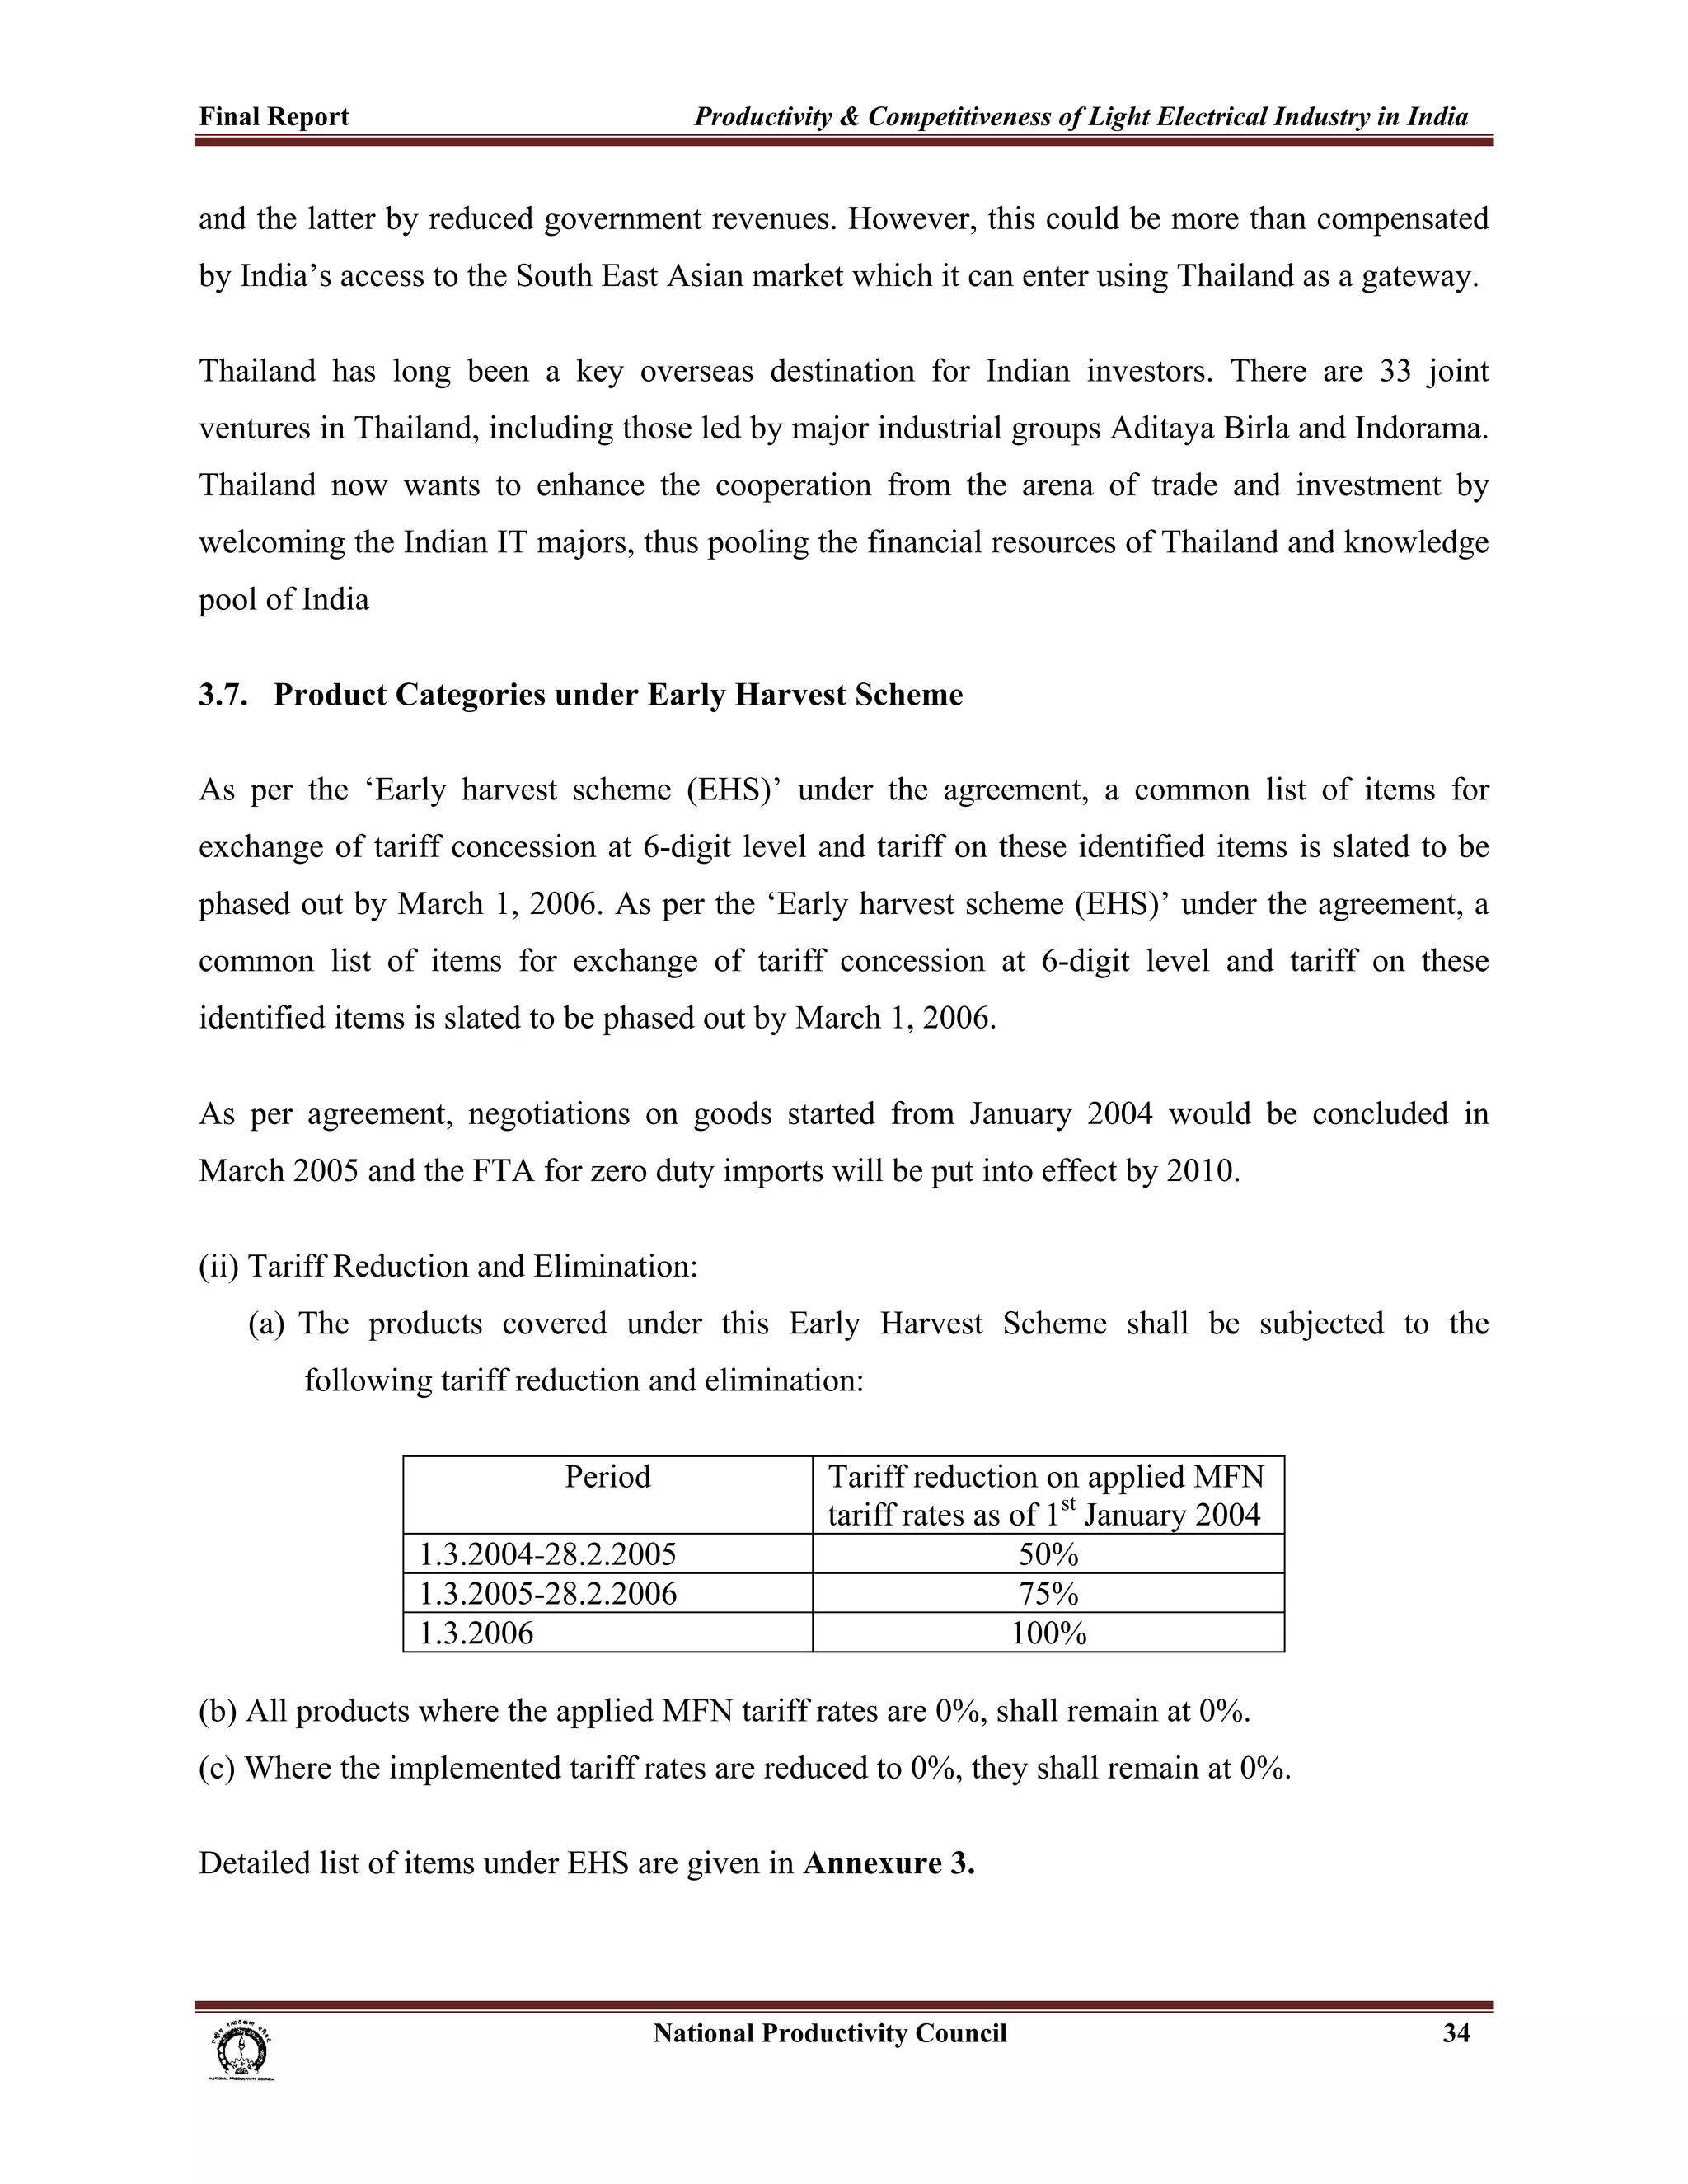
3.8. India signs FTA with ASEAN
India finally signed the Free Trade Agreement (FTA) with 10 nations in South Asian bloc
ASEAN amidst concerns and protests from within the cabinet, state governments and NGOs.
The FTA would eliminate tariffs on over 4000 products including electronics, chemicals and
textiles that account for more than 80 percent of total trade in goods between the two sides.
Tariffs on those products would be reduced to zero by 2016. Table 3.1 provides the list of
products from home appliances category included in the FTAs with ASEAN.
Table 3.1: India’s Revised offer list for ASEAN under AI-FTA dated 7th Feb 2008
Sl.No. HS Description Tariffs Offered
Code 2007-08 under
1 841821 Compression-type Refrigerators, Household 10 NT-1
2 845012 Other machines, with built-in centrifugal drier 10 NT-1
of a dry linen capacity
3 845019 Other machines of a dry linen capacity <=10 Kg 10 NT-1
4 851650 Microwave Ovens 10 NT-1
National Productivity Council 35](https://image.slidesharecdn.com/1-mainreport-130221063529-phpapp02/75/1-main-report-52-2048.jpg)
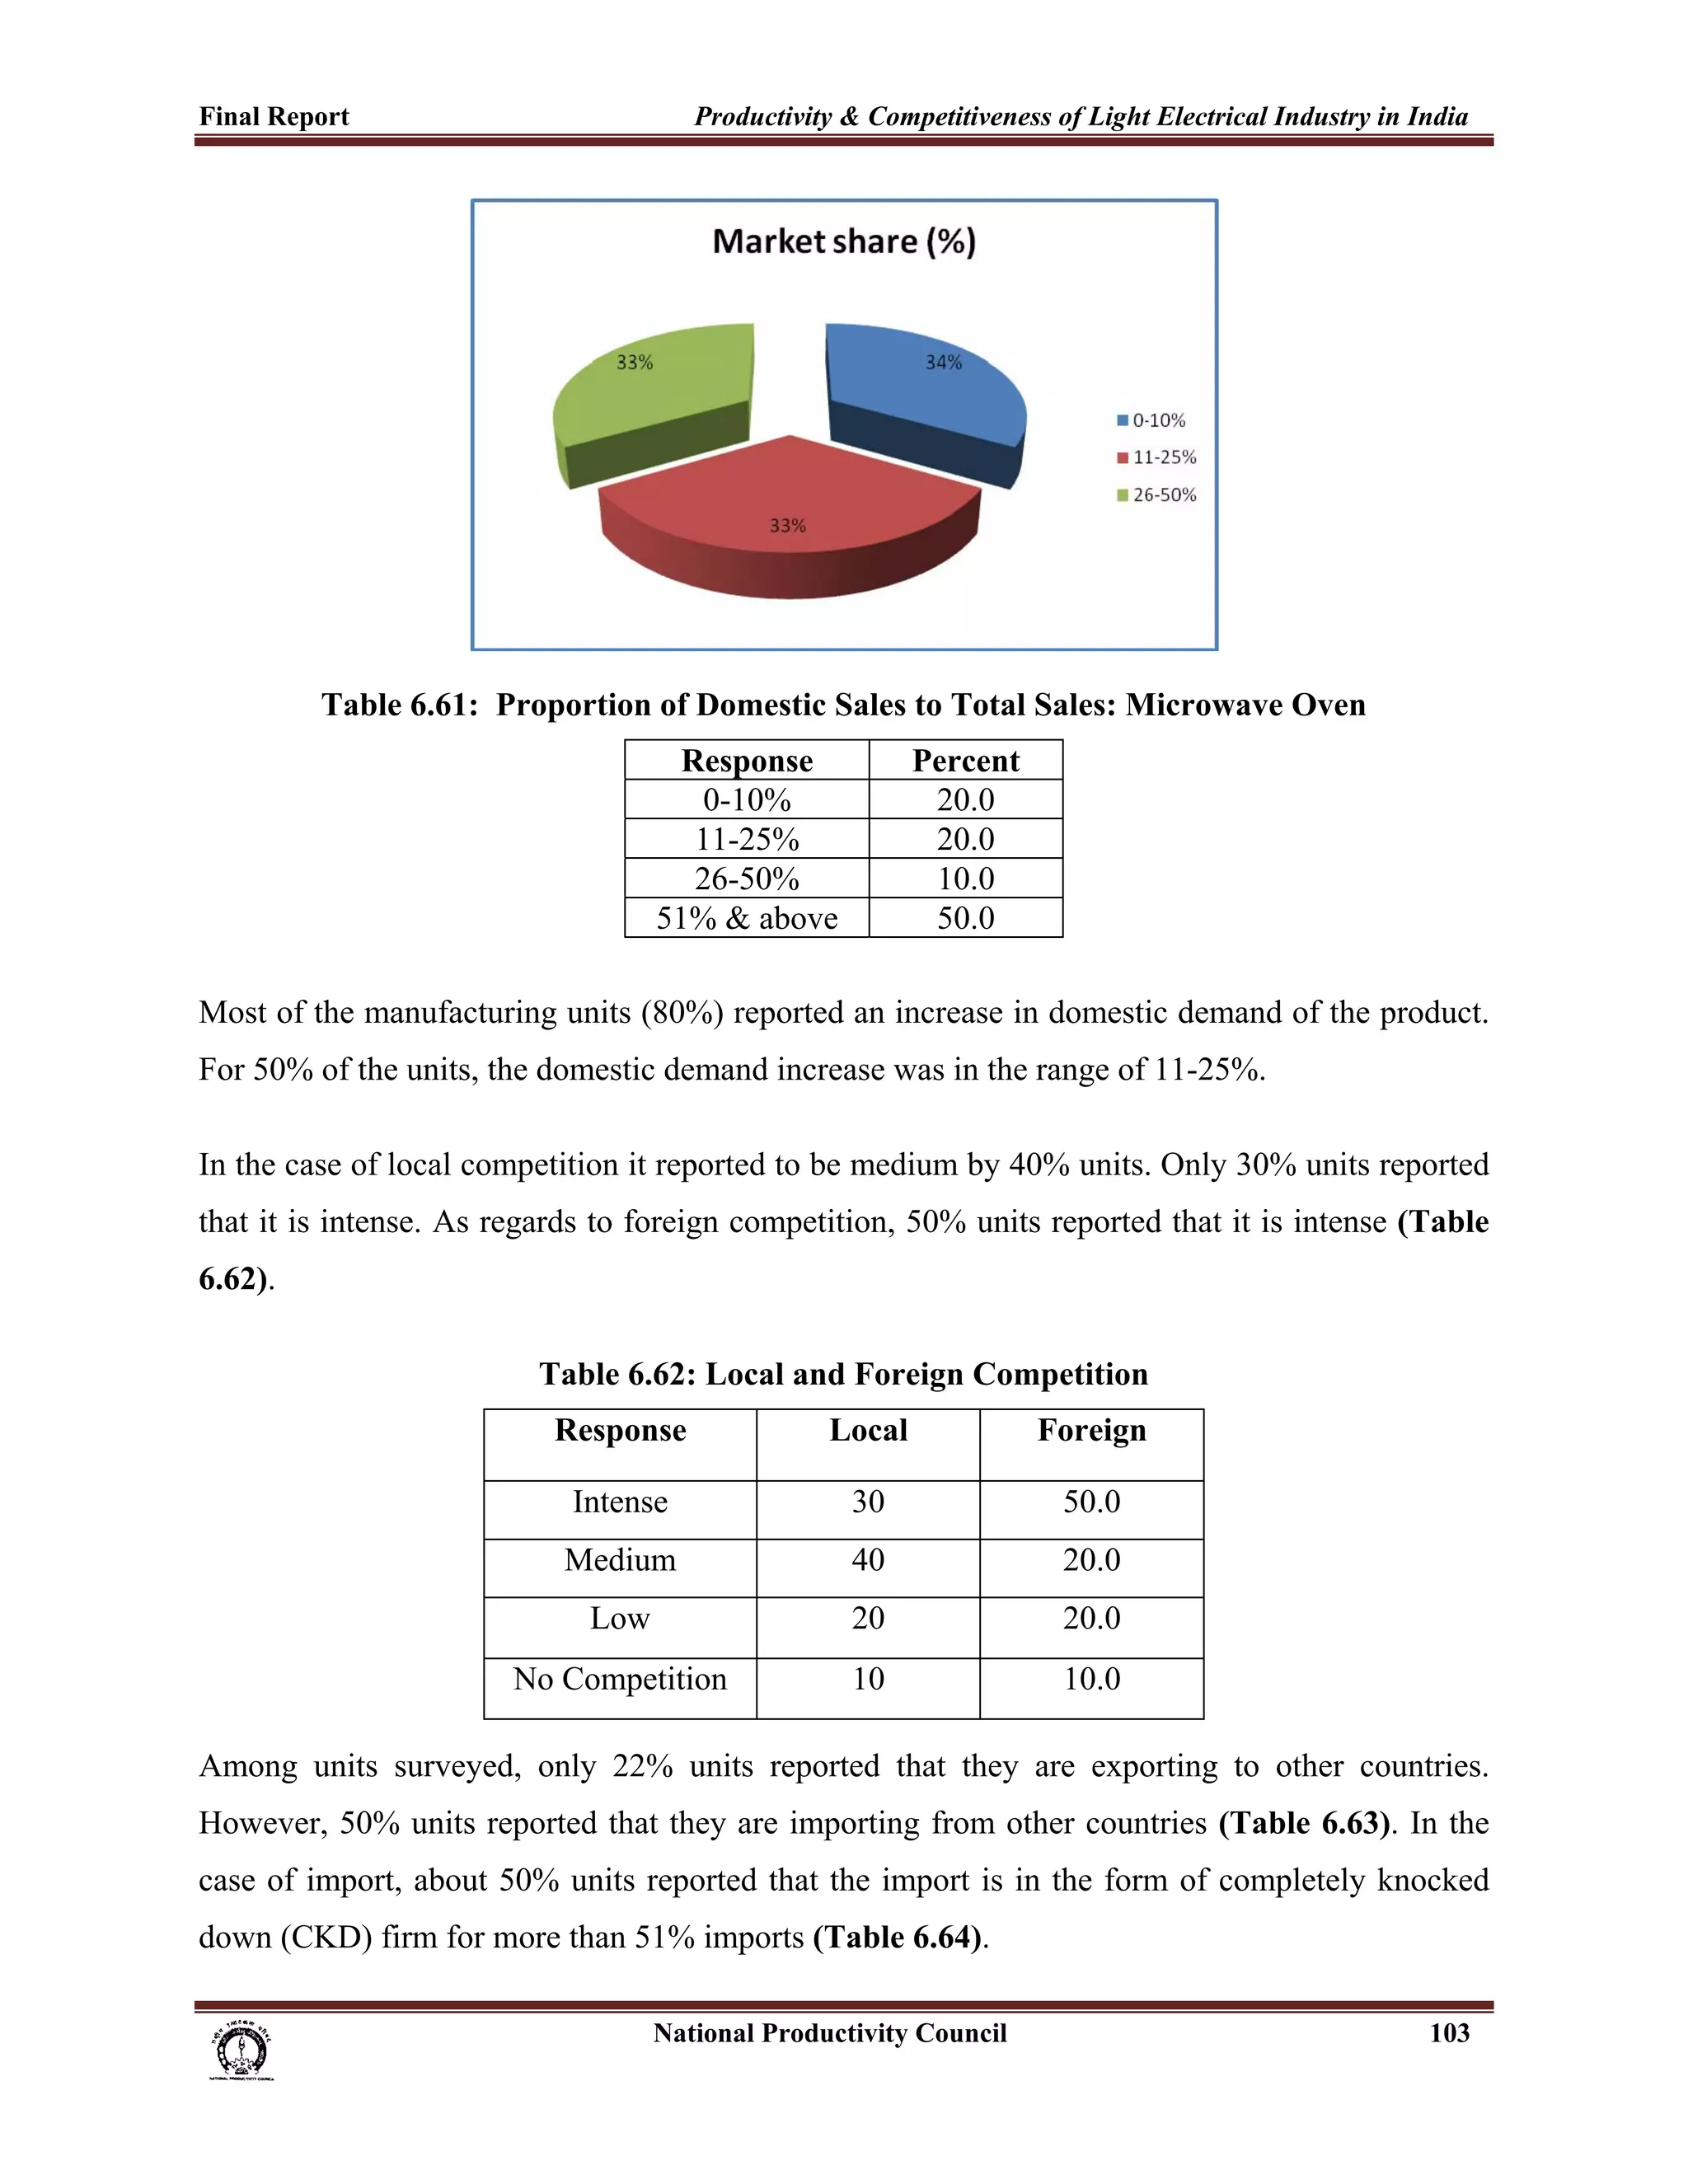


![Final Report Productivity & Competitiveness of Light Electrical Industry in India
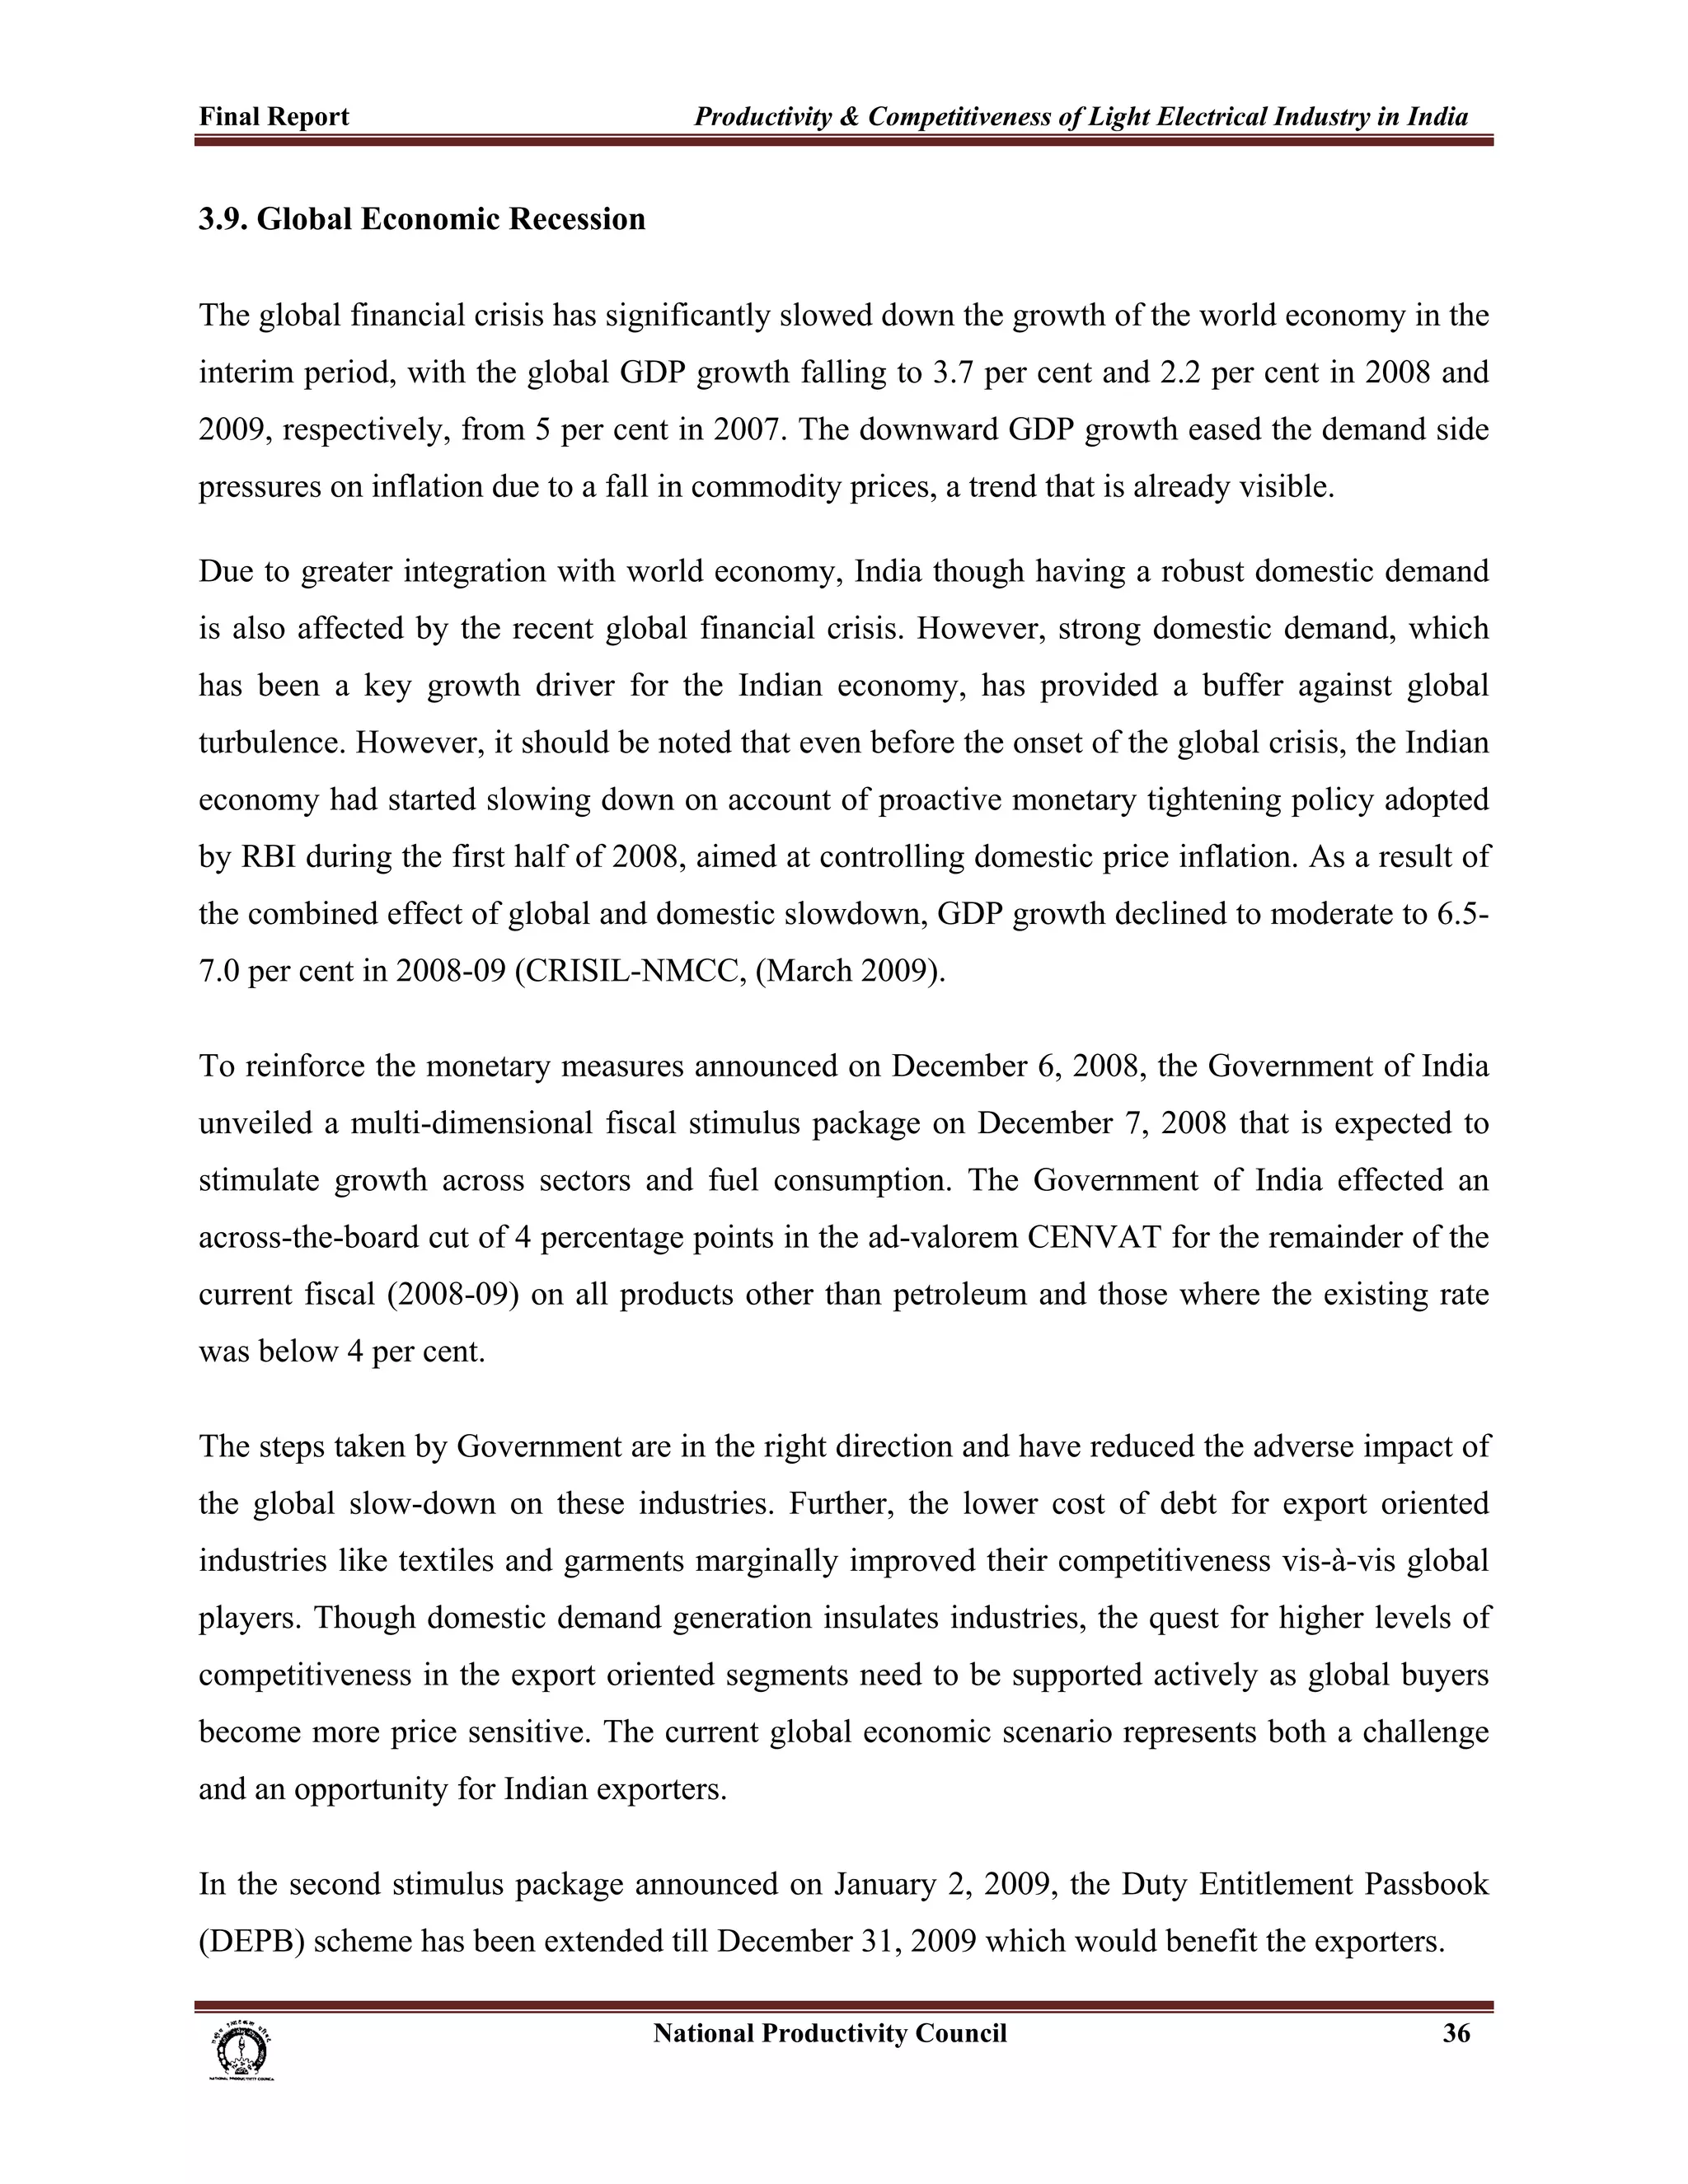
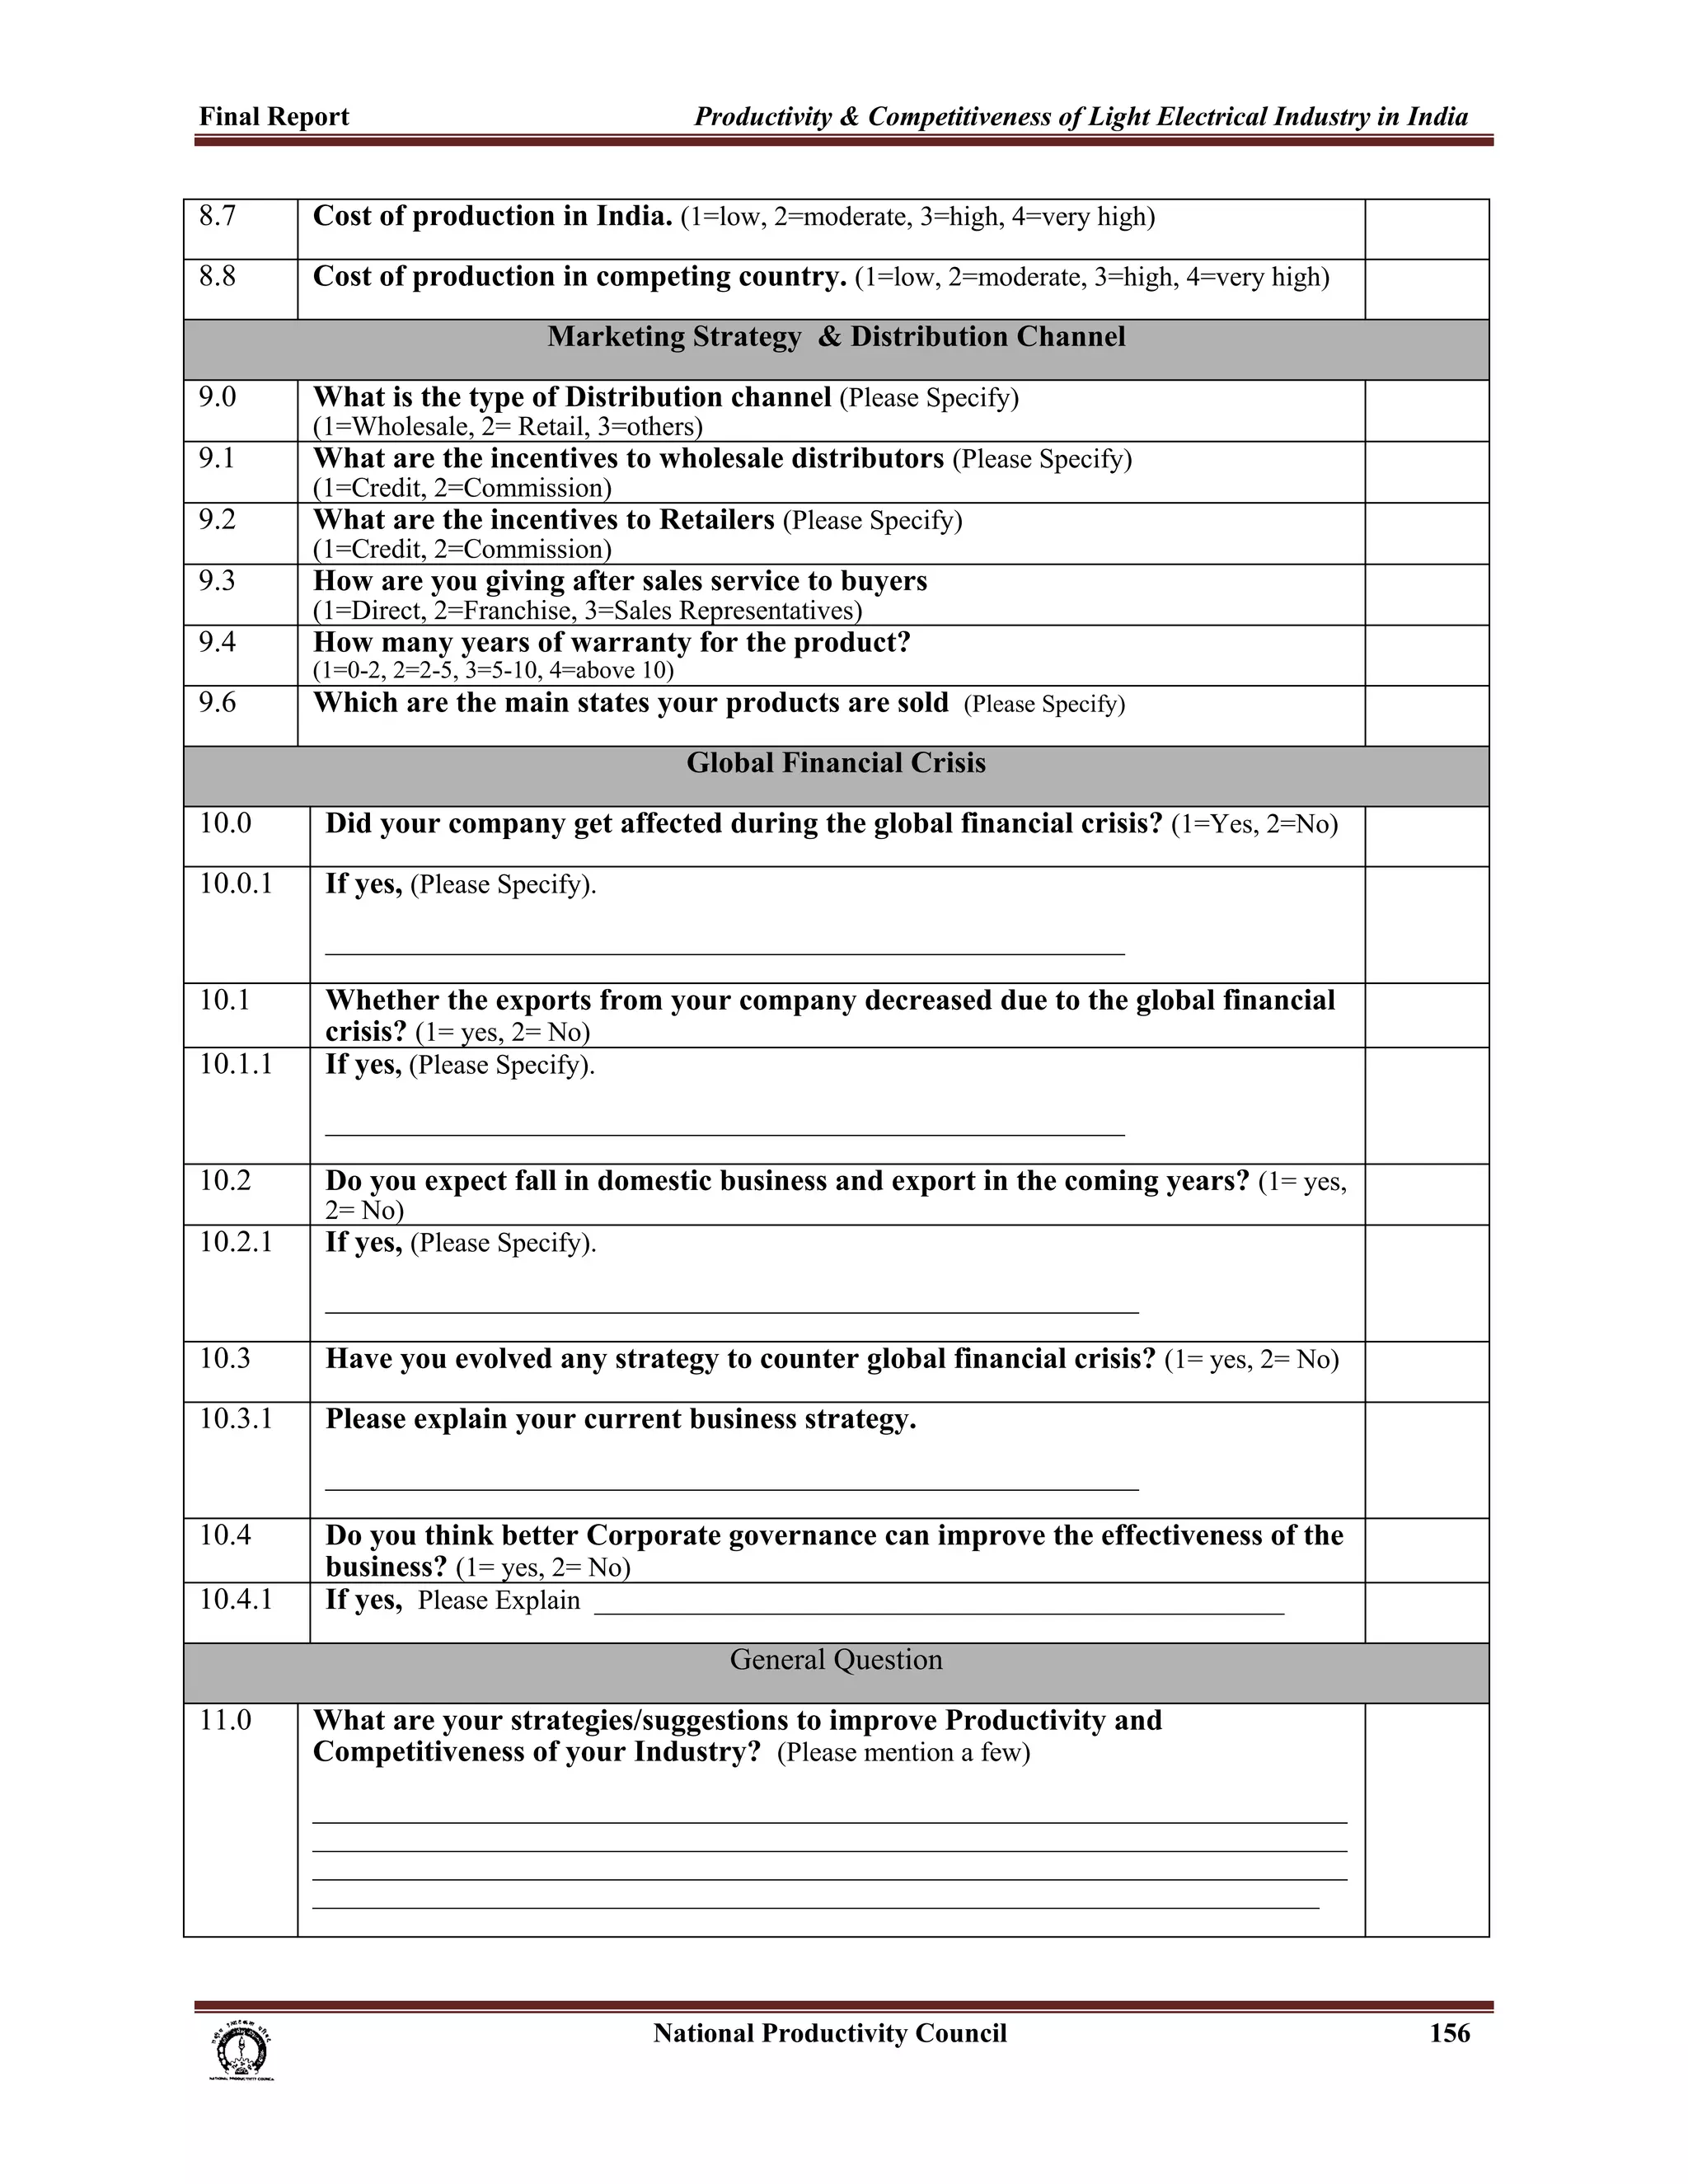
Employment Related Information
4.0 The contractual/daily wage employees during the last ten years (1=Increased,
2=decreased, 3=No change)
4.1 What is the estimated percentage of skilled employees? (1=0-10%, 2=11-25%,
3=26-50%, 4=51% & above)
4.1.1 What is the estimated percentage of non-skilled employees? (1=0-10%, 2=11-25%,
3=26-50%, 4=51% & above)
4.2 Growth in wages/salary in the organization during the last ten years. (1=
Increased, 2= Decreased, 3=No Change)
4.3 If Increased, please specify the range of increase in wages/ salary during the last
ten years?
(1=0-10%, 2=11-25%, 3=26-50%, 4=51% & above)
4.4 If decreased, please specify the range of decrease in wages/ salary during the
last ten years?
(1=0-10%, 2=11-25%, 3=26-50%, 4=51% & above)
Domestic Market Related Information
5.0 What is the market share of your product? Please specify the range (1=1-5%, 2=6-
10%, 3=11-25%, 4=26% & above)
5.1 What is the percentage of Domestic Sales to Total Sales (1=0-10%, 2=11-25%,
3=26-50%, 4=51% & above)
5.2 Growth in the domestic demand of your products during last ten years. (1=
Increased, 2= Decreased, 3=No Change)
5.2.1 If Increased, please specify the range of increase in the domestic demand of
your products?
(1=0-10%, 2=11-25%, 3=26-50%, 4=51% & above)
5.2.2 If decreased, please specify the range of decrease in the domestic demand of
your products in the last ten years?
(1=0-10%, 2=11-25%, 3=26-50%, 4=51% & above)
5.3 Extent of competition in the domestic market from local companies? [1=Intense
(>20 players), 2=Medium (10-20 Players), 3=Low (0-10 Players), 4=No Competition]
5.3.1 Extent of competition in the domestic market from foreign companies?
[1=Intense (>20 players), 2=Medium (10-20 Players), 3=Low (0-10 Players), 4=No
Competition]
Trade Related Information
6.0 Is your organization engaged in Exports (1=Yes, 2= No)
6.0.1 If yes, what is the percentage of Export to Total Sales
(1=0-10%, 2=11-25%, 3=26-50%, 4=51% & above)
6.1 Growth in export during the last ten years. (1=Increased, 2= Decreased, 3=No
Change,)
6.1.1 Please specify the range of increase in export during the last ten years? (1=0-
10%, 2=11-25%, 3=26-50%, 4=51% & Above)
6.1.2 Please specify the range of decrease in export during the last ten years? (1=0-
10%, 2=11-25%, 3=26-50%, 4=51% & above)
6.2 Is your organization engaged in Imports? (1=Yes, 2= No)
6.2.1 If yes, what is the percentage of Import to Total Sales
(1=0-10%, 2=11-25%, 3=26-50%, 4=51% & above)
6.2.2 Please specify the type of Import?
(1=Full product, 2=Component, 3=Raw materials )
6.2.3 How much percentage of your sales belong to Complete Knock Down (CKD)
category? (1=0-10%, 2=11-25%, 3=26-50%, 4=51% & above)
6.2.4 How many percentage of your sales are Semi Knock Down (SKD) category?
(1=0-10%, 2=11-25%, 3=26-50%, 4=51% & above)
National Productivity Council 154](https://image.slidesharecdn.com/1-mainreport-130221063529-phpapp02/75/1-main-report-171-2048.jpg)
![Final Report Productivity & Competitiveness of Light Electrical Industry in India
6.3 Please specify the major country from where you are importing finished products.
__________________________________________________________
6.4 Please mention your export destinations
Product Description Countries you are exporting to
6.4.1 Please mention the competitive advantage of competing Countries (1=Low Cost of
Production, 2= Capital Intensive Production, 3=Large scale operations, 4=Latest Technology, 5=better
Quality of product, 6=Other, specify
6.5 The factor (s) affecting imports (1= Import pricing Scheme,2= Import licenses,
3=Import quotas, 4=Import prohibition, 5=Quantitative safeguard measures, 6=Export
restraint arrangement,7=Non trade Barriers, 8=Any other, specify)
6.6 The factor (s) affecting exports (1=Export taxes, 2= Export quantitative restriction,
3=Certification, 4=Inspection fee, 5=State trading administration, 6=Dual pricing schemes,
6=Non trade barriers,7=Any other, specify)
Factors responsible for Competitiveness
7.0 Availability of Raw materials for production.
1=Imported, 2=Within country, 3=Within Region/State, 4=Other
7.1 Are there policies made by the government which help in growth in your
Industry? (1=Yes, 2=No)
7.2 What are the support measures taken by the government?
(1=Purchase preference policy, 2=Price preference policy, 3=others)
7.3 Has removal of Quantitative Restrictions helped your company? (1=Yes, 2=No)
7.4 What are the marketing constraints for the your Industry (Please Specify)
7.5 Are you satisfied with the Government’s interface with business/private sector?
[1=Excellent, 2=Average, 3=Poor]
7.6 Do you consider government friendly towards investor?(1=Yes,2=No)
Competitive advantage of Competing Countries
8.0 Clearance to start a manufacturing unit in India takes. (1=1-2 months, 2=3-5
months, 3=6-9 months, 4=10-12 months, 5=more than one year)
8.1 A clearance to start a manufacturing unit in competing country takes. (1=1-2
months, 2=3-5 months, 3=6-9 months, 4=10-12 months, 5=more than one year)
8.2 Availability and quality of basic infrastructure such as power, water, road, rail
etc. in India.(1=poor, 2=reasonable, 3=good, 4=excellent)
8.3 Availability and quality of basic infrastructure such as power, water, road, rail
etc. in your unit.(1=poor, 2=reasonable, 3=good, 4=excellent)
8.4 Availability and quality of basic infrastructure such as power, water, road, rail
etc. in competing country.(1=poor, 2=reasonable, 3=good, 4=excellent)
8.5 Taxes and other controls in India (1=low, 2=moderate, 3= high, 4=very high)
8.6 Taxes and other controls in competing countries. (1=low, 2=moderate, 3= high,
4=very high)
National Productivity Council 155](https://image.slidesharecdn.com/1-mainreport-130221063529-phpapp02/75/1-main-report-172-2048.jpg)
![Final Report Productivity & Competitiveness of Light Electrical Industry in India
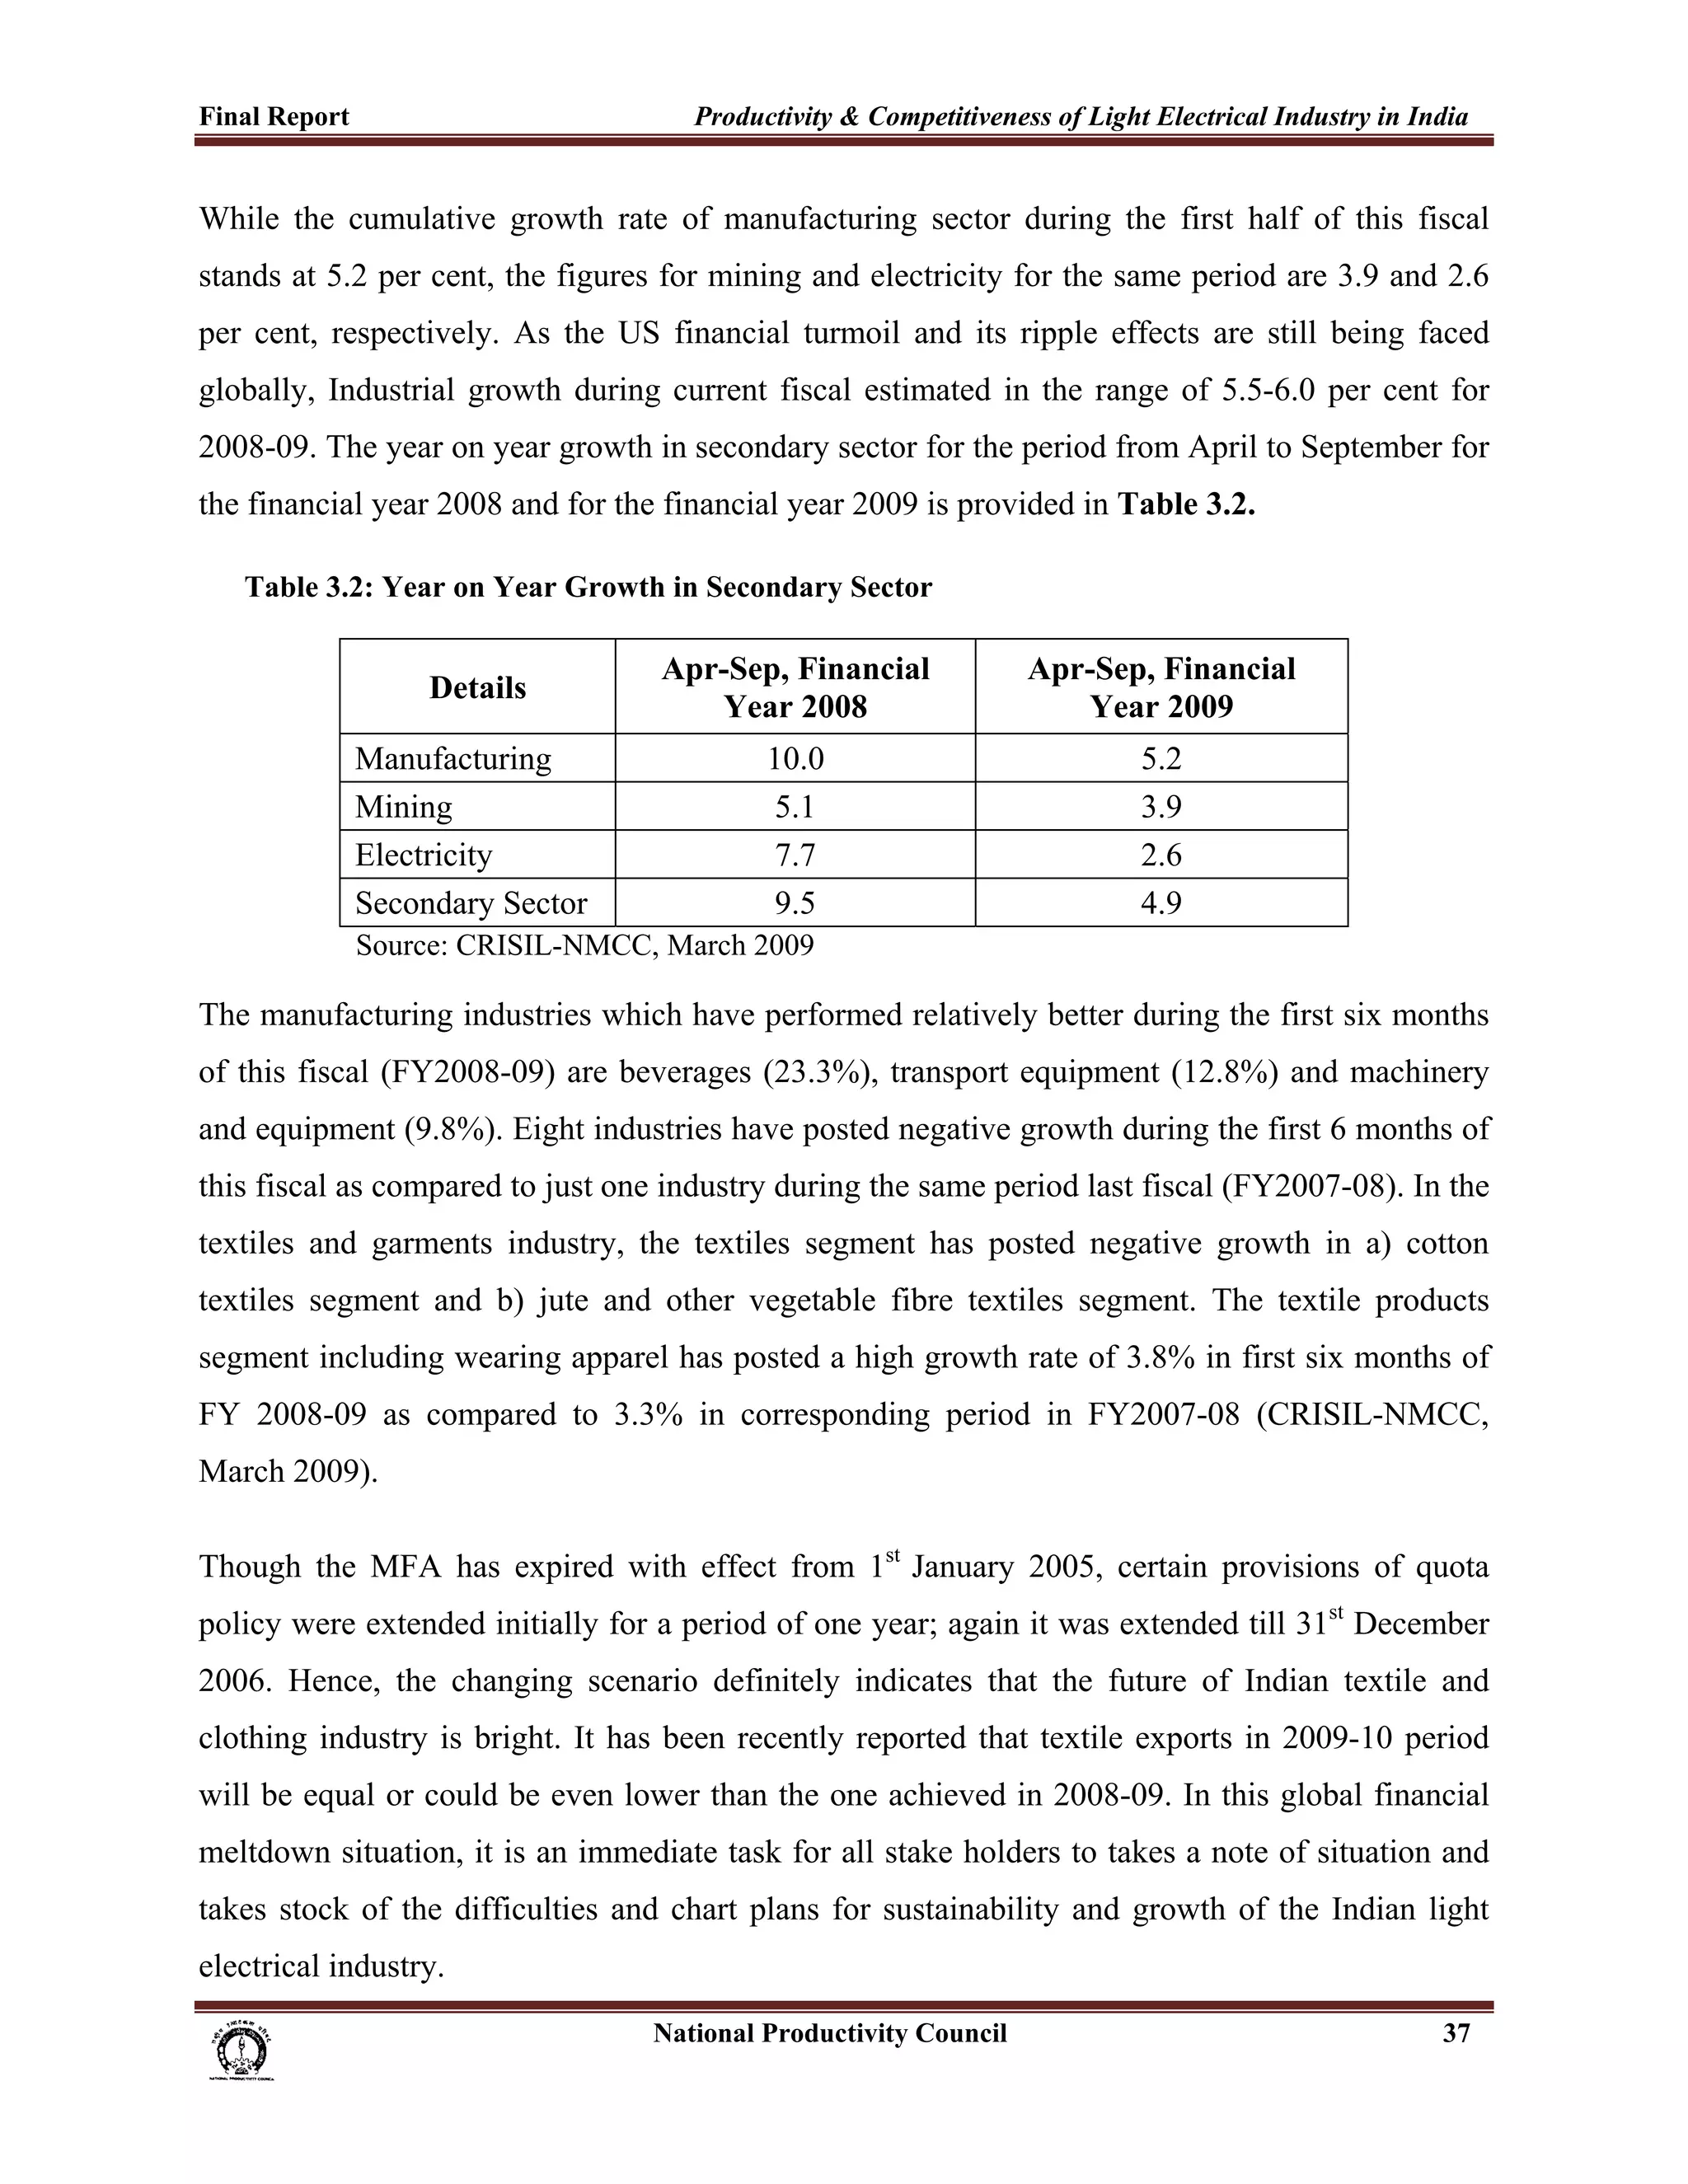
Annexure - 4
Methodology Adopted for Partial and Total Factor Productivity Estimations
Productivity can be measured in terms of both partial and total factor productivity methods. Most
commonly used partial productivity measures are Labour Productivity and Capital Productivity
estimations. The partial productivities are measured as a ratio of Gross Value Added per worker
or per unit of capital invested.
The partial productivity methodology is based on the premise ‘ceteris paribus’ that only two
factor inputs used in the production process such as labour and capital. Details regarding the data
construction and estimation procedures are given as below.
A. Labour Productivity
• Labour input is considered as the total number of persons engaged in the production
process. The data has been compiled from Annual Survey of Industries Summary results for
Factory Sector data base for various years. The Gross Value Added data has been first deflated
by the whole sale price index for the sports goods. The formula for calculating the labour
productivity can be given as follows:
Labour Productivity (LP) =
[ ((Gross Value Added/Price Index) x 100)
Number of Persons Engaged ]
Labour Productivity Growth
• Once the labour productivity has been calculated, we can estimate annual labour
productivity growth using the growth rate estimation formula :
[
Labour Productivity ═ Labour Productivity t – Labour productivity t-1
] × 100
Growth Labour Productivity t-1
Labour Productivity Growth Index:
To understand the trends in Labour Productivity Growth, we can construct year to year growth
rates as an index of Labour Productivity Growth Rate. Initial value of the series is considered
equal to 100 and the subsequent years Labour Productivity Growth Rates are added to it
cumulatively. This will provide us an index of Labour Productivity Growth for the sports goods
sector for the years starting from 1995-96 to 2005-06.
National Productivity Council 163](https://image.slidesharecdn.com/1-mainreport-130221063529-phpapp02/75/1-main-report-180-2048.jpg)
![Final Report Productivity & Competitiveness of Light Electrical Industry in India
Capital Productivity
Since capital investment is given as the book value in the ASI data, we have to estimate the
capital stock in operation for every year. The Capital stock estimation follows the procedure
given below.
• Capital Stock Estimation
To calculate capital stock we have used Perpetual Inventory Method. Capital stock has been
estimated from the book value of Gross Fixed Capital compiled from the ASI Database.
• Fixed capital data from ASI for the sports goods sector taken for the years 1995-2006.
• The book value of fixed capital at 1995-96 is multiplied by Gross net ratio of capital for
getting initial year capital stock.
• Incremental capital during the year 1996-97 at constant prices (deflated with the
machinery and machine tools prices at 1993-94 prices) is added to the initial year capital
stock of 1995-96 for getting the capital stock for 1996-97at constant prices.
Incremental capital = ((Fixed capital 1996-97 - Fixed capital 1995-96)
To calculate the capital productivity we have divided Gross Value Added at constant prices by
the estimated fixed capital. The formula used to calculate the capital productivity is as follows:
Capital Productivity=
[ (Gross Value Added at constant prices)
Capital stock at constant prices ]
Capital Productivity Growth
Capital Productivity Growth Rate =
[ ]
Capital Productivity t - Capital Productivity t-1 x 100
Capital Productivity t-1
National Productivity Council 164](https://image.slidesharecdn.com/1-mainreport-130221063529-phpapp02/75/1-main-report-181-2048.jpg)
![Final Report Productivity & Competitiveness of Light Electrical Industry in India
Capital Productivity Growth Index
As in the case of Labour Productivity Growth Index, Capital Productivity Growth Index is also
constructed on a scale 100.
Gross Value Added Growth Rate =
[ GVAt – GVA t-1
GVA t-1
] x 100
B. Total-Factor Productivity Growth (TFPG)
Total Factor productivity Growth has been estimated using the Divisia index method. Here, it is
considered that Total Factor Productivity Growth is the result of technical progress. Technical
progress or TFPG is estimated as a residue of the difference between output growth rates and
input growth rates.
o o
TFPG= GVA – [WL x Labour Productivity Growth + WK x Capital Productivity Growth]
Where
WL + WK = 1
and
WL = Wage Share in Total Cost
WK= Capital Share in Total Cost
Total-Factor Productivity Growth Index
As in the case of Labour and capital productivity, Total Factor Productivity Growth Index can
also be constructed with base 100 for the initial year and adding the subsequent growth rates
cumulatively.
National Productivity Council 165](https://image.slidesharecdn.com/1-mainreport-130221063529-phpapp02/75/1-main-report-182-2048.jpg)