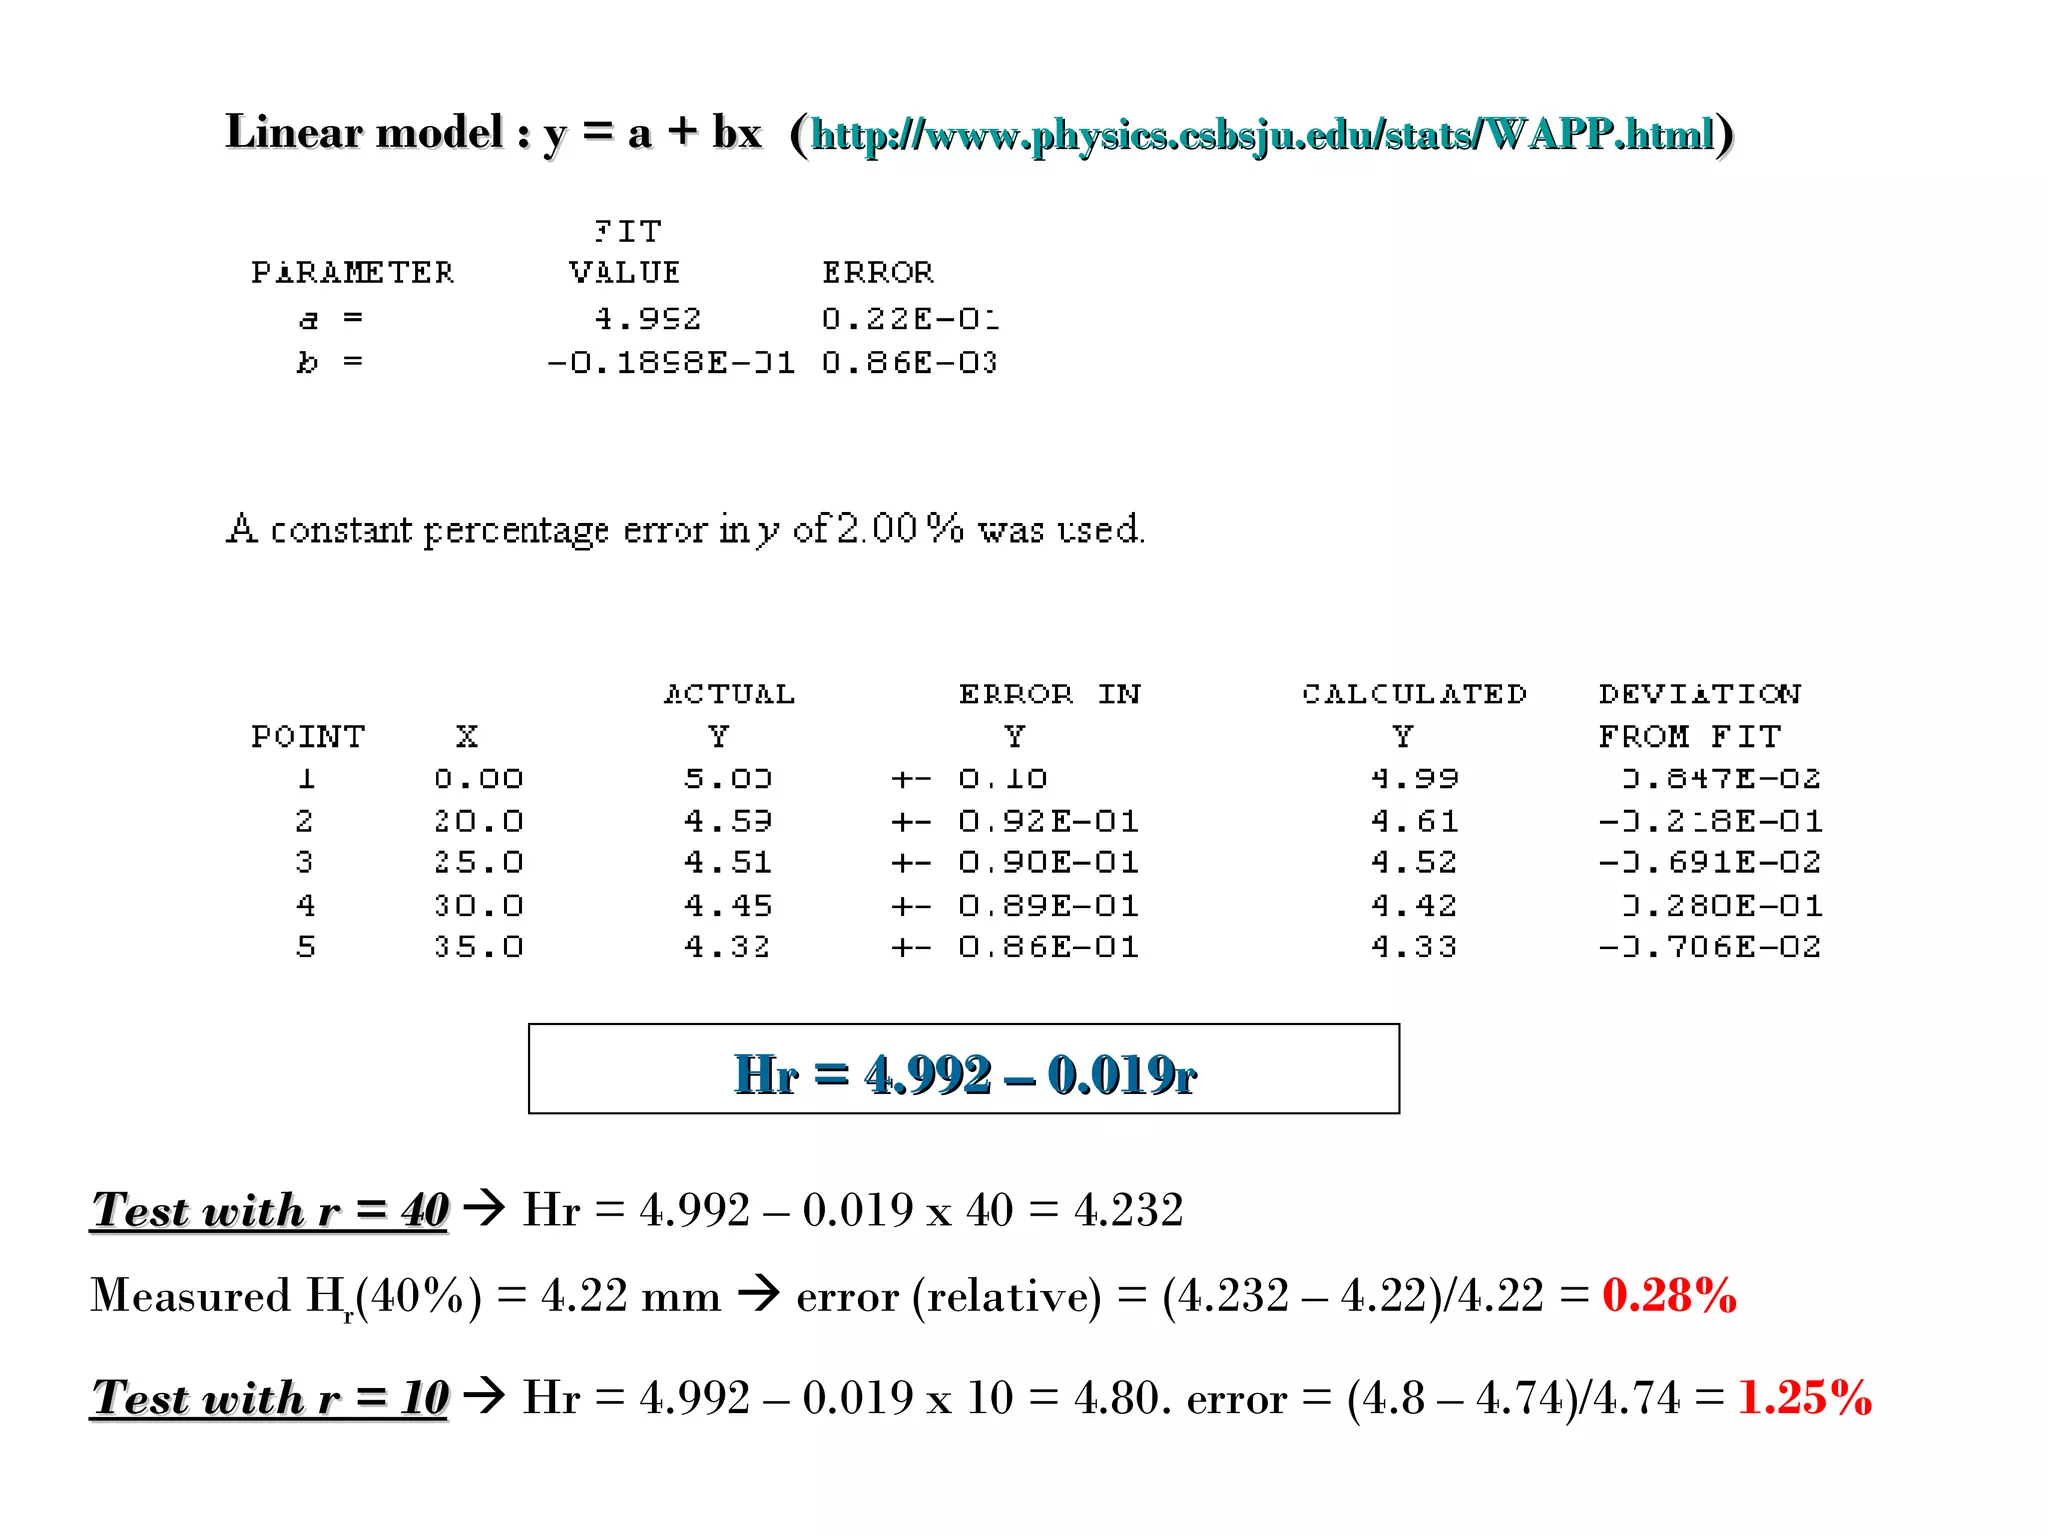
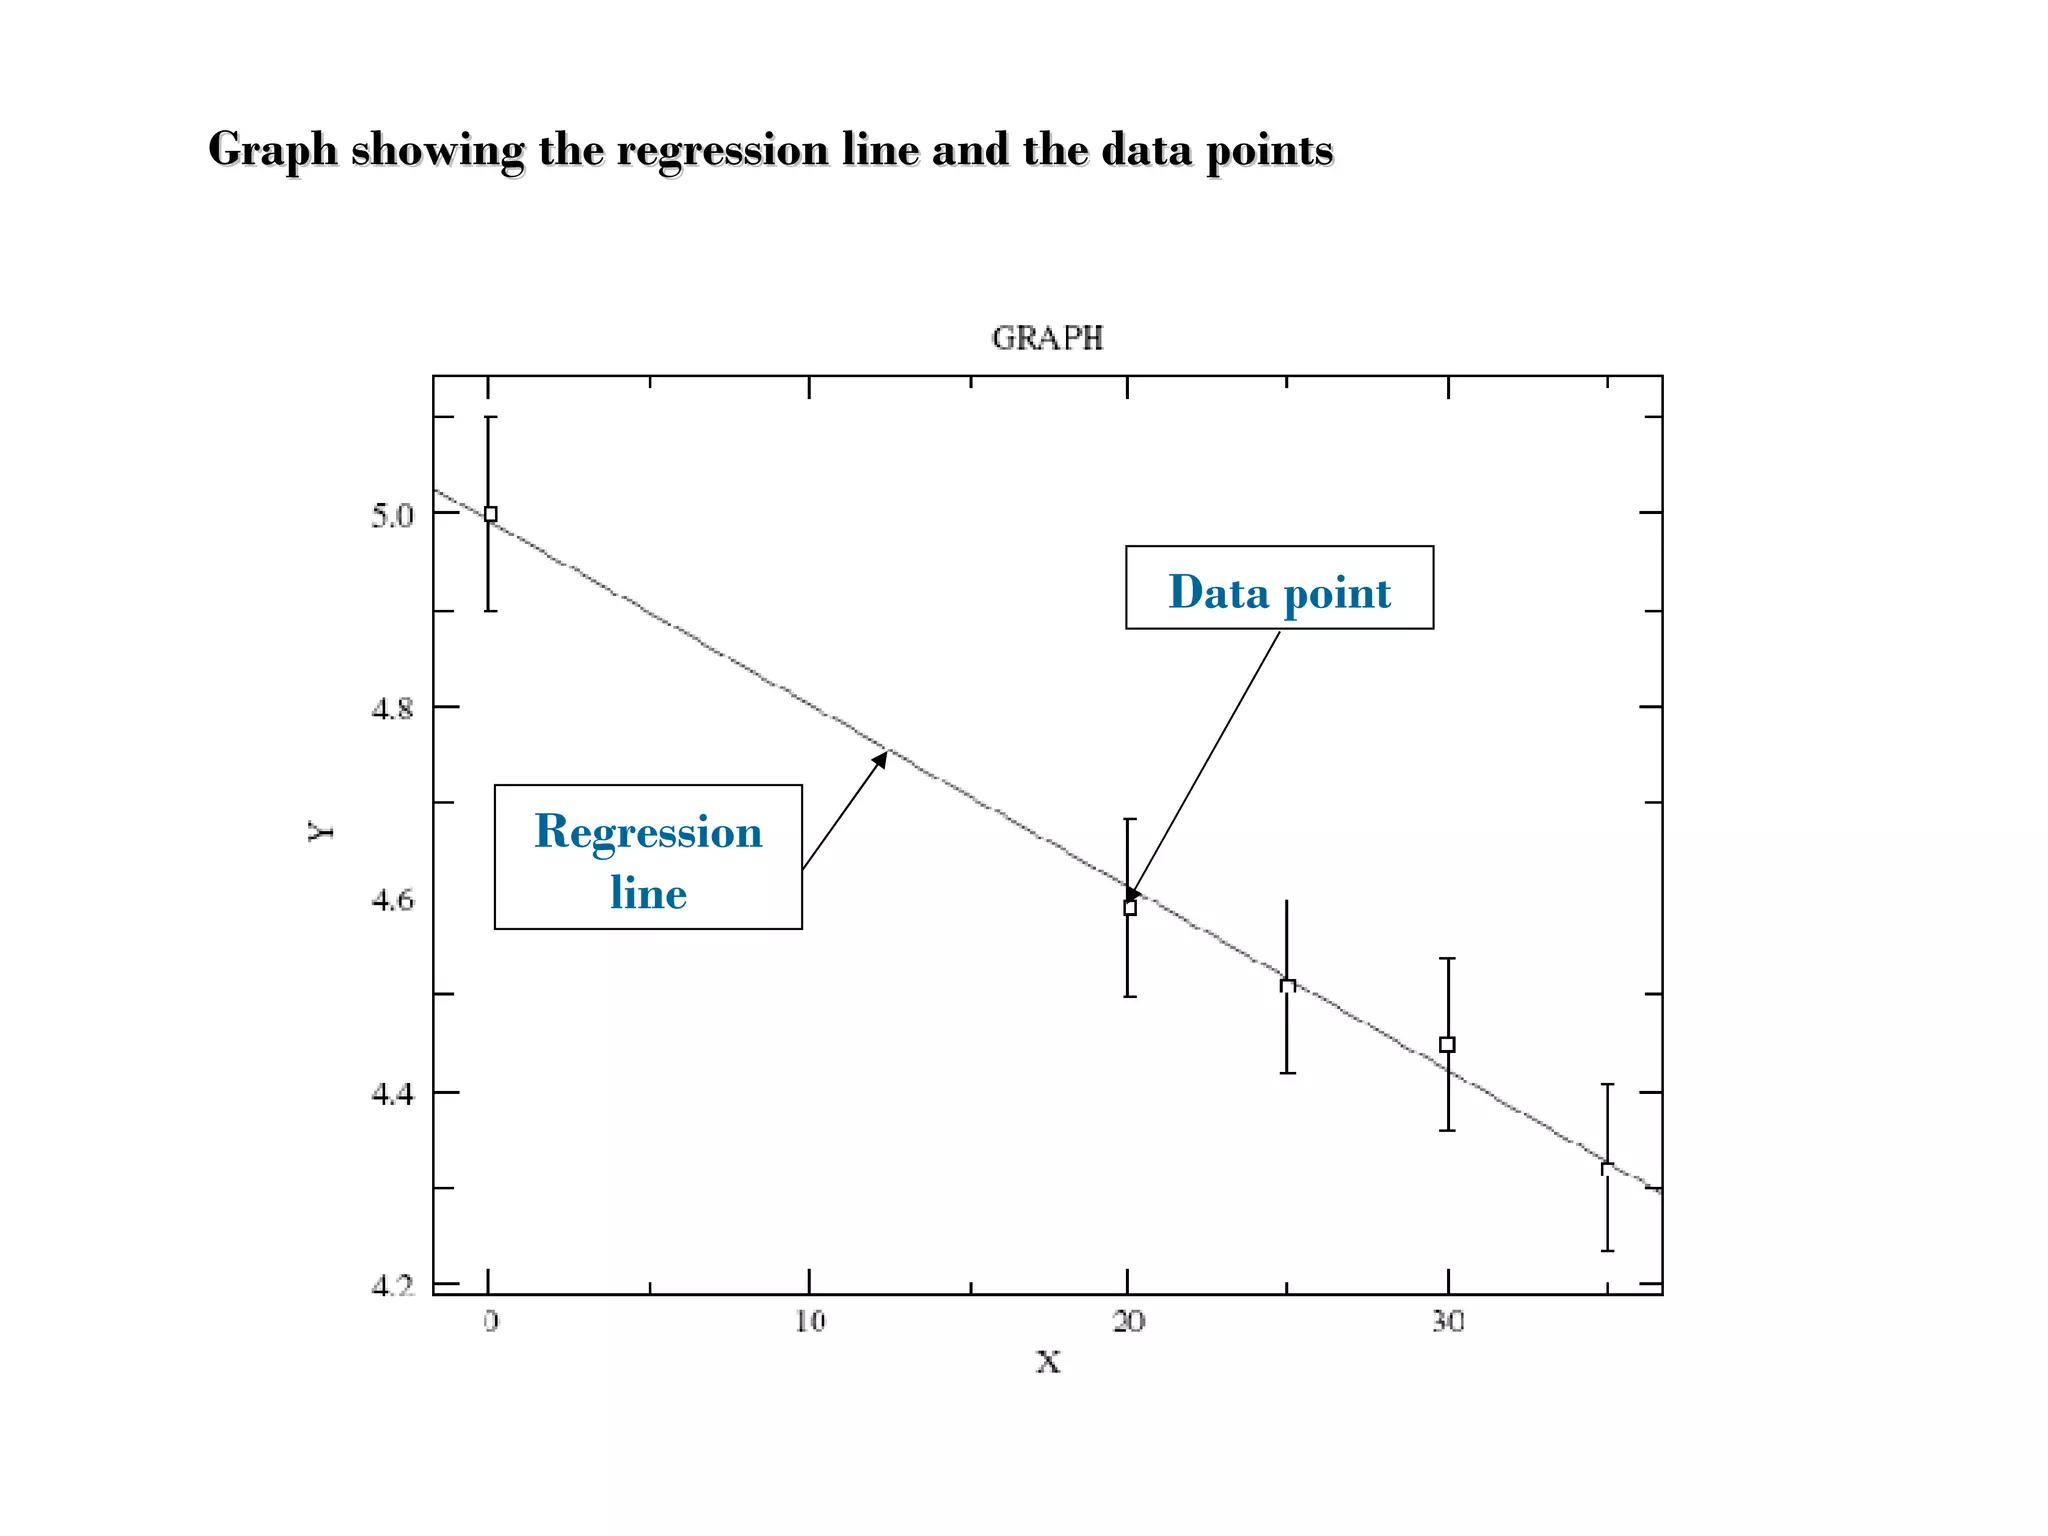
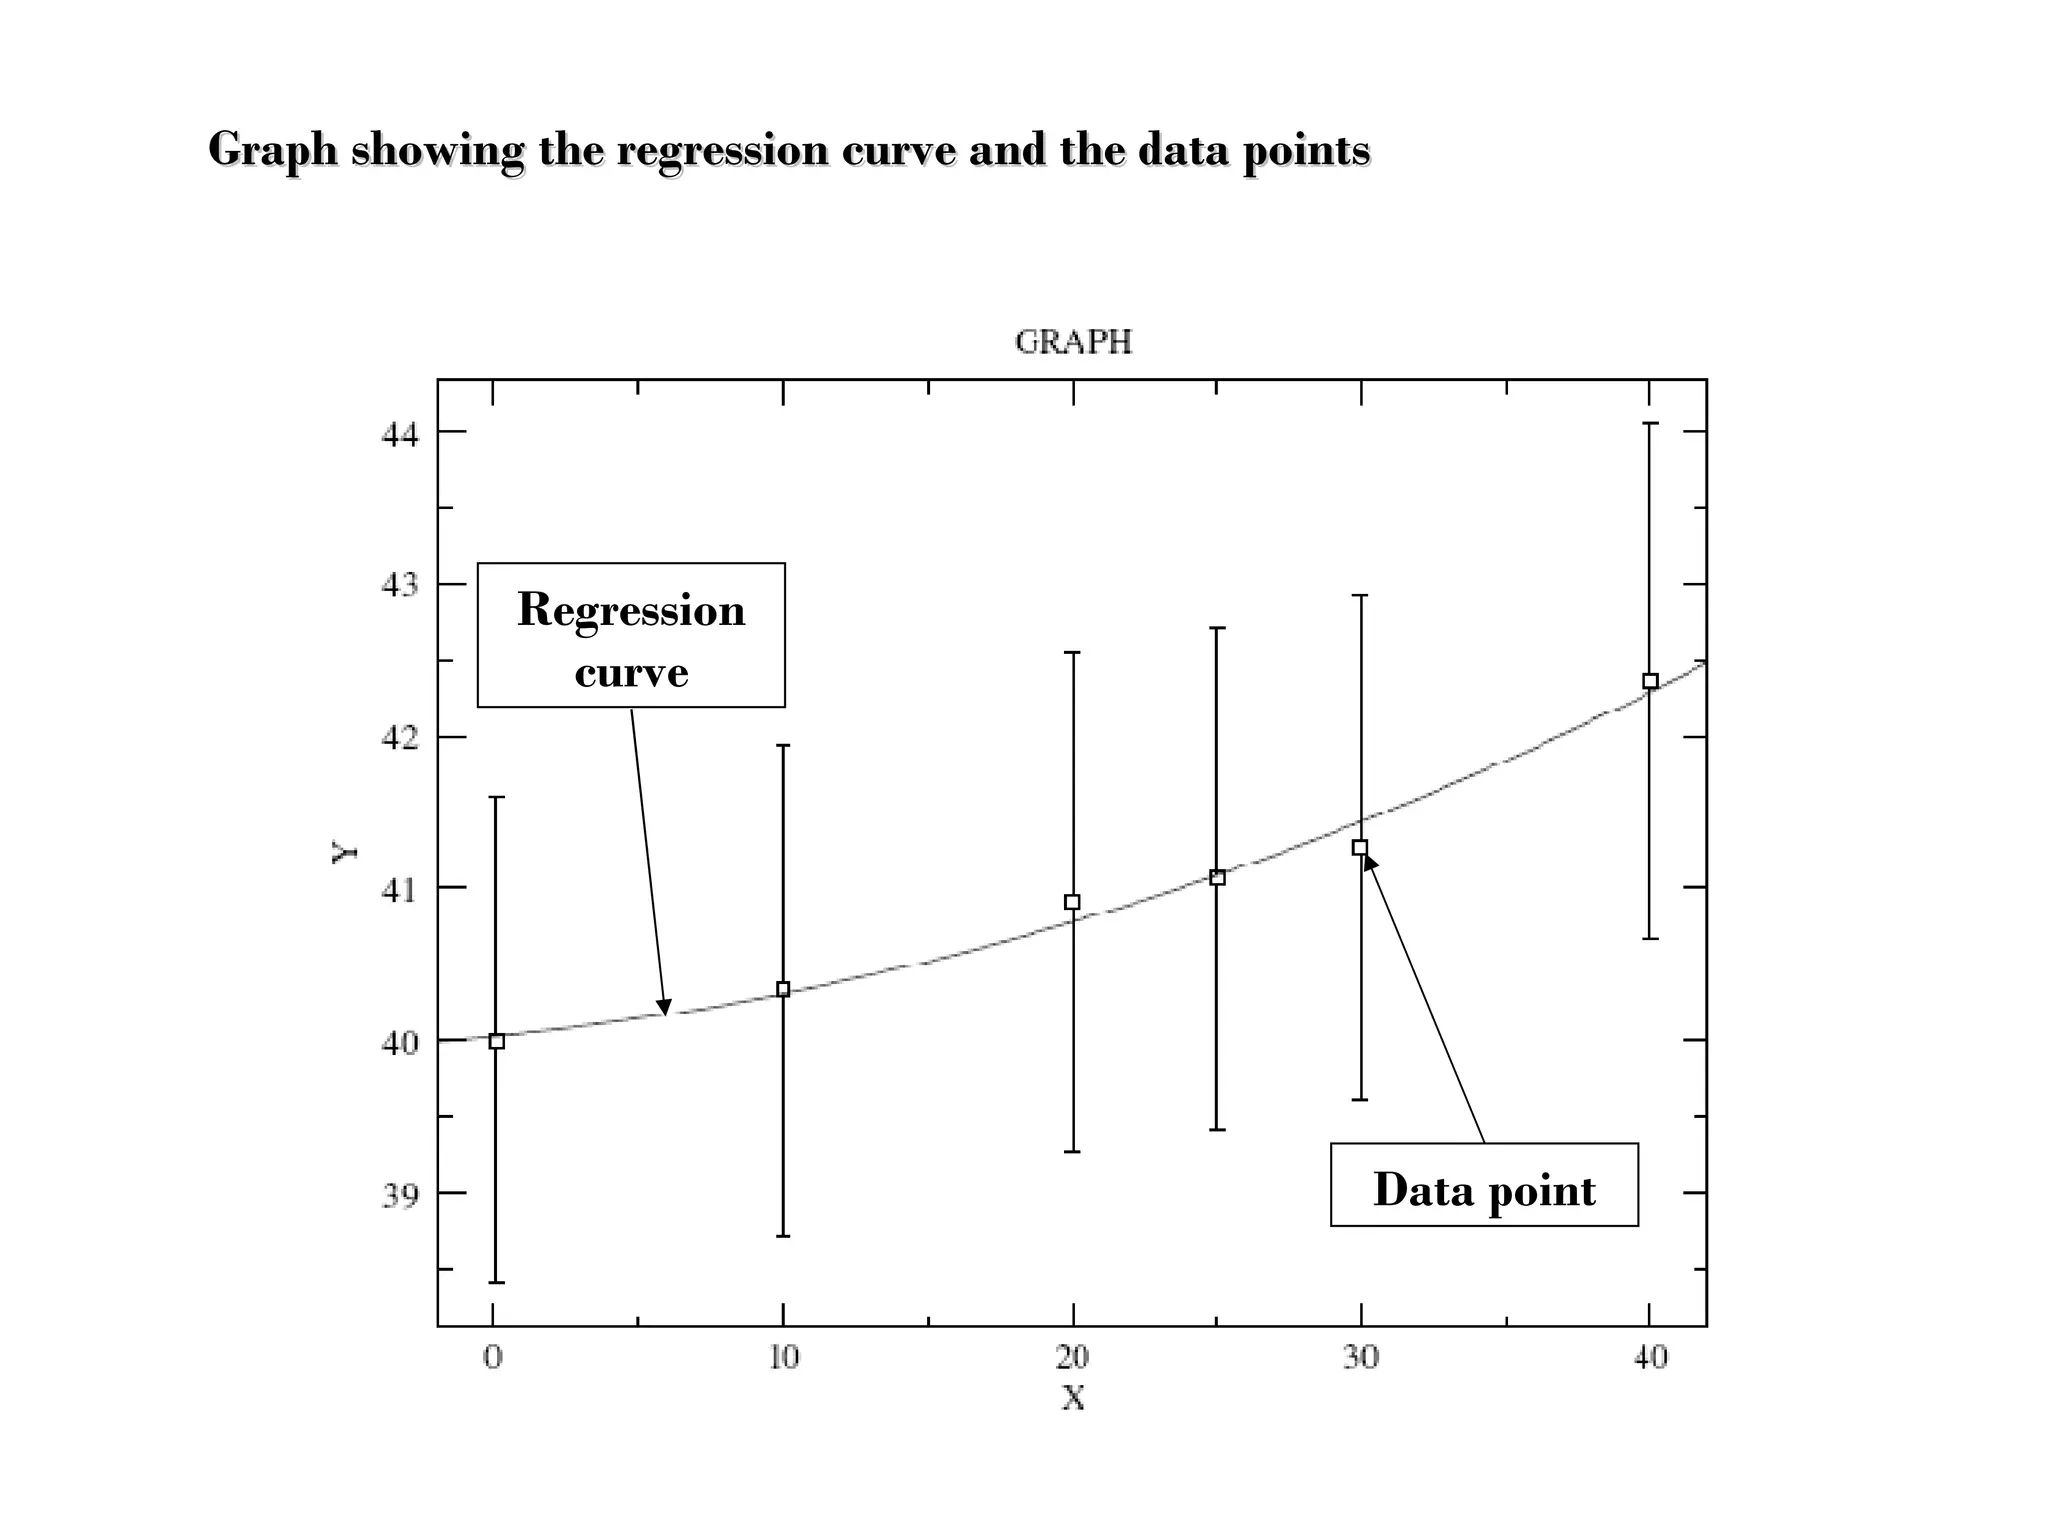
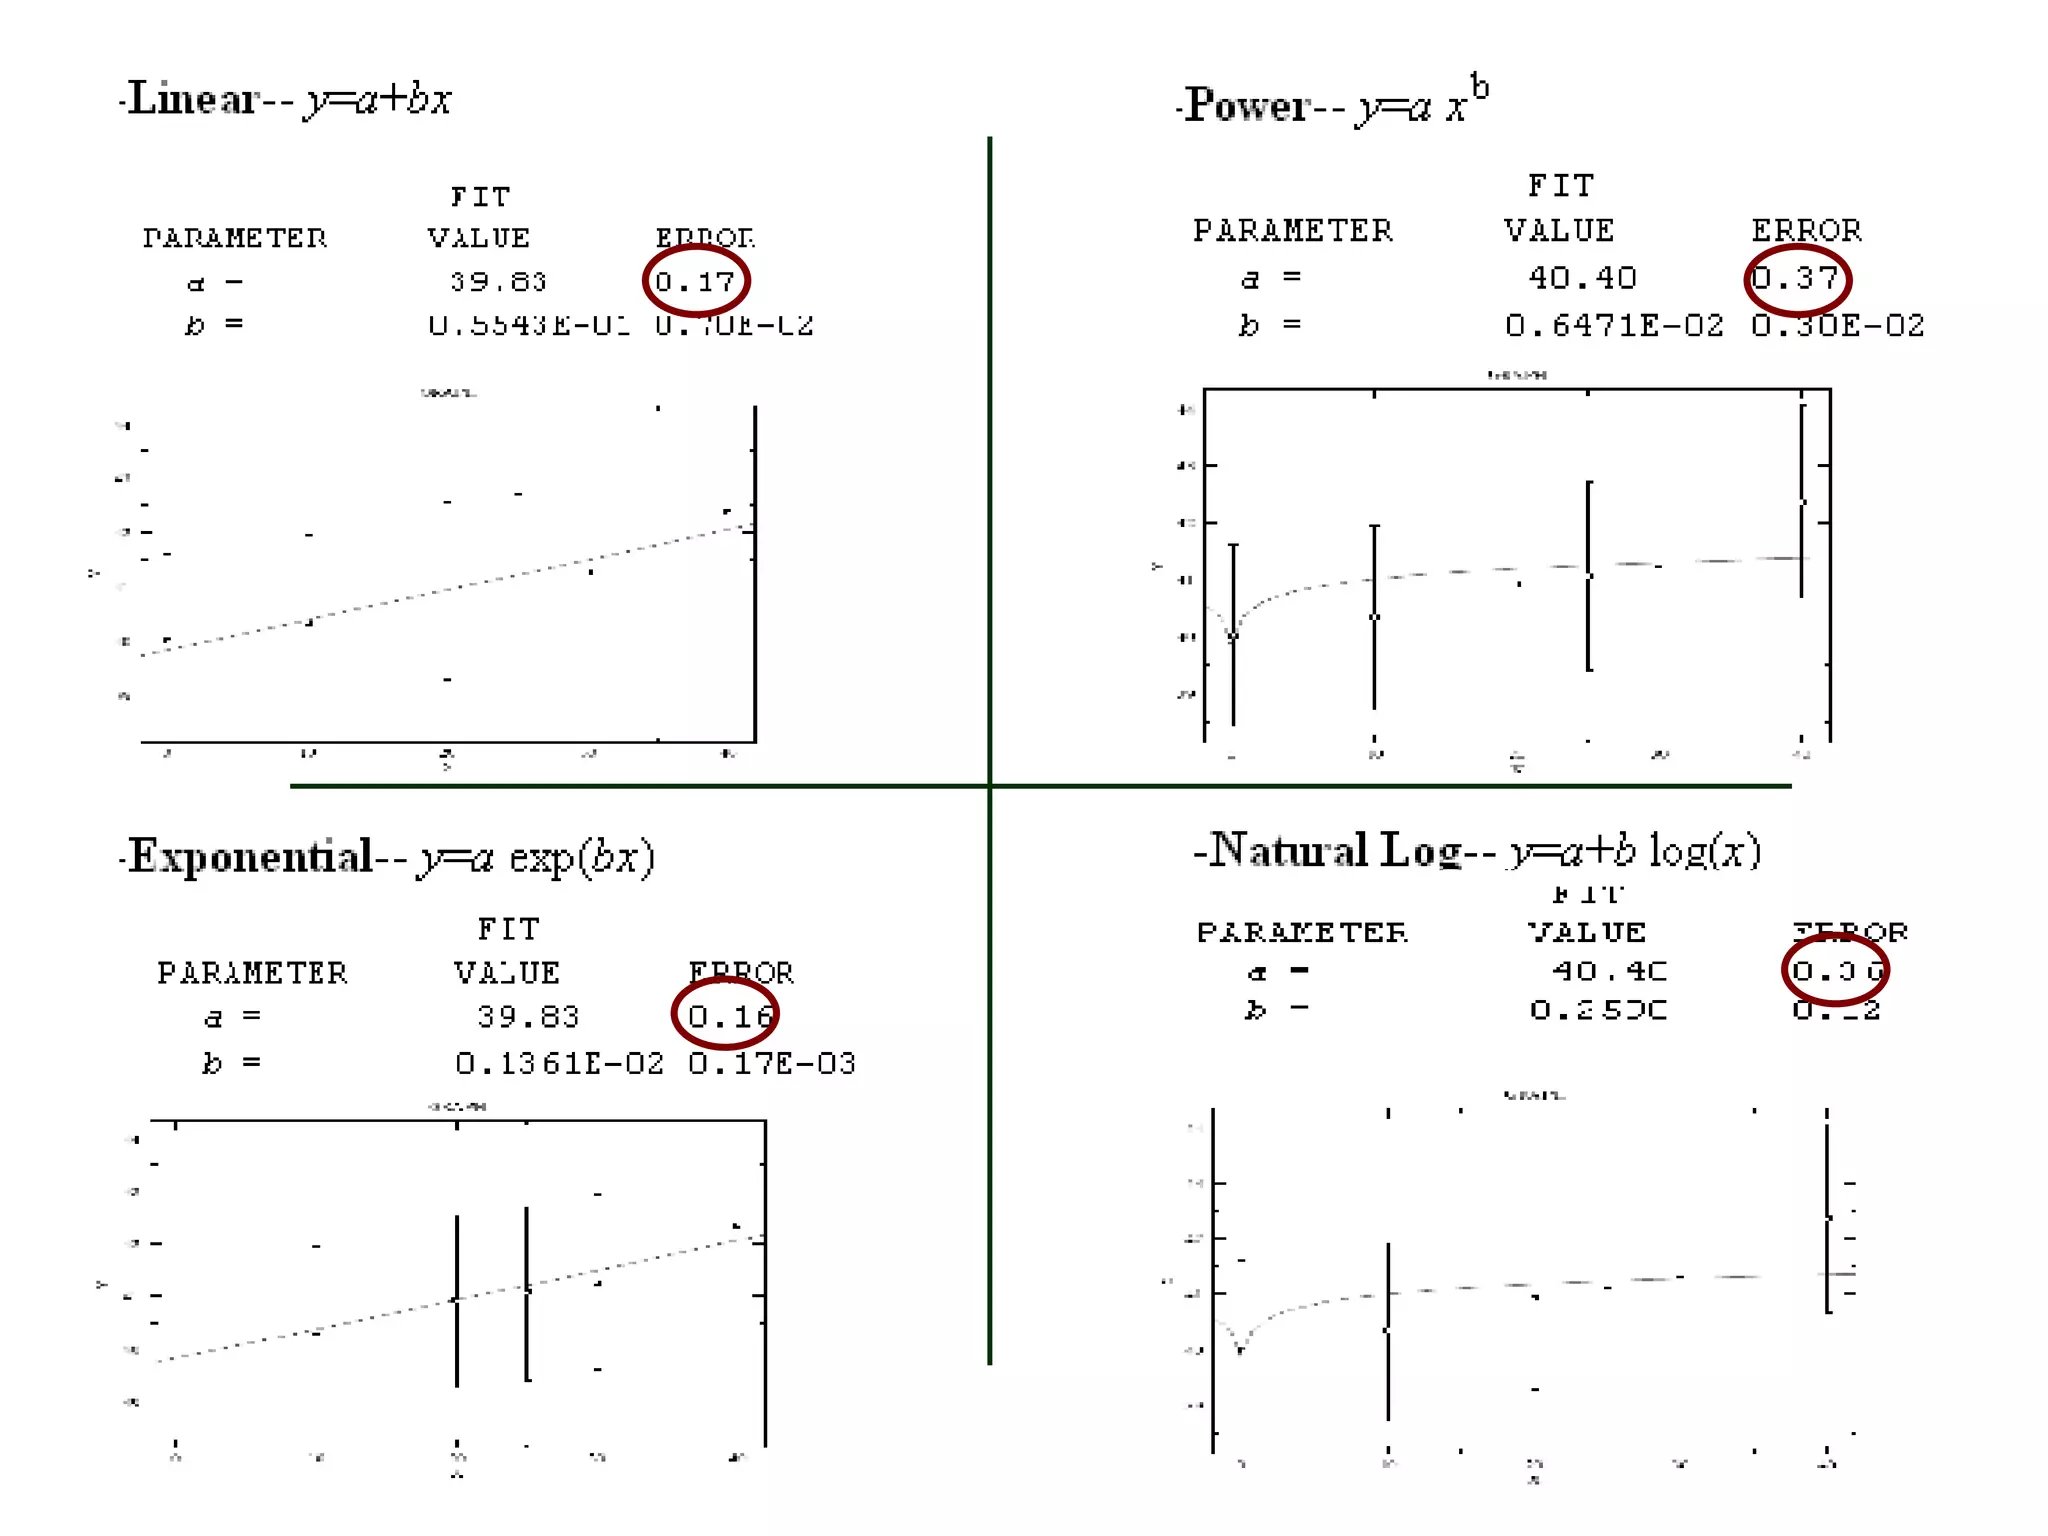
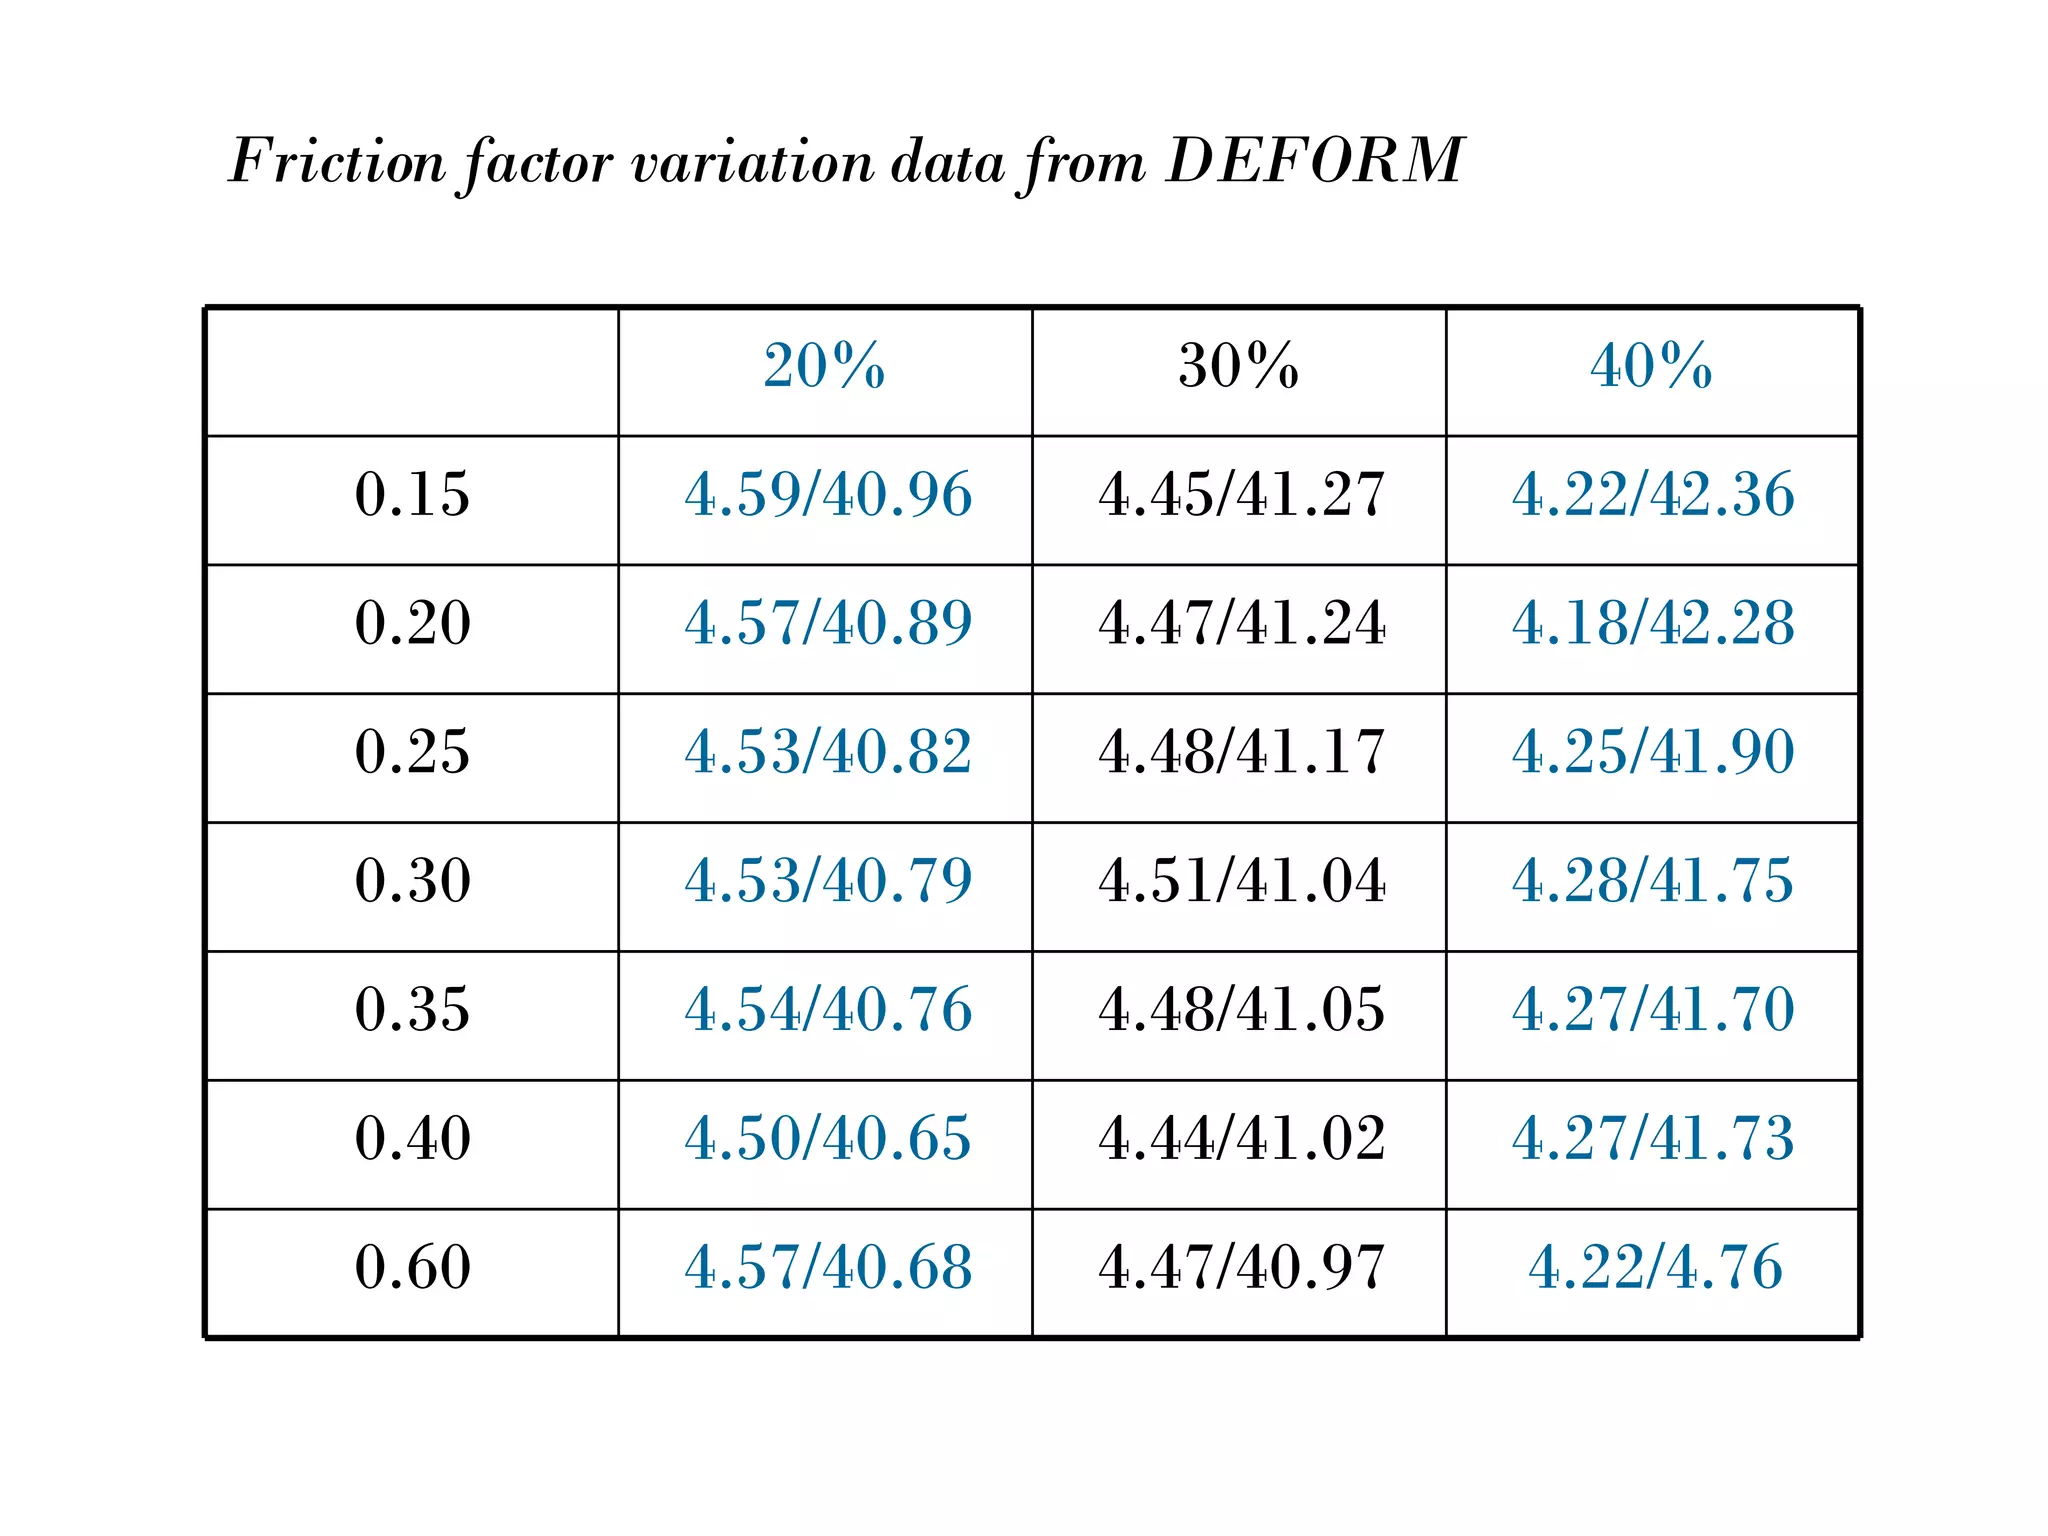
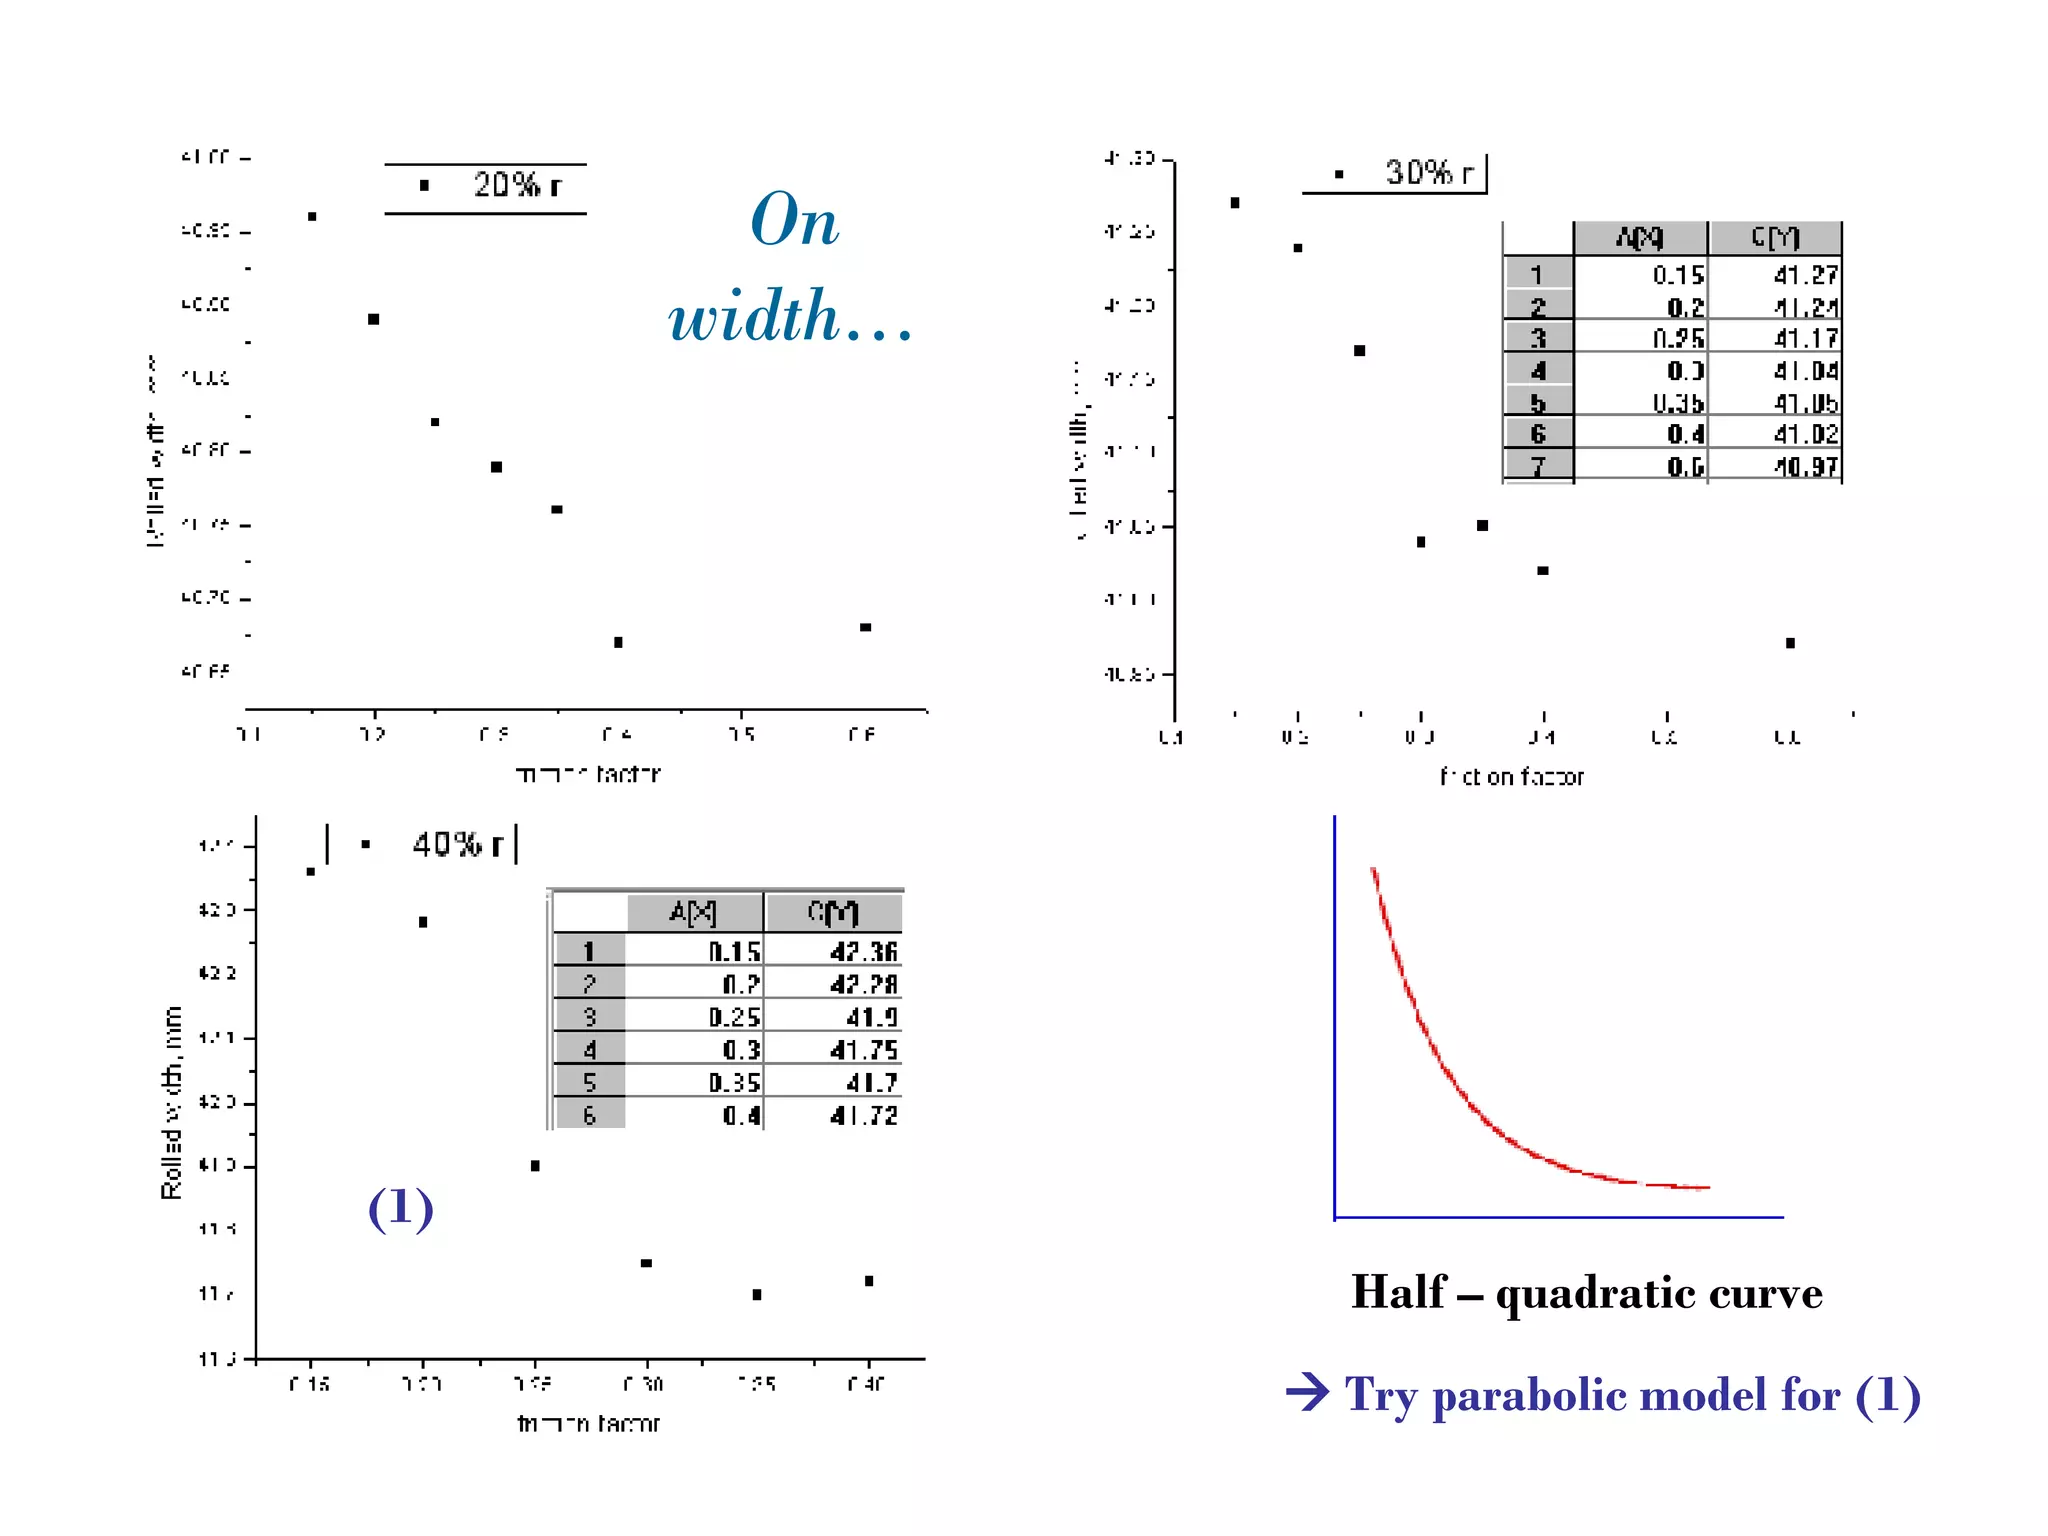
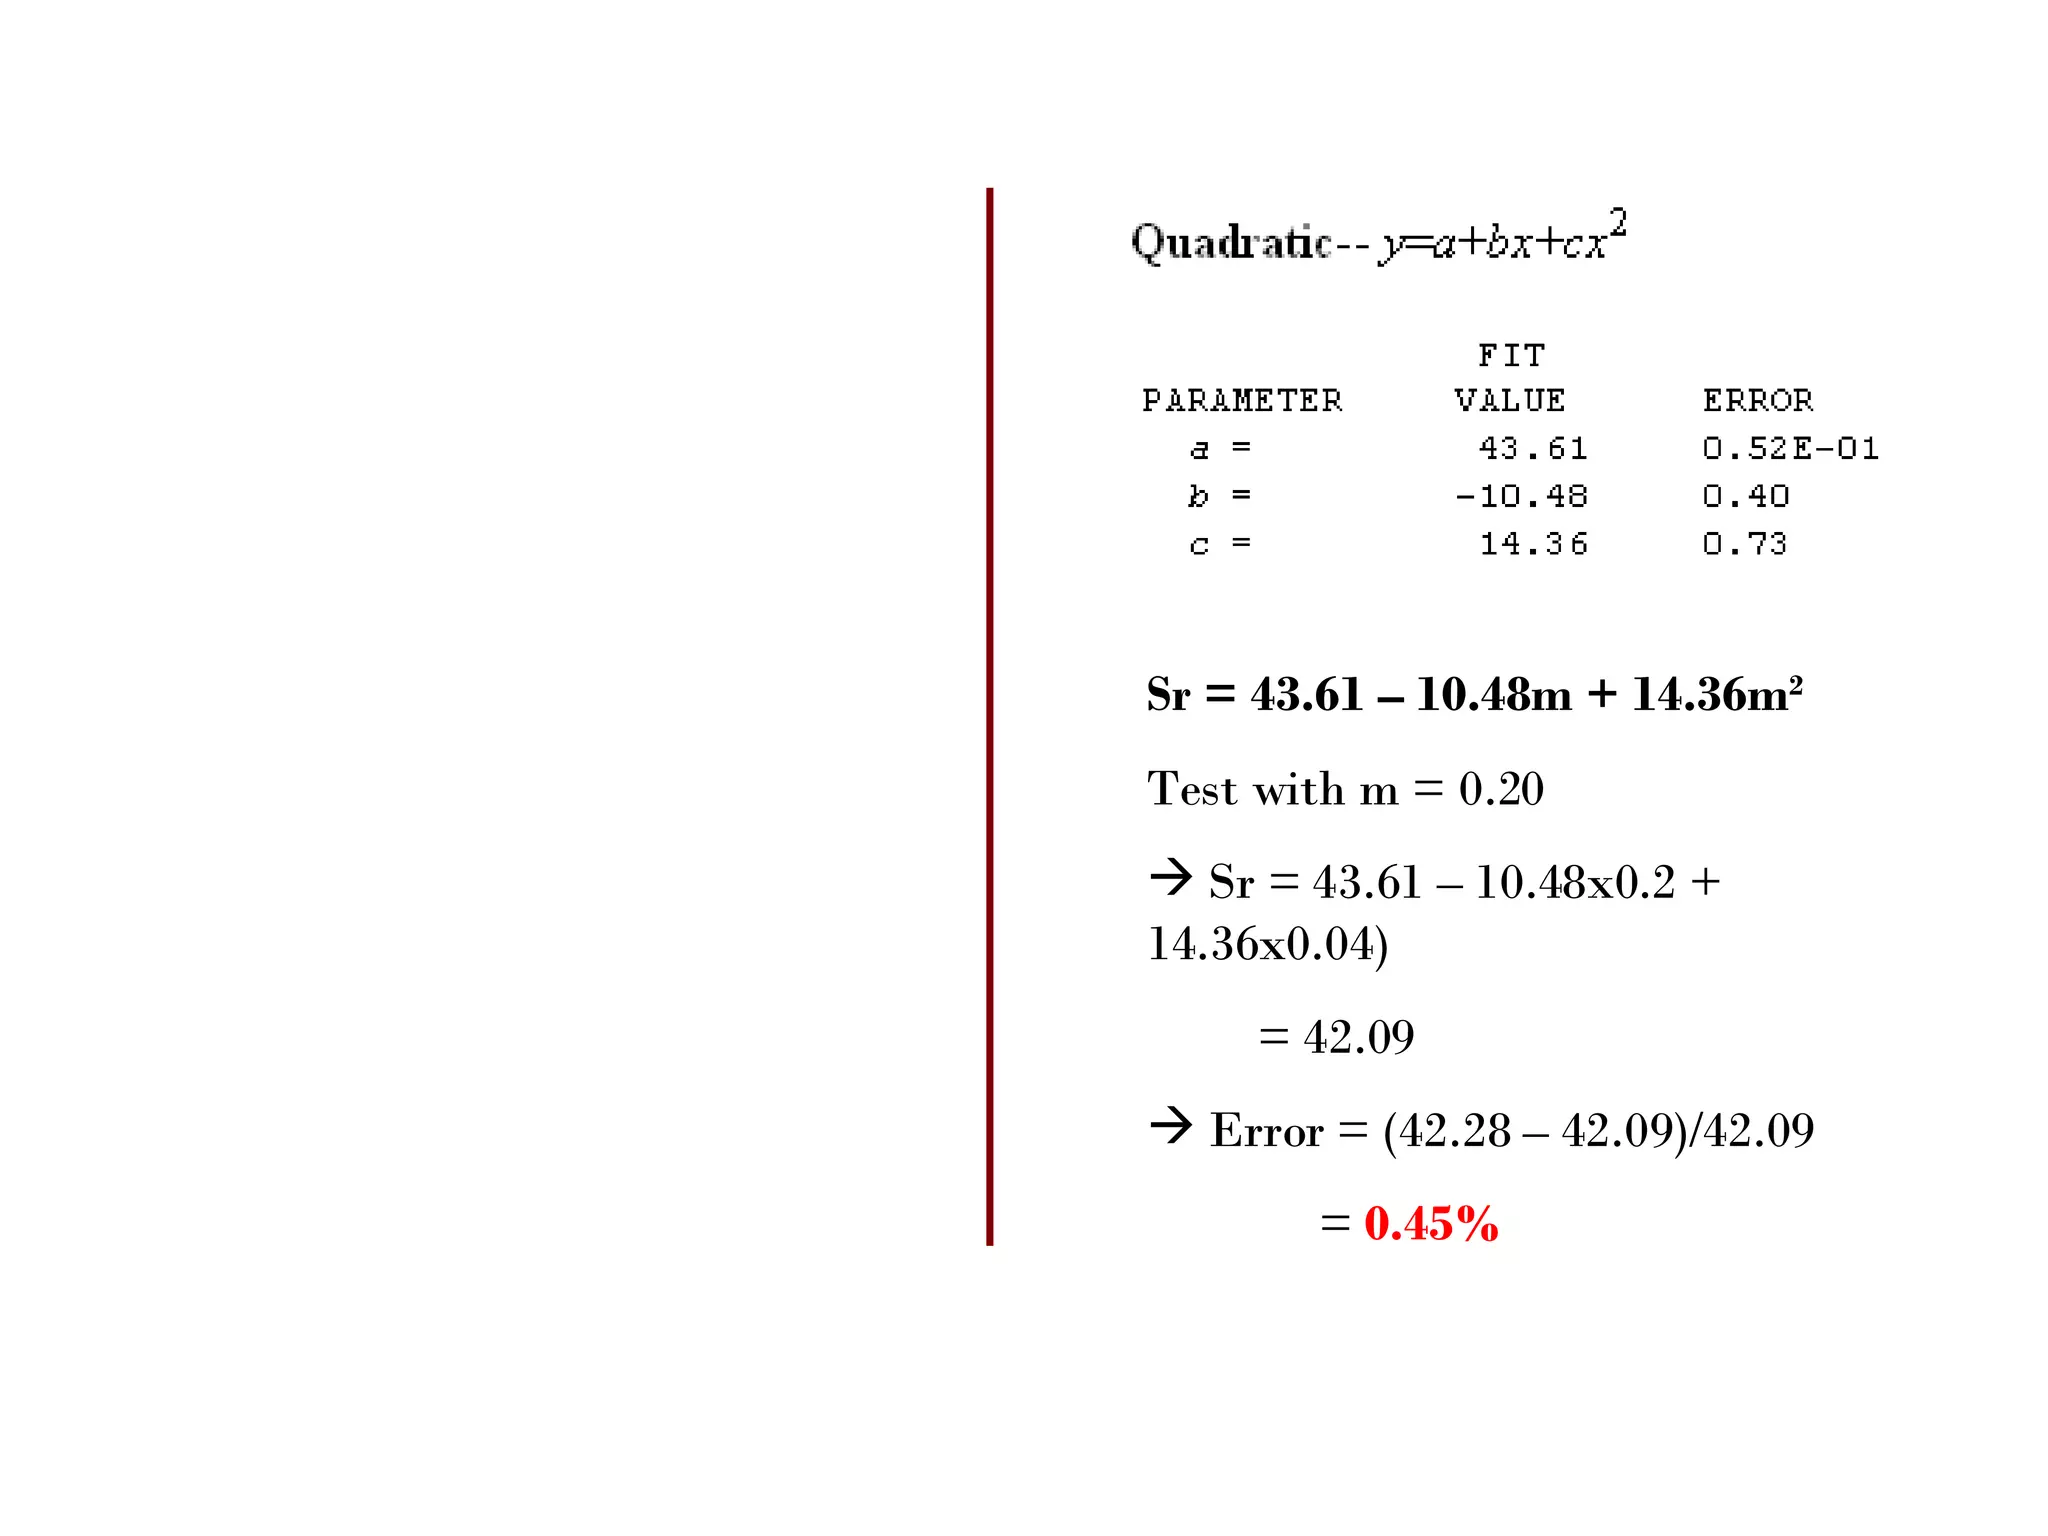
Treating simulation data with mathematical functions using chi-square technique **…formulas achieved by using Chi - square based Java applets on  http://csbsju.edu *…relationship btw outputs ( filling,spread ) and inputs ( thickness red.,friction,…)
Thickness reduction ( r ) variation Rolling model Filling factor = H 1  – t (H 1  = central height)
Fixed condition with: friction 0.15; sample width 40mm, thickness 5mm, groove 10mm and 20 degrees. 0.00 40.00 5.00 0 1.22 42.36 4.22 40 1.07 41.52 4.32 35 0.95 41.27 4.45 30 0.76 41.06 4.51 25 0.59 41.03 4.59 20 0.24 40.33 4.74 10 Filling factor (as drawn) S (mm) spread H r  (mm)  (central) Thickness reduction,%
Other fixed conditions,  relationship btw Hr and r (thickness red.) Drawn with Origin 7.0 from simulation results The central (max) height
Linear model : y = a + bx  ( http://www.physics.csbsju.edu/stats/WAPP.html ) Hr = 4.992 – 0.019r Test with r = 40     Hr = 4.992 – 0.019 x 40 = 4.232 Measured H r (40%) = 4.22 mm    error (relative) = (4.232 – 4.22)/4.22 =  0.28% Test with r = 10     Hr = 4.992 – 0.019 x 10 = 4.80. error = (4.8 – 4.74)/4.74 =  1.25%
Graph showing the regression line and the data points Regression line Data point
Filling factor and thickness reduction
Rolled width vs thickness reduction Plotted with Origin
Quadratic model : y = a + bx + cx 2  ( http://www.physics.csbsju.edu/cgi-bin/stats/WAPP ) Sr = 40.03 + 0.01862r + 0.0009461r 2 Test with r = 35    Sr = 40.03 + 0.01862x35 + 0.0009461x35 2  = 41.84 Measured S r (35%) = 4.1.52 mm    error (relative) = (41.84 – 41.52)/41.52 =  0.77%
Graph showing the regression curve and the data points Regression curve Data point
 
Friction factor ( m ) variation
Friction factor variation data from DEFORM 4.22/4.76 4.47/40.97 4.57/40.68 0.60 4.27/41.73 4.44/41.02 4.50/40.65 0.40 4.27/41.70 4.48/41.05 4.54/40.76 0.35 4.28/41.75 4.51/41.04 4.53/40.79 0.30 4.25/41.90 4.48/41.17 4.53/40.82 0.25 4.18/42.28 4.47/41.24 4.57/40.89 0.20 4.22/42.36 4.45/41.27 4.59/40.96 0.15 40% 30% 20%
Not significant effect on central height
   Try parabolic model for (1) (1) On width… Half – quadratic curve
Sr = 43.61 – 10.48m + 14.36m 2 Test with m = 0.20  Sr = 43.61 – 10.48x0.2 + 14.36x0.04)   = 42.09 Error = (42.28 – 42.09)/42.09 =  0.45%
Quadratic graph
Central height & filling vs thickness reduction  relationship can be treated with  linear function Spreading vs thickness reduction  can be well treated with  quadratic relationship Friction does not affect central height Spread vs friction  can be described by a  quadratic function Upcoming:  thickness, width, vacancy, inclined angle ,… Conclusions
Appendix
Appendix

17

  • 1.
    Treating simulation datawith mathematical functions using chi-square technique **…formulas achieved by using Chi - square based Java applets on http://csbsju.edu *…relationship btw outputs ( filling,spread ) and inputs ( thickness red.,friction,…)
  • 2.
    Thickness reduction (r ) variation Rolling model Filling factor = H 1 – t (H 1 = central height)
  • 3.
    Fixed condition with:friction 0.15; sample width 40mm, thickness 5mm, groove 10mm and 20 degrees. 0.00 40.00 5.00 0 1.22 42.36 4.22 40 1.07 41.52 4.32 35 0.95 41.27 4.45 30 0.76 41.06 4.51 25 0.59 41.03 4.59 20 0.24 40.33 4.74 10 Filling factor (as drawn) S (mm) spread H r (mm) (central) Thickness reduction,%
  • 4.
    Other fixed conditions, relationship btw Hr and r (thickness red.) Drawn with Origin 7.0 from simulation results The central (max) height
  • 5.
    Linear model :y = a + bx ( http://www.physics.csbsju.edu/stats/WAPP.html ) Hr = 4.992 – 0.019r Test with r = 40  Hr = 4.992 – 0.019 x 40 = 4.232 Measured H r (40%) = 4.22 mm  error (relative) = (4.232 – 4.22)/4.22 = 0.28% Test with r = 10  Hr = 4.992 – 0.019 x 10 = 4.80. error = (4.8 – 4.74)/4.74 = 1.25%
  • 6.
    Graph showing theregression line and the data points Regression line Data point
  • 7.
    Filling factor andthickness reduction
  • 8.
    Rolled width vsthickness reduction Plotted with Origin
  • 9.
    Quadratic model :y = a + bx + cx 2 ( http://www.physics.csbsju.edu/cgi-bin/stats/WAPP ) Sr = 40.03 + 0.01862r + 0.0009461r 2 Test with r = 35  Sr = 40.03 + 0.01862x35 + 0.0009461x35 2 = 41.84 Measured S r (35%) = 4.1.52 mm  error (relative) = (41.84 – 41.52)/41.52 = 0.77%
  • 10.
    Graph showing theregression curve and the data points Regression curve Data point
  • 11.
  • 12.
    Friction factor (m ) variation
  • 13.
    Friction factor variationdata from DEFORM 4.22/4.76 4.47/40.97 4.57/40.68 0.60 4.27/41.73 4.44/41.02 4.50/40.65 0.40 4.27/41.70 4.48/41.05 4.54/40.76 0.35 4.28/41.75 4.51/41.04 4.53/40.79 0.30 4.25/41.90 4.48/41.17 4.53/40.82 0.25 4.18/42.28 4.47/41.24 4.57/40.89 0.20 4.22/42.36 4.45/41.27 4.59/40.96 0.15 40% 30% 20%
  • 14.
    Not significant effecton central height
  • 15.
    Try parabolic model for (1) (1) On width… Half – quadratic curve
  • 16.
    Sr = 43.61– 10.48m + 14.36m 2 Test with m = 0.20 Sr = 43.61 – 10.48x0.2 + 14.36x0.04) = 42.09 Error = (42.28 – 42.09)/42.09 = 0.45%
  • 17.
  • 18.
    Central height &filling vs thickness reduction relationship can be treated with linear function Spreading vs thickness reduction can be well treated with quadratic relationship Friction does not affect central height Spread vs friction can be described by a quadratic function Upcoming: thickness, width, vacancy, inclined angle ,… Conclusions
  • 19.
  • 20.