Este documento contiene 11 lecciones sobre las bases para la lectura. La primera unidad cubre conceptos como el significado de las palabras, antónimos, sinónimos y clasificación de palabras. La segunda unidad trata sobre la organización del conocimiento y mapas conceptuales. Las lecciones también cubren temas como la comprensión literal de textos a través de diagramas y ejercicios. El objetivo general es mejorar las habilidades de lectura.
Este documento proporciona información sobre la población y servicios de salud en Zumaia, España. Resume que la población se ha cuadruplicado desde 1900 a casi 10,000 habitantes actualmente, con un aumento reciente de inmigrantes no españoles. El Centro de Salud de Zumaia ofrece servicios de prevención, atención primaria y a domicilio a la población a través de un equipo de médicos, enfermeras y personal administrativo.
Debido a la variedad de transacciones comerciales diarias en una empresa, se pueden cometer errores en los registros contables. Se denominan errores contables a las incorrectas apropiaciones de cuentas y valores durante el proceso de registro. Estos errores pueden ser anulados o minimizados mediante el uso de un sistema informático contable adecuado.
QNBFS Daily Market Report December 24, 2023QNB Group
The QE Index rose 0.8% to close at 10,285.3. Gains were led by the Transportation and Banks & Financial Services indices, gaining 1.4% and 1.2%, respectively.
QNBFS Daily Technical Trader Qatar - October 10, 2023 التحليل الفني اليومي لب...QNB Group
The document provides a daily technical analysis of the QE Index and QATAR INSURANCE CO stock. For the QE Index, it notes the index remains in a downtrend but is approaching a support level of 9,700, where long positions could be taken. It provides expected resistance and support levels. For QATAR INSURANCE CO stock, it notes the stock has not fallen as much as others and the uptrend remains intact above moving averages, though liquidity is low. It provides expected price targets and resistance/support levels for the stock. Definitions of technical analysis terms like candlesticks, support, and simple moving average are also included.
QNBFS Daily Market Report October 04, 2023QNB Group
The QE Index rose 0.2% to close at 10,273.3. Gains were led by the Transportation and Consumer Goods & Services indices, gaining 1.7% and 0.1%, respectively.
QNBFS Daily Technical Trader Qatar - October 04, 2023 التحليل الفني اليومي لب...QNB Group
The General Index failed to sustain its breakout above the double-bottom formation’s neckline and continued with its decline into the formation’s territory.
QNBFS Daily Technical Trader Qatar - September 28, 2023 التحليل الفني اليومي ...QNB Group
The General Index failed to sustain its breakout above the double-bottom formation’s neckline and continued with its decline into the formation’s territory.
QNBFS Daily Market Report September 24, 2023QNB Group
- The QE Index in Qatar rose 0.3% led by gains in the Transportation and Industrials indices. Qatar Navigation and Al Khaleej Takaful Insurance were the top gainers.
- Regional markets were mixed with Saudi Arabia down 1% but Abu Dhabi up marginally. Economic data from the US and Europe was mixed.
- In Qatar news, QR500mn in bills were sold at a yield of 5.755% and Gulf International Services approved final merger agreements. Ooredoo also signed an MoU to support businesses in Qatar free zones.
QNBFS Daily Technical Trader Qatar - September 24, 2023 التحليل الفني اليومي ...QNB Group
The General Index failed to sustain its breakout above the double-bottom formation’s neckline and continued with its decline into the formation’s territory.
QNBFS Daily Technical Trader Qatar - September 19, 2023 التحليل الفني اليومي ...QNB Group
The General Index failed to sustain its breakout above the double-bottom formation’s neckline and continued with its decline into the formation’s territory.
QNBFS Daily Market Report September 17, 2023QNB Group
The QE Index declined 0.5% to close at 10,319.3. Losses were led by the Industrials and Consumer Goods & Services indices, falling 1.4% and 1.1%, respectively.
QNBFS Daily Technical Trader Qatar - September 07, 2023 التحليل الفني اليومي ...QNB Group
The General Index failed to
sustain its breakout above the
double-bottom formation’s
neckline and continued with
its decline into the
formation’s territory.
QNBFS Daily Technical Trader Qatar - September 06, 2023 التحليل الفني اليومي ...QNB Group
The General Index failed to sustain its breakout above the double-bottom formation’s neckline and continued with its decline into the formation’s territory.
STREETONOMICS: Exploring the Uncharted Territories of Informal Markets throug...sameer shah
Delve into the world of STREETONOMICS, where a team of 7 enthusiasts embarks on a journey to understand unorganized markets. By engaging with a coffee street vendor and crafting questionnaires, this project uncovers valuable insights into consumer behavior and market dynamics in informal settings."
The Impact of Generative AI and 4th Industrial RevolutionPaolo Maresca
This infographic explores the transformative power of Generative AI, a key driver of the 4th Industrial Revolution. Discover how Generative AI is revolutionizing industries, accelerating innovation, and shaping the future of work.
An accounting information system (AIS) refers to tools and systems designed for the collection and display of accounting information so accountants and executives can make informed decisions.
New Visa Rules for Tourists and Students in Thailand | Amit Kakkar Easy VisaAmit Kakkar
Discover essential details about Thailand's recent visa policy changes, tailored for tourists and students. Amit Kakkar Easy Visa provides a comprehensive overview of new requirements, application processes, and tips to ensure a smooth transition for all travelers.
Every business, big or small, deals with outgoing payments. Whether it’s to suppliers for inventory, to employees for salaries, or to vendors for services rendered, keeping track of these expenses is crucial. This is where payment vouchers come in – the unsung heroes of the accounting world.
Optimizing Net Interest Margin (NIM) in the Financial Sector (With Examples).pdfshruti1menon2
NIM is calculated as the difference between interest income earned and interest expenses paid, divided by interest-earning assets.
Importance: NIM serves as a critical measure of a financial institution's profitability and operational efficiency. It reflects how effectively the institution is utilizing its interest-earning assets to generate income while managing interest costs.
[4:55 p.m.] Bryan Oates
OJPs are becoming a critical resource for policy-makers and researchers who study the labour market. LMIC continues to work with Vicinity Jobs’ data on OJPs, which can be explored in our Canadian Job Trends Dashboard. Valuable insights have been gained through our analysis of OJP data, including LMIC research lead
Suzanne Spiteri’s recent report on improving the quality and accessibility of job postings to reduce employment barriers for neurodivergent people.
Decoding job postings: Improving accessibility for neurodivergent job seekers
Improving the quality and accessibility of job postings is one way to reduce employment barriers for neurodivergent people.
Enhancing Asset Quality: Strategies for Financial Institutionsshruti1menon2
Ensuring robust asset quality is not just a mere aspect but a critical cornerstone for the stability and success of financial institutions worldwide. It serves as the bedrock upon which profitability is built and investor confidence is sustained. Therefore, in this presentation, we delve into a comprehensive exploration of strategies that can aid financial institutions in achieving and maintaining superior asset quality.
Enhancing Asset Quality: Strategies for Financial Institutions
13 November Daily Technical Trader
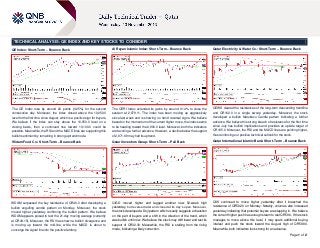
1. TECHNICAL ANALYSIS: QE INDEX AND KEY STOCKS TO CONSIDER
QE Index: Short-Term – Bounce Back
Al Rayan Islamic Index: Short-Term – Bounce Back
Qatar Electricity & Water Co.: Short-Term – Bounce Back
The QE Index rose by around 26 points (0.25%) for the second
consecutive day. Moreover, the index closed above the 10,050.0
level for the first time since August, which is a positive sign for buyers.
We believe if the index can stay above the 10,050.0 level on a
closing basis, then a continued rise toward 10,100.0 could be
possible. Meanwhile, the RSI and the MACD lines are supporting this
bullish sentiment by remaining in strong uptrend mode.
The QERI Index extended its gains by around 0.14% to close the
session at 2,879.11. The index has been moving up aggressively
since last week and is showing no trend reversal signs. We believe
based on the momentum of the current higher move, the index seems
to be heading toward the 2,900.0 level. Moreover, both the indicators
are favoring a further advance. However, a decline below the support
of 2,871.69 may halt its uptrend.
QEWS cleared the resistances of the long-term descending trendline
and QR162.0 in a single swoop yesterday. Moreover, the stock
developed a bullish Marubozu Candle pattern indicating a further
advance. We believe this strong breach of resistance for the first time
since July has bullish implications and provides an upside target of
QR165.0. Moreover, the RSI and the MACD lines are pointing higher,
thus reinforcing our positive technical outlook for the stock.
Widam Food Co.: Short-Term – Bounce Back
Qatari Investors Group: Short-Term – Pull Back
Qatar International Islamic Bank: Short-Term – Bounce Back
WDAM surpassed the key resistance of QR48.0 after developing a
bullish engulfing candle pattern on Monday. Moreover, the stock
moved higher yesterday confirming the bullish pattern. We believe
WDAM appears poised to test the 21-day moving average (currently
at QR49.15). Moreover, the RSI has shown a bullish divergence and
is moving up toward the mid-line, while the MACD is about to
converge the signal line into the positive territory.
QIGD moved higher and tagged another new 52-week high
yesterday, but reversed later and closed at its day’s open. Moreover,
the stock developed a Doji pattern which usually suggests exhaustion
on the part of buyers and a shift in the direction of the trend, which
was bullish until now. We believe the stock may drift lower and test its
support of QR32.30. Meanwhile, the RSI is stalling from the rising
mode, indicating a likely correction.
QIIK continued to move higher yesterday after it breached the
resistance of QR58.20 on Monday. Notably, volumes also increased
yesterday indicating that potential buyers are stepping in. We believe
the current higher push has enough steam to test QR59.0. If the stock
manages to move above this level, it may spark additional buying
interest and push the stock toward the August high of QR59.80.
Meanwhile, both indicators look strong for an advance.
Page 1 of 2
2. Name (Ticker)
Last Close
Trend
Short Term
Support
Long Term
First
Resistance
Second
First
Second
Qatar Exchange Index (QE Index)
10,072.05
UP
UP
9,800.00
9,700.00
10,200.00
10,350.00
Al Rayan Islamic Index (QERI Index)
2,879.11
UP
UP
2,700.00
2,600.00
2,950.00
3,000.00
Masraf Al Rayan (MARK QD)
31.05
UP
UP
24.00
23.20
31.40
33.00
Commercial Bank of Qatar (CBQK QD)
69.00
UP
UP
63.90
62.40
84.20
87.20
Doha Bank (DHBK QD)
56.50
UP
UP
42.00
39.50
57.14
58.00
Qatar Islamic Bank (QIBK QD)
68.30
UP
DOWN
65.00
64.30
78.50
79.60
Qatar International Islamic Bank (QIIK QD)*
58.50
UP
UP
47.90
45.00
60.80
61.50
Qatar Insurance (QATI QD)
65.20
UP
UP
58.50
57.00
66.30
67.15
National Leasing Holding Co. (NLCS QD)
30.70
DOWN
DOWN
29.15
28.75
43.90
45.00
Widam Food Co. (WDAM QD)*
48.10
DOWN
DOWN
47.50
46.70
69.10
78.50
Al Meera Consumer Goods Co. (MERS)
134.00
DOWN
FLAT
129.90
128.50
138.50
140.15
Industries Qatar (IQCD QD)
163.30
UP
UP
144.10
142.00
175.20
176.80
Qatar Electricity & Water Co. (QEWS QD)*
163.00
UP
UP
140.00
132.10
172.00
174.00
Gulf International Services (GISS QD)
58.50
UP
UP
30.50
29.50
60.15
61.25
Qatari Investors Group (QIGD QD)*
32.65
UP
UP
20.36
20.00
33.60
34.75
Barwa Real Estate Co. (BRES QD)
27.35
UP
UP
22.80
19.50
29.25
29.90
United Development Co. (UDCD QD)
22.85
UP
UP
17.06
16.00
25.30
25.90
137.50
DOWN
DOWN
108.00
98.10
146.00
148.00
9.62
UP
UP
8.50
8.24
9.98
10.20
Nakilat (QGTS QD)
19.58
UP
UP
15.08
14.52
21.15
21.70
Milaha (QNNS QD)
88.40
UP
UP
58.20
56.70
89.70
90.25
Banks and Financial Services
Consumer Goods and Services
Consumer G
Industrials
Industrials
Real Estate
Real Estate
Telecom
Ooredoo (ORDS QD)
Vodafone Qatar (VFQS QD)
Telecom
Transportation
Transportat
*These stocks are today’s suggested ideas
Overall Methodology: The charts and descriptions on Page 1 provide an indicative view of the future direction of the equities mentioned. The table on page 2 has been provided to denote historical movements in certain stocks. The historical trend analysis uses 21- and 55day SMAs for indicating short-term and long-term trends, respectively. Based on these SMAs, the historical direction of the trend is denoted as UP, DOWN or FLAT.
Selection of Key Stocks of the Day: Key stocks’ selection is based on our analysis of 19 members of the QE Index (excludes QNBK QD). Analysis includes identifying trends (short-term as well as long-term), patterns and support/resistance levels.
Trend Direction: The methods used to determine trend direction are subjective in nature. We use 21-day SMA and 55-day SMA, absolute price movements, price movements relative to SMAs and accurately drawn trend lines and chart patterns to determine the short- and
long-term trends.
Investment Horizon: The definition of short term and long term depends upon investors’ preferences and their investment objectives. As a rule of thumb, the time horizon for traders/short-term trend is 1-3 weeks while it is 1-3 months for investors/long-term trend.
Combining Technical and Fundamental Analysis: Investors can combine technical analysis (TA) with fundamental analysis (FA) to maximize their investment returns. While the “True Value” of stocks could be estimated by FA, the entry and exit timings could be fine
tuned using technical analysis to benefit from short-term movements in stock prices.
Trading Tactics: The trend direction should be analyzed based on the time-horizon of your investments. In general, investors attempt selling close to resistance levels during a downtrend and attempt buying close to support levels during uptrend.
Definitions:
1>
Simple Moving Average (SMA): A SMA is the average of the closing price of a security for a given period.
2>
RSI (Relative Strength Index): A technical momentum indicator that ranges from 0 to 100 and compares the stock’s recent price movements by evaluating recent gains and losses. Stocks with RSI above 70 could be considered overbought and below 30 could be
considered oversold. If the RSI falls below 70, it is a bearish signal. On the other hand, if the RSI rises above 30 it is considered bullish. We use a RSI of 14 days.
3>
MACD (Moving Average Convergence Divergence): MACD denotes the relationship between two moving averages, which is used to spot changes in strength, direction, momentum and duration of a stock price trend. The MACD is calculated by subtracting the 26-day
exponential moving average (EMA) from the 12-day EMA. A nine-day EMA of the MACD, called the signal line, is also plotted on top of the MACD, functioning as a trigger for buy/sell signals. The MACD line above the signal line provides a positive signal and vice versa.
Contacts
Saugata Sarkar
Ahmed M. Shehada
Keith Whitney
Sahbi Kasraoui
QNB Financial Services SPC
Head of Research
Tel: (+974) 4476 6534
saugata.sarkar@qnbfs.com.qa
Head of Trading
Tel: (+974) 4476 6535
ahmed.shehada@qnbfs.com.qa
Head of Sales
Tel: (+974) 4476 6533
keith.whitney@qnbfs.com.qa
Manager - HNWI
Tel: (+974) 4476 6544
sahbi.alkasraoui@qnbfs.com.qa
Contact Center: (+974) 4476 6666
PO Box 24025
Doha, Qatar
DISCLAIMER: This publication has been prepared by QNB Financial Services SPC (“QNBFS”) a wholly-owned subsidiary of Qatar National Bank (“QNB”). QNBFS is regulated by the Qatar Financial Markets Authority and the Qatar Exchange; QNB is
regulated by the Qatar Central Bank. This publication expresses the views and opinions of QNBFS at a given time only. It is not an offer, promotion or recommendation to buy or sell securities or other investments, nor is it intended to constitute legal,
tax, accounting, or financial advice. We therefore strongly advise potential investors to seek independent professional advice before making any investment decision. Although the information in this report has been obtained from sources that QNBFS
believes to be reliable, we have not independently verified such information and it may not be accurate or complete. While this publication has been prepared with the utmost degree of care by our analysts, QNBFS does not make any representations or
warranties as to the accuracy and completeness of the information it may contain, and declines any liability in that respect. QNBFS reserves the right to amend the views and opinions expressed in this publication at any time. It may also express
viewpoints or make investment decisions that differ significantly from, or even contradict, the views and opinions included in this report.
COPYRIGHT: No part of this document may be reproduced without the explicit written permission of QNBFS.
Page 2 of 2