SlideShare a Scribd company logo
1 of 80
13
Energy Efficiency Initiatives for Saudi Arabia
on Supply and Demand Sides
Y. Alyousef1* and M. Abu-ebid2
1Energy Research Institute, King Abdulaziz City
for Science and Technology, Riyadh,
2AEA Technology plc, Didcot,
1Saudi Arabia
2United Kingdom
1. Introduction
The Kingdom of Saudi Arabia (KSA) is blessed with an
abundance of energy resources. It
has the world’s largest proven oil reserves, the world’s fourth
largest proven gas reserves,
has abundant wind and solar renewable energy resources, and is
the world’s 20th largest
producer and consumer of electricity. Saudi Arabia makes
negligible use of its renewable
energy resources and almost all its electricity is produced from
the combustion of fossil
fuels. Despite attempts to diversify the economy, the oil and gas
industry still accounts for
approximately 75% of budget revenues, 45% of GDP, and 90%
of export earnings.
Exploitation of the natural resources has allowed the Saudi
government to keep energy
prices low through a system of direct and indirect subsidies.
The nation has benefited
greatly from these policies, but together with increased
prosperity and sophistication, a
culture of wasteful energy usage has become established.
KSA is experienced rapid economic growth over recent years.
Since 2000, the energy
consumption per capita has increased by more than 30%. This
increase in primary energy
consumption has occurred during a period of declining oil
exports. In 2008, the total
primary energy consumption has approximately reached 800
million barrels of oil
equivalent (BOE), of which more than 60% was oil. The
consumption of primary energy
within the Kingdom is expected to double in 2030 leading to
diminishing oil exports based
on current trends (Ministry of Water and Electricity, 2009).
There is widespread recognition within KSA that with growing
internal demand for
primary energy there will be a declining proportion of oil for
export. Consequently, the
national government has identified energy efficiency as a key
national priority, reflecting the
rapid increase in domestic consumption of petroleum products,
related GHG emissions and
the associated opportunity cost of lost export revenues. There is
also a strategic national
push to develop an energy efficiency and renewable technology
R&D and manufacturing
base in an attempt to diversify the economy away from fossil
fuels.
*Corresponding Author
www.intechopen.com
Energy Efficiency – A Bridge to Low Carbon Economy
280
2. Fossil fuel production and consumption
2.1 Oil production and consumption
Saudi Arabia is the largest producer and net exporter of oil in
the world with more than 10
million barrels/day produced in 2007. The state-owned oil
company, Saudi Aramco, is the
world’s largest oil company. The country has around 100 major
oil and gas fields and more
than 1500 wells. Recently, the Saudi Arabia’s Ministry of
Petroleum and Mineral Resources
(MPMR) announced their plan to increase the production
capacity to 12.5 million
barrels/day by 2009 but these plans have been delayed due to
the collapse of oil price at the
end of 2008 (Alowaidh, et.al, 2010). In 2008, KSA exported an
estimated 8.4 million
barrels/day of petroleum liquids, the majority of which was
crude oil. Increasing oil exports
is a national priority which can positively influence economic
development and prosperity
in the country. However, while Saudi Arabia has the necessary
infrastructure to double its
export capacity, oil exported over the past few years has been
gradually decreasing due to
increasing internal consumption. Figure 1 shows that
consumption of oil within the country
has been gradually increasing due to population growth, strong
economic, industrial
growth and subsidised prices for electricity and transport fuel.
Fig. 1. Oil production, export and consumption in Saudi Arabia.
Approximately 3200 million barrels of oil were produced in
2008, of which 560 million
barrels (952 TWh) was consumed in the country. About 9.6% of
oil consumed within KSA
was used as feedstock and the rest as primary energy. As
primary energy, oil was mainly
used for transport (43%), power generation (39%), in co-
generation desalination plants (8%),
and for other uses (10%) such as for example the oil and
petrochemical industry(Alowaidh,
et.al, 2010).
www.intechopen.com
Energy Efficiency Initiatives for Saudi Arabia on Supply and
Demand Sides
281
2.2 Natural gas production and consumption
In 2008, Saudi Arabia produced 86 billion m3 (550 million
barrels of oil equivalent or about
900 TWh) of natural gas of which 13% was lost in flaring. All
natural gas produced was
consumed within KSA as feedstock (38%), in power generation
(34%), in desalination plants
(11%) and in industry (17%). The production of natural gas has
been increasing to fuel the
growth in the petrochemical, power generation, and water
desalination sectors(Alowaidh,
et.al, 2010). While the majority of oil produced is exported, all
natural gas produced in Saudi
Arabia is used within the country. According to Saudi Aramco,
the production of natural
gas is expected to double to 150 billion m3in 2030.
2.3 Potential for oil savings
According to independent analysis quoted in industry reports,
demand for oil is expected to
rise by 8 to 10% in 2010 mostly in the area of power generation.
A plan which allows KSA to
cut down on its oil consumption in the power generation sector
and to re-direct that
additional oil for export can bring about many economic and
environmental benefits.
Based on current growth rates, oil consumption is expected to
reach 800 million
barrels/year by 2030. A 10% annual reduction in oil
consumption within KSA in 2030 will
result in the release of 80 million barrels of oil/year for export.
At today’s price of oil, this
corresponds to additional revenue from oil export of $6
billion/year. This 10% reduction in
oil consumption is a realistic target for Saudi Arabia and can be
achieved through
i. Energy efficiency improvement on the supply side (i.e. in
power stations and industry)
as well as on the demand side (i.e. reducing electricity
consumption),
ii. Energy and resource conservation (e.g. reducing water
demand reduces energy
demand in desalination plants), and
iii. The utilisation of renewable energy sources such as solar
and wind energy.
In general, increased oil savings can be achieved by gradual
fuel switching (combined with
energy efficiency improvement) in the power generation and co-
generation desalination
sectors. The share of natural gas in these two sectors is
currently 47%. If the share of natural
gas in these two sectors alone increases to 60% in 2030, the
potential annual oil savings can
amount to 120 million barrels/year leading to additional revenue
of $9 Billion/year at
current oil prices. This switch from oil to gas is also associated
with environmental benefits
since natural gas has lower CO2 emissions than oil.
3.Overview of primary energy flow
Saudi Arabia’s annual primary energy consumption increased
from about 10 MWh/capita
in 1971 to 47 MWh/capita in 2008(Electricity and Cogeneration
Regulatory Authority,2008).
Currently KSA is one of the top 15 countries in the world in
terms of primary energy use on
a per-capita basis. This significant increase in energy demand is
due to rapid economic and
industrial growth in Saudi Arabia over the past few decades. In
2008, the total oil and gas
consumption exceeded 1 billion barrels of oil equivalent (BOE),
of which approximately 23%
was used as feedstock and the rest as an energy source in power
generation plants, co-
generation desalination plants, transport and industry. This
consumption of primary energy
(oil and natural gas) is expected to double over the next two
decades as shown in Figure 2.
www.intechopen.com
Energy Efficiency – A Bridge to Low Carbon Economy
282
In 2030, oil and natural gas demand is expected to increase to
more than 1500 million barrels
of oil equivalent/year.
As evident from Figure 2, the current share of both oil and
natural gas is 63% and 37%
respectively. The future share of oil and natural gas in the fuel
mix in KSA will depend on
policies regarding additional gas production and usage. The
projection in Figure 2 assumes
the same current primary energy mix in 2030. It is expected,
however, that natural gas
demand in KSA will double by 2030 thus displacing some oil
usage and adding to oil
exports. The total fossil fuel consumption in KSA in 2008 was
approximately 1,766 TWh,
23% of which was used as feedstock in industry, and in other
sectors (e.g. LPG in homes).
The fuel used as feedstock is not part of the primary energy use
and so it is beyond the
scope of this paper. The remaining fossil fuel (77%) is used as
primary energy in the power
generation, water desalination, industrial and transport sectors.
This paper does not include
energy conservation and oil saving in the transport sector where
28% of the primary energy
in KSA is consumed (mainly as oil). About 55% of the primary
energy in KSA is used in
power stations and desalination plants for generating electricity
and desalinated water. Of
this, 44% is used in power stations owned by the Saudi
Electricity Company (SEC) and the
remaining 11% is used in co-generation desalination plants. The
remaining primary energy
is consumed in the industrial sector (11%) and other sectors
(6%) such as agriculture and
construction(Saudi Electricity Company,2009).
0
500
1000
1500
2000
2500
3000
2004 2006 2008 2020 2030
P
ri
m
a
ry
e
n
e
rg
y
,
T
W
h
/y
Gas
Oil
1366 TWh
2035 TWh
2593 TWh
Fig. 2. Growth of primary energy demand in KSA (without
feedstock).
3.1 Primary energy consumption in the power generation sector
The Saudi Electricity Company (SEC) controls the electricity
sector and owns a total of 70
power generation stations. The current power generation
capacity is around 39 GW of
which 89% is owned by SEC, 6% from desalination co-
generation plants and 5% from on-site
www.intechopen.com
Energy Efficiency Initiatives for Saudi Arabia on Supply and
Demand Sides
283
generation (mainly at ARAMCO’s sites). The breakdown of
power stations under the
control of SEC in terms of capacities is shown in Figure 3(Saudi
Electricity Company, 2010).
0
5
10
15
20
25
30
35
40
2005 2006 2007 2008
Generation
capacity, GWe
Gas turbines Steam turbines CCGT Diesel engines
Fig. 3. Breakdown of actual generation capacity (GW) in SEC
power stations (2004–2008).
In 2008, the more-efficient combined cycle gas turbines
(CCGT) accounted for only 7% of the
total capacity with steam and gas turbines making up the
majority of the generating
capacity. The electricity generated from the different types of
power generating stations is
shown in Figure 4.
0
50
100
150
200
250
2005 2006 2007 2008
Electricity
produced,
TWhe/y
SEC - Gas turbines SEC - Steam turbines SEC - CCGT
SEC - Diesel engines Desalination plants Large consumers
Fig. 4. Breakdown of electricity produced from different
generation technologies (2004-
2008).
www.intechopen.com
Energy Efficiency – A Bridge to Low Carbon Economy
284
The fuel consumed in power stations amounted to 604 TWh
(355 million barrels of oil
equivalent) with 55% being from oil and 45% from natural gas.
Based on 2008 fuel
consumption and electricity production figures, a nominal
power generation efficiency of
29.5% is obtained for all power generation in Saudi Arabia.
This efficiency is low in
comparison to world averages. For example, the average power
generation efficiency for UK
power generation is 38.6%(Electricity and Cogeneration
Regulatory Authority,2009). If
retiring power stations in KSA are replaced by CCGT, higher
efficiencies from the power
sector can be expected, as modern CCGT power stations are
capable of delivering seasonal
efficiencies in the order of 45%-50%, based on KSA climate
conditions.
While fuel consumption in SEC power stations has been
gradually increasing, the share of
natural gas has decreased from over 50% in 2004 to 45% in
2008. Thus, there could be a great
potential in the power sector for gas to replace oil which will
then lead to additional oil
exports and so contributing to economic and environmental
benefits. The switch from oil
dominated electricity generation sector to more natural gas, will
lead to more oil becoming
available for export, improved generation efficiency and
reduction in CO2 emissions.
In order to satisfy future growth, it is predicted that an
additional 35 GWe of electricity
generation capacity, with an additional capital investment of
$120 billion, is required in
Saudi Arabia by 2030(Elhadj,E.,2004). If the current power
generation mix is maintained,
fuel consumption in the power generation sector will be 48% of
the total primary energy
consumption (2,593 TWh in 2030). If a scenario, where all
newly-built power stations are
CCGT, is considered, the nominal power generation efficiency
could increase to 37% leading
to about 20% reduction in predicted fuel consumption and also
reducing the need for
investment in new generation capacity. This shows the
importance of increasing the share of
CCGT in the power generation mix.
3.2 Primary energy consumption in the desalination sector
In Saudi Arabia there exists a strong link between water and
energy consumption because a
large portion of water consumed is desalinated water which is
transported for long
distances. A summary of water production and demand in Saudi
Arabia is given in Figure
5(Abdel-Jawad, M., 2001).
Desalination is an energy intensive process. In Saudi Arabia, in
2008, a total of 153 TWh
(57% gas and 43% oil) were used to produce 1135.6 m3 of
water and 19 TWhe of electricity.
The two main desalination methods used in KSA (and in the
Middle East in general) are
multi-stage flash (MSF) distillation and reverse osmosis(World
Bank,2007).
Power generation produces significant amounts of heat which, if
not utilised, will be
dumped to the atmosphere. Heat from power generation can be
utilised in desalination.
Combining power generation with desalination has higher
energy efficiency than generating
electricity or desalinating water separately, with energy
efficiency improvement reaching
10-20% better. So an effective policy is one which promotes the
construction of co-generation
desalination plants where heat can be recovered and used while
at the same time generating
electricity.
In order to satisfy future growth in water demand, an additional
20-30 desalination plants
with total capital investment of $50 billion will be needed by
2030. If the volume of
www.intechopen.com
Energy Efficiency Initiatives for Saudi Arabia on Supply and
Demand Sides
285
desalinated water doubles in 2030 as expected, and if
desalination plants maintain their
current efficiencies, fuel consumption by these plants will also
double to more than 300
TWh.An effective policy for reducing primary energy
consumption in the co-generation
desalination sector is to introduce standards for minimum co-
generation efficiencies from
such plants.
Desalinated water
6% (1135 Mm3)
Non-renewable
underground water
81% (14580 Mm3)
Surface water and
renewable shallow
aquifers
12% (2160 Mm3)
Treated sewage
water
1% (180 Mm3)
Total water
consumption
18,000 Mm3
Industry
11% (2,000 Mm3)
Domestic
9% (1,600 Mm3)
Irrigation
80% (14,400 Mm3)
Fig. 5. Water production and demand in Saudi Arabia.
3.3 Primary energy consumption in the industrial sector
The industrial sector in KSA consists of oil refining,
petrochemicals, iron and steel, cement
in addition to other sectors. The average growth rate in the
industrial sector is 4.3% with a
total GDP of more than $240 Billion. The petrochemical sub-
sector is one of the fastest
growing sectors and has a 1.2% share in GDP. In 2008, primary
energy consumption in the
industrial sector reached 150 TWh representing 11% of total
primary energy use in KSA.
Assuming a growth rate of 4.3%, this is expected to increase to
379 TWh in 2030.
4. Electricity demand in Saudi Arabia
In 2008, electricity produced in Saudi Arabia was 204 TWh,
11% of which was lost in
transmission and distribution. The total electricity consumption
in 2008 was about 181 TWh
mainly in the residential sector (53%) with a consumption of 97
TWh at the user end which
corresponds to approximately 285 TWh (168 million barrels of
oil equivalent) at the power
station inlet. Between 2004 and 2008, electricity consumption
in the Kingdom has grown at
an annual average of 5.1%. As a result of population and
economic growth in Saudi Arabia,
electricity consumption is expected to double to about 360 TWh
in 2030.The breakdown of
electricity delivered is shown in Figure 6(Saudi Electricity
Company,2010).
www.intechopen.com
Energy Efficiency – A Bridge to Low Carbon Economy
286
18%
53%
12%
11%
6%
Industrial
Residential
Government
Commercial
Other
23 TWhT&D
Losses
181 TWh of electricity
delivered
204 TWh of electricity
Generated
Fig. 6. Electricity flow in the Kingdom of Saudi Arabia in 2008.
5. Growth of primary energy and electricity demand
Figure 2 above shows the expected primary energy consumption
in 2020 and 2030. Based on
the discussion in Sections 2, 3 and 4 above, future primary
energy demand in different
sectors is estimated as shown in Table 1. Table 1 gives a
summary of the assumptions
undertaken in obtaining the future primary energy demand in
KSA in 2030 for the power
generation, desalination and industry sectors following a
business-as-usual (BAU) scenario.
As stated above, primary energy consumption in the transport
and the “other” (including
agriculture, construction industry, etc.) sectors are excluded
from this study.
According to the BAU scenario, the share of the total primary
energy demand for these three
sectors increases from the current 66% to 74% in 2030. Based
on the BAU scenario, the
annual growth rate for primary energy demand in Saudi Arabia
as a whole is 3% and in
comparison with 1.6%/annum worldwide growth demand
projected by the
IEA(International Energy Agency,2009). For the three sectors in
Table 1, a growth in
demand of 3.4%/annum is estimated indicating the importance
of implementing primary
energy saving measures in these sectors in particular.
www.intechopen.com
Energy Efficiency Initiatives for Saudi Arabia on Supply and
Demand Sides
287
Sector Projection
Current,
TWh/y
CO2
emissions, T
CO2/y(1)
2030,
TWh/y
CO2
emissions,
T CO2/y(3)
Power
generation
Fuel consumption in the
power generation sector is
approximately 600 TWh.
The power generation
capacity and power output
are expected to double.
Assuming the same
generation mix (i.e. CCGT,
steam turbines, gas
turbines) is maintained,
fuel consumption will also
double.
604 328 1208 655
Desalination
Municipal water demand
will increase from the
current 1.6 billion m3/year
to 3.4 billion m3/year in
2030. Assuming the same
share of desalinated water
in the municipal sector is
maintained (i.e. 70%), an
additional 1.3 billion m3 of
water from desalination
processes will be required.
The trend in KSA is to
build cogeneration
desalination plants, so a
doubling of primary energy
consumption is almost
required. Using the ratio of
desalination capacity in
2030 and currently, the
energy use in 2030 is 325
TWh.
153 77 325 179
Industry
Using a growth rate similar
to the current rate (i.e.
4.3%), the demand by
industry in 2030 is 379 TWh
150 54(2) 379 135(2)
(1) Based on emission factors of 350 g/kWh for gas and 700
g/kWh for oil.
(2)The smaller emissions from industry are due to the much
higher natural gas consumption in
comparison to oil.
(3) Assuming same energy mix and same emissions factors
Table 1. Summary of current and future (business-as-usual)
primary energy demand by
sector.
www.intechopen.com
Energy Efficiency – A Bridge to Low Carbon Economy
288
6. Energy efficiency challenges and barriers
The challenge electricity-generating utilities face is the
provision of secure and stable
supplies of electricity to their customers. A major tool in
meeting this challenge is energy
efficiency; however, both challenges and barriers face multi-
faceted cultural, economic,
technical, and institutional problems, which may require
mandatory and educational
initiatives to overcome them, as well as institutional
reorganisation
6.1 Cultural barriers
The historical low fuel and electricity prices, along with
decades of increasing prosperity,
have led to an endemic culture of profligate energy usage. The
high standards of living
taken for granted by new generations of Saudi youths entering
the workforce depend on
secure and stable energy, yet these figures strongly indicate that
unless energy-efficiency
measures are swiftly incorporated at all levels of the supply-
demand equation, economic
development may not be able to meet expectations. The problem
is compounded by the
twin growth profiles of population and per-capita energy
consumption. From 2002 to 2006,
the population has grown by an average of 2.6% p.a. and per-
capita energy consumption by
an average of 6.1% p.a. Over the same period as shown in
Figure 7, SEC’s generating
capacity has grown by an annual average of 5.4% yet total peak
loads have grown by an
annual average of 7.6%. Total consumption increased from
128,629 GWh in 2002 to 163,147
GWh in 2006, an average increase of 6.7% p.a. Although in
absolute terms the increase in
residential consumption during the period was greater than the
combined total
consumption of the agricultural and commercial sectors,
expressed as percentages, the
greatest average annual increase was in the commercial sector at
13.4%, followed by the
residential sector at 7.9%. The smallest increase in consumption
was in the industrial sector,
which only increased by industrial consumption by 2.8% p.a.
(Ministry of Water and
Electricity, 2006).
Fig. 7. Growth of Saudi electricity utility generating capacity
and total peak loads in Saudi
Arabia. Solid lines (1976-2007) are MOWE statistics; dashed
lines (2008-2023) are projections.
www.intechopen.com
Energy Efficiency Initiatives for Saudi Arabia on Supply and
Demand Sides
289
Despite the large annual increases in electricity consumption
there is currently limited
interest in the subject of energy efficiency among consumers
from any sector, and little
awareness of the opportunities available to them or of the
benefits of specific energy
efficiency technologies and practices. The recent government
decision to abolish electricity
price subsidies may provide an impetus to change this into a
culture of energy efficiency;
however, for this to happen, consumers need to be energy aware
and tariffs need to actually
reflect the true costs of generation, transmission, and
distribution.
6.2 Economic barriers
The Saudi Electric Company needs to raise at least SR 380
billion in investments for the
period 2009-2017 (Saudi Electricity Company,2009) if it is to
ensure security of supply and
meet its capacity increase targets. Although there are proposals
to open the electricity
generating industry to private sector involvement, the high
capital costs and low tariffs
mean that it would not be an economically viable investment.
This is especially the case in
sparsely-populated rural areas where the low customer density
profile means that the cost
of generation and distribution to utility companies may be
significantly higher than in urban
areas where customer densities are much higher.
Saudi financial institutions have yet to make major investments
in energy efficiency projects.
Despite many projects offering 2-3 year payback periods,
committing capital to investments
in new energy technologies is still considered an adverse risk. A
similar attitude is found in
all electricity consumer sectors. Not only are they also reluctant
to make investments in
energy efficient technologies, but the direct and indirect
medium- and long-term economic
gains of energy efficiency are often overlooked in favour of the
short-term capital-cost
savings available with cheaper equipment and work practices.
Although the Government recently decided to abolish electricity
price subsidies, costs to
consumers have risen, and environmental costs are still not
internalised in energy tariffs. To
make sustainable reductions in energy use, consumers must see
clear financial benefits:
Subsidized energy prices mean consumers have little incentive
to save energy. Even
assuming that consumers had accurate information about the
benefits of energy efficiency
measures, had a range of energy-efficient appliances from
which to choose, and had the
financial means to purchase them, there would still be little
economic reason for them to do
so because electricity tariffs are lower than the expected
avoided costs of electricity. In
addition, despite import duties on electrical goods, the market is
flooded with cheap
imported products.
6.3 Technical barriers
Perhaps the biggest problem facing the energy supply sector is
the large seasonal variation
in electricity consumption. In the hot summer season, there is
increasing energy demand for
air conditioning, especially by the residential and commercial
sectors. Figure 8 shows a chart
of the daily variation in peak load and the daily temperature
profile measured in Riyadh on
09 September 2006. Peak load follows temperature throughout
the day, with minimum
demand and minimum temperatures in the early morning and
maximum demand and
maximum temperatures in the early afternoon. Peak load power
is provided by gas
turbines; they have the advantages of fast start-up times and can
quickly respond to changes
www.intechopen.com
Energy Efficiency – A Bridge to Low Carbon Economy
290
in demand, but have the disadvantage of being relatively
inefficient. An additional
disadvantage is that during peak hours, when demand is at a
maximum, ambient
temperatures are also at a maximum, which can degrade turbine
efficiencies by up to 20%.
Another problem is the low reserve available generation margin.
In Figure 7, the generating
capacity of the electric utilities from 1976 to 2007 is shown
along with the total peak load.
Each increase in generation capacity is met by an increase in
consumption. In 2002,
generating capacity increased by 9.6%, but the following year,
2003, saw consumption
increase by 9.8%. In 1996, 2001, and every year since 2004, the
electric utilities have had
insufficient capacity to meet the peak load.
Fig. 8. Daily variation in peak load and temperature
(temperatures for Riyadh, 09 Sept.
2006).
6.4 Institutional barriers
Perhaps because of its unique position as a major oil and gas
producer, and its resultant low
domestic energy prices, Saudi Arabia lags behind many other
developing nations in
implementing energy efficiency strategies. As a consequence,
there is no central institution
responsible for energy efficiency at a national level,
responsibility for oil, natural gas, and
electricity is divided amongst several ministries and
institutions, and there are no explicit
end-user policies.
The Ministry of Petroleum and Mineral Resources (MPMR) is
responsible for the activities of
oil companies, the largest of which is Saudi Aramco. Saudi
Aramco produces almost all the
country’s crude oil and all of its natural gas liquids. It is
involved in exploration,
production, and refining of crude oil, as well overseas
marketing and domestic distribution
of petroleum products. The Ministry is also responsible for the
gas industry. Saudi Aramco
produces, transports, and markets natural gas to large gas
consumers such as power plants,
desalination plants, and process industries. It also provides gas
to the Saudi Gas Company,
which delivers and sells natural gas to small consumers.
www.intechopen.com
Energy Efficiency Initiatives for Saudi Arabia on Supply and
Demand Sides
291
The electricity industry answers to the Ministry of Water and
Electricity (MOWE), although
the Electricity Cogeneration Regulatory Authority (ECRA)
regulates the industry and
ensures high quality electric power and services are provided at
reliable levels and
reasonable prices; ECRA is also responsible for energy
conservation. Power generation,
transmission, and distribution are carried out the Saudi Electric
Company (SEC). As an
entity, SEC has been operational since 2000 and was formed by
ministerial decree through
the merger of ten regional power companies. SEC is a joint
stock company; however, the
majority stockholder is the Saudi government.
Although many national organisations deal with limited aspects
of energy efficiency and
have sophisticated skill sets, their work is often duplicated,
their strategies and policies are
limited in scope, and their activities are not coordinated.
Ultimately, none of the initiatives
taken by these bodies, or those taken by major commercial and
industrial concerns, are
enforceable outside their own organisations or have much effect
on a national scale due to
lack of transparency on the part of governmental organisations
and commercial
confidentiality concerns by commerce and industry. There are a
few sustainable energy
policies and standards at a national level, but they are not
enforced by law and are not
legally binding. The Saudi Arabian Standards Organisation
(SASO), for example, has
published standards for consumer electrical appliances, which if
implemented, should
decrease the availability of cheap imports and increase the
uptake of energy efficient
appliances; however, the organisation is not able to enforce the
standards, and despite
import tariffs, the market is flooded with cheap energy
inefficient products (National
Energy Efficiency Program, 2010).
7. Energy efficiency initiatives
A number of energy efficiency and conservation initiatives have
been taken by various
agencies in response to the increasing demand for electric
power and to help ensure security
of supply. Steps to reduce energy demand have been taken by
the Saudi Arabian Standards
Organization (SASO) with standards for the use of advanced
insulating materials in the
construction of new commercial buildings, and by the
restructuring of electricity tariffs by
the Saudi Electric Company.
At the same as expanding conventional generation capacity,
MOWE is attempting to reduce
peak demand by setting limits on the maximum power delivered
to large electricity
consumers, and by establishing a demand-side management
programme. MOWE is also
enabling major consumers in industry and commerce to reduce
peak demand time
consumption and to shift their usage patterns to off-peak times,
while agricultural
consumers are required to reschedule their irrigation to off-peak
times. In addition, new
developments designed with large air conditioning loads are
required to incorporate
thermal energy storage systems. Another initiative is the
proposal to privatize and
reorganize the electricity sector into three independent sectors:
generation, transmission,
and distribution, and to allow private-sector participation in
new power-generation projects.
An estimated 837 MW peak load reduction was achieved in
2001 through these initiatives in
the governmental sector and by 34 MW in the industrial sector;
the commercial sector,
however, increased their peak load by 126 MW during the same
period.
Although each of these initiatives is important in its own right,
they have not been
coordinated by a central authority and may have limited long-
term effect. For this reason,
www.intechopen.com
Energy Efficiency – A Bridge to Low Carbon Economy
292
perhaps the most important initiative has been the establishment
of the National Energy
Efficiency Programme.
During the 5 years that NEEP has been active, it has
coordinated a varied programme of
activities including:
-of-use tariff programme for major industrial and
commercial customers
with SEC
electrical appliances with
SASO
-through energy audits of governmental, commercial,
and industrial facilities
commercial, and
industrial facilities
d
seminars
7.1 Tariff restructuring
Historically, tariffs have been heavily subsidised. The subsidy
being the difference between
the average cost of production and the tariff. Prior to 1984 there
was single flat-rate tariff of
0.05 SR/kWh for industrial customers and 0.07 SR/kWh for
residential customers. For tariff
purposes, industrial customers also include agriculture,
hospitals, and charities; while
government is included with residential customers. Over the
next decade, the flat-rate
industrial tariff was unchanged, while residential usage was
assessed according to a three-
tier tariff. During this time, despite rising production costs,
rather than raising tariffs or
adjusting rates downward, they were adjusted upward, first in
1985 which saw the usage
level at which the maximum tariff started double from 2000 to
4000 kWh/month, and again
in 1992 when it was increased to 6000 kWh/month (Saudi
Electricity Company, 2010).
In 1995, a two-tier tariff was introduced for industrial
customers, which effectively doubled
charges as the higher tariff of 0.10 SR/kWh started at 2000
kWh/month. At the same time,
the maximum charge for residential users was increased from
0.15 SR/kWh to 0.20 SR/kWh
with no adjustment in the level at which the highest tariff
started.
The major change in tariff structure occurred in 2000, with the
introduction of 11 tiers in the
tariffs for residential customers ranging from 0.05 SR/kWh to
0.38 SR/kWh, and the
reintroduction of a flat rate tariff for industrial customers at the
higher rate of 0.12 SR/kWh.
The residential tariffs were in force for 7 months before being
lowered to 0.05 SR/KWh to
0.26 SR/KWh; however, the number of tiers and usage was not
changed.
7.2 Time-of-use tariffs
In addition, to restructuring industrial tariffs, a voluntary pilot
time-of-use-tariff (TOU)
programme was introduced for industrial and commercial
customers with consumptions
exceeding 600 MWh per annum. The pilot programme was
limited to customers in Riyadh,
which is part of SEC’s Central Operating Area and was
conducted by SEC in collaboration
with NEEP.
www.intechopen.com
Energy Efficiency Initiatives for Saudi Arabia on Supply and
Demand Sides
293
The TOU programme divides the year into two: summer, which
runs from June to
September, and winter, which runs from October to May. The
summer has two periods, on-
peak and off-peak. On peak applies on weekdays (i.e. Saturday
to Wednesday) from one
o’clock in the afternoon until 5 o’clock in the evening, this
being the time of maximum
domestic usage as well the time of least gas-turbine efficiency
due to high ambient
temperatures. Off-peak applies on weekdays at all other times,
and at weekends. The winter
is off-peak at all times.
Generally, the more customers shift or curtail their usage to a
TOU tariff during peak periods,
the greater the net benefits to both the utility companies and its
customers should be. Since the
pilot TOU tariff program was voluntary, to ensure a high rate of
customer participation, a
peak to off-peak rate ratio was selected to maximise its appeal
to a wide range of customers,
rather than to maximise the benefit to the utility company.
Several peak to off-peak rate ratios
were proposed to large customers; most expressed interest in
4:1 and 2:1 ratios, with the
strongest preference being for a TOU rate with a 4:1 peak to
off-peak rate ratio.
The TOU tariffs were calculated using Long Run Marginal Cost
differentiated by time-of-
use. The peak TOU tariff was set at 0.35 SR/kWh for industrial
customers and 0.76 SR/kWh
for commercial customers, and the off-peak TOU tariff was set
at 0.09 SR/kWh and 0.19
SR/kWh for industrial and commercial customers respectively.
The outcome of the 2006
pilot TOU tariff programme is summarised in Table 3. From
June to September 2006, the
maximum on-peak reduction was 15.3 MW. About 10% of the
total peak energy used, 2494
MWh, was shifted from peak to off-peak periods, 1717 MWh by
industrial customers and
777 MWh by commercial customers. The total reduction in bills
for all customers was 351510
SR, industrial customers saved 78160 SR, and commercial
customers 273350 SR. Industrial
customers contributed 69% to the total energy shift and their
bill reduction was 22% of the
total. In 2007 the number of participating industrial customers
increased to 145 and
commercial customers to 37; the maximum peak-load reduction
was 90 MW with total
savings of 64 million SR. In order to attract more participants,
the on-peak tariff in 2008 was
reduced to 0.09 SR for industrial customers and 0.19 SR for
commercial customers.
Industrial Commercial
Tariffs
Normal (SR/kWh) 0.12 0.05 – 0.26
On-Peak TOU† (SR/kWh) 0.35 0.76
Off-Peak TOU‡ (SR/kWh) 0.09 0.19
Outcome
Customers 26 9
Max Peak-Load Reduction
(MW)
11.9 3.4
Total Energy Saving (MWh) 1717 777
Total Bill Reduction (thousand
SR)
78.16 273.35
†On-Peak TOU: June-Sept, Sat-Wed, 13:00-17:00
‡Off-Peak TOU: All other periods
Source: NEEP (2006)
Table 3. Pilot 2006 Time-of-Use (TOU) tariff programme.
www.intechopen.com
Energy Efficiency – A Bridge to Low Carbon Economy
294
7.3 Energy efficiency labels and standards for new equipment
Substantial energy savings are possible by replacing energy-
inefficient electrical appliances
with energy-efficient appliances. A cost-effective method of
doing so is to determine which
classes of appliances consume the most energy and to develop
minimum energy efficiency
standards to which they have to comply. The standards describe
testing and classification
procedures for compliance. The appliances then bear energy-
efficiency labels to provide
consumers with information about their energy performance.
These can be expressed in
terms of energy use per hour, energy efficiency as a percentage,
a coefficient of performance,
or as an estimated cost of usage. In addition to such technical
data, labels can also show a
comparative index to simplify purchasing decisions for the
general public; typical forms are
‘energy-stars’ or ‘good-better-best’ systems.
Testing, performance-measuring procedures, and energy
efficiency and labelling standards
have been drafted by SASO in collaboration with NEEP for
three of the major energy-
consuming classes of electrical equipment: Ducted and non-
ducted air-conditioners;
household refrigerators, refrigerator-freezers, and freezers; and
household clothes washing
machines. Prior to this programme, the only appliances in Saudi
Arabia to have energy
efficiency regulations were air conditioners; however, they were
ineffectively enforced. The
existing standards for refrigerators, freezers, and washing
machines, as well as for air-
conditioners, were for health and safety and for physical and
technical compatibility.
Locally manufactured equipment tends to have low energy
efficiencies and imported
electrical equipment is subject to import duties. These factors,
in addition to low levels of
awareness amongst consumers, mean that energy use is not
generally a significant factor in
consumer purchases. Initiatives to change purchasing priorities
include a comprehensive
programme of education and awareness aimed at all sectors of
the supply-demand chain,
and financial incentives in the form of rebates for the purchase
of energy-efficient
appliances.
The energy efficiency labels display manufacturer specific
details, the appliance’s electrical
specifications and operational capacity, and its performance
under standard tests (Saudi
Arabia Standards Organization, 2006). The label also shows a
number of stars indicating its
claimed energy efficiency at rated conditions. An example
energy efficiency label for
washing machines is shown in Figure 9; labels for other
appliances differ only in their
appliance-specific requirements in the main panel. A maximum
of six stars can be
displayed; the more stars, the greater the energy efficiency. The
number of stars is derived
differently for each class of appliance: For air-conditioners, it is
the ratio of output cooling in
Btu/hr to the input power in Watts at a given operating point;
for domestic washing
machines, it is primarily a function of the energy used per load
and its rated load capacity;
and for refrigerators and freezers, it is the reduction in energy
consumption for their class
expressed as a percentage. The derivation of energy star ratings
for these appliances is in
shown in Table 4.
In addition to the testing and certification procedures, the
programme is also addressing
market transformation issues and the ability of the local
manufacturing base to meet the
standards. The likely costs for new product design, new
technology licenses from foreign
partners, production line re-tooling costs, and associated lead
times to comply with the
standards has been estimated for these appliances and a market
transformation strategy is
being developed. Information and awareness programmes have
been developed and
www.intechopen.com
Energy Efficiency Initiatives for Saudi Arabia on Supply and
Demand Sides
295
education and advertising campaigns targeted to industry,
business, and consumers have
been designed. Future assessments will be made to determine
whether, as in developed
countries, market forces will drive the adoption of more
efficient models or whether
mandatory standards will be required(Saudi Arabia Standards
Organization, 2007).
Fig. 9. Energy efficiency label for washing machines.
Washing Machines
Refrigerators &
Freezers
Air Conditioners
Star Rating
Function of input
energy and load
capacity
(dimensionless)
Amount energy
consumption < class
limit
(%)
Ratio of output
cooling rate to input
power
(Btu/h/w)
≥ 6.0
5.0 to 5.9
4.0 to 4.9
3.0 to 3.9
2.0 to 2.9
< 2.0
30
25
20
15
10
5
> 10
9.5 to 10
9 to 9.5
8.5 to 9
7.5 to 8.5
< 7.5
6
5
4
3
2
1
Source: SASO (2005, 2006, 2007)
Table 4. Derivation of energy star rating for washing machines,
refrigerators and freezers,
and air-conditioners.
www.intechopen.com
Energy Efficiency – A Bridge to Low Carbon Economy
296
7.4 Energy audits
NEEP conducted a programme of energy audits to focus
attention on the concept and
benefits of energy efficiency by providing demonstrable ‘proof
of concept’. The energy
audits increased corporate awareness of energy efficiency
measures and technical and
economic recommendations were made available for policy
makers.
The energy audits were conducted at various levels; the simplest
identified areas where
consumers could reduce their energy usage. It involved walk-
through surveys of
governmental, commercial, and small industrial premises and
provided immediate feedback
of zero- and low-cost energy-saving possibilities. The audits
examined electric utility
equipment, HVAC systems, lighting, and water heating systems.
As well examining the
actual components of each system, the audits also examined the
types of components used,
locations, capacities, control systems, set points, replacement
schedules, operational profiles,
and historical records of electricity consumption. The results
showed energy savings of at
least 15% in educational buildings, 10% in shopping malls, and
10% in the industrial sector,
with some smaller commercial premises showing potential
savings of up to 35%. Savings in
HVAC systems were obtained by rescheduling chiller and
exhaust operation; all chillers
were stopped overnight with maximum venting during the early
morning to remove
accumulated heat, and daytime break-period venting was
minimised. Lighting systems
phased in lower wattage fluorescent tubes, replaced electro-
magnetic ballasts with electronic
ballasts, and phased in halogen lamps with 50% lower wattage
high-pressure sodium lamps;
in addition, better use of natural lighting was made. Occupancy-
based lighting and air-
conditioning schedules were introduced, with occupancy sensors
fitted where appropriate,
and in larger facilities HVAC fresh-air streams were pre-cooled
by exhaust streams.
More-detailed energy audits were performed at medium- and
large-scale industrial and
commercial facilities to identify specific areas in which
electrical and thermal energy savings
could be made. Industrial facilities included refineries, power
plants, and chemical and
processing plants; and commercial facilities included hotels,
hospitals, shopping centres,
private schools, large mosques, and office buildings. In addition
to the systems mentioned
above, the detailed audits also examined more specialised
equipment and plant such as
compressed air systems, electric motors and pumps, steam
systems, and boilers and
furnaces. The audits indicated that energy consumption in KSA
could typically be reduced
by up to 20% compared to current levels, with commensurate
reductions in CO2 emissions,
and that in some older industrial facilities energy savings
between 40% and 70% could be
obtained by rescheduling plant and equipment operation and
introducing energy
performance monitoring systems. Where retrofit or replacement
was recommended,
payback periods between 3 months and 5 years were estimated.
The most-detailed energy audits were of boilers, furnaces, and
steam systems. These were
conducted in conjunction with intensive training courses in
boiler and furnace efficiency.
After implementing all zero- and low-cost measures guidance
was given in preparing a loan
request package to finance high capital-cost measures.
Recommended energy efficiency
improvements ranged from simple tune-ups to complete retrofits
with potential energy
savings between 5% and 10%.
Data from the programme are being used to target marketing
efforts for detailed energy
audits and feasibility studies, and are also being used for
national energy efficiency
www.intechopen.com
Energy Efficiency Initiatives for Saudi Arabia on Supply and
Demand Sides
297
planning and policy analysis. Although most facilities were well
maintained, much of the
maintenance was reactive, not proactive, and in some facilities
cooling and lighting was
operated continuously regardless of occupancy. Most
importantly, however, despite
management awareness of the concept of energy conservation,
few energy accounting
systems were in place. Although the audits highlighted energy
saving potentials, long-term
energy savings can only be realized through total energy
management programmes, the
foremost aspect of which is commitment at a corporate level to
energy conservation.
7.5 Promotion of an energy service industry
Energy Service Companies (ESCOs) have been successfully
operating in industrial countries
for more than 50 years. ESCOs specialize in reducing their
customers’ energy consumption
through a combination of engineering expertise and financial
services. After conducting
energy audits, ESCOs help customers upgrade their facilities
and reduce energy costs by
investing future cash flows from energy savings using a type of
project financing called
‘performance contracting’, in which cost-saving measures are
implemented at no initial cost
to the customer and the energy savings are used to pay back the
initial investment. ESCOs
in Saudi Arabia face the same barriers that other energy
efficiency initiatives and projects
have encountered. Most of these barriers are due to
unfamiliarity with the concept and
mode of their operation by clients and financing intuitions; the
financial barriers, however,
relate to the fact that the ESCO industry is new in Saudi Arabia.
In countries with well-
established bank structures, ESCOs guarantee energy savings
large enough to cover their
clients’ debt obligations and banks carry the credit risks. In
countries with new ESCO
markets, such as Saudi Arabia, banks are reluctant to carry
credit risks and ESCOs must
carry both performance and credit risks; the clients carry the
business risk in both cases (
National Energy Efficiency Program, 2006).
The annual energy efficiency market in Saudi Arabia has been
estimated at SR 1.2 billion for
the commercial, governmental, and industrial sectors alone [20].
Many organizations in
Saudi Arabia have old and inefficient facilities, and although
they would like to implement
energy-conservation measures, they have neither the expertise
nor the initial capital to do
so, despite potential energy savings of up to 35%. There are
presently five ESCOs in Saudi
Arabia, and in an initiative designed to increase this number and
to help those already
established, NEEP organised two business advisory seminars
addressing all aspects of the
energy services industry. The first presented 25 topics over
three days, and the second, 32
topics over five days. The seminars gave potential ESCOs
advice about how to overcome
contractual and legal start-up barriers, and how to identify and
exploit energy-efficiency
opportunities on a commercial basis. They also provided hands-
on experience in business
development, marketing, customer relations, contracts, staffing,
and international joint
ventures. In the short-term, however, the institutional, financial
and commercial barriers are
likely to prevent them from exploiting the opportunities.
7.6 Energy efficiency information and awareness
Due to the very low levels of awareness of the advantages and
possibilities of energy
efficiency on the part of both the energy service industry as
well as that of energy end users,
NEEP initiated an information and awareness programme to
determine current levels of
awareness of energy efficient opportunities, equipment, and
financing mechanisms. The
www.intechopen.com
Energy Efficiency – A Bridge to Low Carbon Economy
298
first part surveyed the energy service industry, and the second
part surveyed energy end-
users. The majority of planned energy efficiency measures
target high energy consumers.
The data obtained will help formulate information management
and distribution strategies,
and to assist energy service companies identify and exploit
market opportunities.
The information and awareness programme compiled detailed
information on the
breakdown of electricity consumption. The Western Region
accounts for 38% of residential
electricity consumption, the Central Region accounts for 39% of
governmental consumption,
and the Eastern Region accounts for 83% of industrial
consumption. Electricity is an energy
source for 99% of energy end users, 80% of whom consume less
than 4,000 kWh per month
with 1.4% consuming more than 10,000 kWh per month.
Petroleum is an energy source for
21% of customers and gas for 7%.
The majority of survey respondents feel that energy bills are the
least controllable of their
operational costs, as a result, they rarely budget for energy
efficiency measures. Where
energy efficiency projects are undertaken, they appear to be
entirely self-financed. The
surveys did not identify, directly or anecdotally, any examples
of financial institution
involvement.
Ninety percent of energy service-industry respondents were
unaware of local financing
options and 80% were not prepared to self-finance energy audits
or implement
recommendations. Among energy end-user respondents, 58%
were not prepared to self-
finance energy audits or implement recommendations. Among
incentive options for
implementing energy efficiency programs, 40% preferred free
studies, 23% preferred
policies and regulations, reward schemes were preferred by
23%, and soft loans was
preferred by 14%. Among common energy efficiency measures
implemented in the
residential sector, 90% turn off unused equipment, 34% have
energy saving lamps, and 34%
clean their air-conditioning filters. Self-financed energy-
efficient purchases were reported by
30% of residential respondents; of these 40% were for lighting,
34% for air conditioning, 16%
for refrigerators and freezers, and 14% for water heaters.
A compilation of key information about energy-efficient
equipment and estimates of
possible energy and monetary savings was made for
dissemination by local organisations,
the media, and the Internet. It is part of an on-going nation-wide
public-awareness
programme designed to educate consumers and to influence
their buying decisions in
favour of energy-efficient devices. A permanent energy-
efficiency exhibition is planned for
the newly constructed Prince Salman Science Oasis in Riyadh,
and others may follow in
other regions. The exhibits will include interactive displays and
information about energy
efficient air-conditioning systems, lighting, cooking, water
heating, and insulation.
7.7 Energy efficient equipment leasing programme
This is an ongoing programme designed to eliminate financial
barriers to the purchase of
energy-efficient equipment by supplying energy-efficient
equipment to consumers and
recovering the cost through lease payments added to electricity
bills. Energy savings are
expected to cover the cost of the leases. Initially the programme
will target air-conditioning
units, and replace energy-inefficient units with energy-efficient
units. Electricity demand is
expected to fall by an amount proportionate to the number of
units supplied through the
programme. An important aspect of the programme is that units
are traded-in. Without this
www.intechopen.com
Energy Efficiency Initiatives for Saudi Arabia on Supply and
Demand Sides
299
provision, the old air-conditioning units would be retained and
utilized in a location that
wasn’t previously air conditioned; instead of reducing energy
consumption, this would add
to consumption and increase demand on the grid. The trade-in
condition also allows proper
disposal of hazardous materials and correct recycling and
disposal of the old units.
7.8 Technical and management training
In addition to the seminars and training mentioned above,
training in various other energy
efficiency disciplines was provided in the form of workshops
and seminars. Most
workshops were offered in several venues across the country but
were only made available
to suitably qualified professionals as a major consideration was
training trainers. Over 400
personnel from all sectors attended the training sessions, many
of whom have gone on to
establish regular training sessions and energy efficiency
programmes in their own
institutions and companies. Sessions included:
-efficiency project financing
chnical efficiency and energy management
-side management
8. Policy recommendations
During the course of the programme the need for additional
government initiatives were
identified; the most critical of which are:
8.1 Endorsement
Enforceable legislation is essential if energy efficiency
measures are to have long-term
national effect. For energy efficiency to become an integral and
fundamental part of doing
business, active and unequivocal support and endorsement by
the Government of Saudi
Arabia is essential. Leading institutions, such as KACST and
SASO, ministries such as
MOWE and MPMR, and major industries must be seen to take
the lead and to support the
concept and goals of the energy efficiency and conservation.
8.2 Transparency
Government needs to take the lead in transparency. All
government agencies and ministries,
as well as industry and commerce, must make information about
their energy consumption
patterns and energy efficiency activities available. Historically,
commercial confidentiality
has been cited for the reason very little data has been made
available to public oversight.
Without data, however, advisory and regulatory engineers and
consultants are unable to
provide detailed advice and feasibility studies to improve plant
efficiency. Lack of data also
www.intechopen.com
Energy Efficiency – A Bridge to Low Carbon Economy
300
degrades the ability to formulate public policy and to assure the
security and economic
growth of Saudi Arabia through efficient and wise use of its
energy resources.
Public sector and large industrial plants and facilities should
conduct mandatory energy
audits and the verifiable non-confidential results need to be in
the public domain. Ideally,
information claimed to be confidential should be supported with
documented reasons in
support, and should, to the governing authority’s satisfaction,
adequately demonstrate that
disclosure could seriously and prejudicially affect their
commercial interests.
8.3 Training
Government needs to address the critical shortage of qualified
engineers and technicians.
There are at present insufficient suitably qualified and
experienced engineers and
technicians to perform the necessary work on a national scale.
The provision of training
needs to be accelerated.
8.4 Awareness
Government support is needed to increase public awareness of
energy efficiency to a level
substantially higher than its present level. High-level public
figures need to endorse the
effort to conserve the country’s finite natural resources; in local
and national legislation; in
professionally produced programmes and campaigns of public
awareness; but most
importantly, through public, private, and professional example.
8.5 Financing
An initial programme of government intervention or subsidy,
perhaps in the form of early
adoption loan guarantees or a sliding scale of energy rebates, is
required to encourage
financial institutions to finance projects identified and endorsed
as technically and
economically feasible.
8.6 Inertia
Even when positive benefits are clearly demonstrated,
resistance to change and a reluctance
to adopt new technologies and methods extends from
government procurement
specifications to the adoption of energy efficiency standards for
appliances and equipment.
Decades of low energy prices and the consequent endemic
wastefulness, requires the
imposition and coordination of top-down energy efficiency
policies and regulations to
invoke changes in energy usage. Even with high level
endorsement, public awareness
campaigns, and financial inducements, public acceptance is
likely to lag behind awareness.
For this reason, the government should consider a staged
implementation of policies,
starting with those with the greatest public need or support.
8.7 National centre
Responsibility for energy efficiency rests on everyone, yet to
ensure that measures are
applied consistently and efforts are not duplicated, central
coordination is required. This
could be provided by a national centre for energy efficiency. In
addition to continuing and
extending the work initiated by NEEP, the centre should be able
to advise at all levels and
www.intechopen.com
Energy Efficiency Initiatives for Saudi Arabia on Supply and
Demand Sides
301
on all aspects of energy efficiency and conservation, and should
be responsible for ensuring
that they inform all aspects of governmental policy.
9. Initiatives for reducing energy consumption on the supply
side
9.1 Modernisation of existing power plants
Most power generation capacity in Saudi Arabia comes from
open cycle gas turbines and
from steam turbines with efficiencies around 30%. Based on
current mix of power
generation capacity in Saudi Arabia, the nominal efficiency for
the current power generation
mix is around 29.5%. This relatively low energy level can be
improved by converting
existing open cycle gas turbines (OCGT) and steam turbine
(ST)-based power plants to
combined cycle gas turbines CCGT which can achieve
efficiencies as high as 50% in Saudi
Arabia. The value of constructing CCGTs rather than OCGTs
has been recognised in Saudi
Arabia. For, example the new power plant constructed at
Qurayyah in the East part of SA
was originally intended to be OCGT (15 x 127 MWe). The
OCGT plant with a total capacity
of ~ 1.9GW was completed in May 2010 with an investment
cost of $ 570 Million. However,
recently a $300 Million contract was awarded to GE to supply
five STs for a major expansion
of the Qurayyah OCGT plant and converting it to CCGT. This
will increase the output of the
power plant from 1.9 GW to 3.1 GW.
Considering OCGT, there are currently more than 3 GWe of
power plants which can be
potentially converted to CCGT. Our calculations show that this
conversion can potentially
provide an opportunity for oil saving of 14-15 million
barrels/year which equate to
additional revenue of $Bn1.2/year at current oil prices. The
conversion to CCGT will
produce more electricity for the same amount of fuel. However,
the operation of CCGT will
require additional infrastructure and so additional investment
will be required for the
conversion. The techno-economic feasibility of converting to
CCGT then needs to be
investigated on a case-by-case basis.
9.2 Minimum efficiency standard for new power plants
The overall nominal efficiency of power generation in Saudi
Arabia can be improved by
setting a minimum efficiency standard for new power plants.
This will ultimately lead to a
reduction in the additional capacity required by 2030 (currently
at 35 GWe) and will
consequently lead to primary energy/oil savings. These
minimum efficiency standards are
dependent on climatic conditions and so they need to be
estimated specifically for Saudi
Arabia and may differ from one region to another. For example,
higher ambient air
temperature will increase the compression power requirement
thus reducing efficiency. In
addition, higher condenser water temperatures will reduce the
efficiency of the steam
cycles. Thus, these need to be taken into consideration in
setting minimum efficiency
standards for Saudi Arabia. We recommend a minimum
efficiency standard of 36% for new
gas turbines and 52% for CCGT.
OCGT power plants will still be required to meet peak demand.
However, it is obvious that
significant improvements in the overall efficiency level and
reduction in energy
consumption can be achieved by building more CCGT power
plants. Considering a
situation where all newly-built power plants to 2030 are CCGT,
oil savings of 140 million
www.intechopen.com
Energy Efficiency – A Bridge to Low Carbon Economy
302
barrels of oil/year can be achieved. This corresponds to revenue
of $Bn11/year at current oil
prices.
9.3 Minimum overall efficiency standard for co-generation
desalination plants
Desalinated water demand in Saudi Arabia is expected to
increase over the next two
decades with an additional 20-30 desalination plants required by
2030. Desalination plants
are energy-intensive with heat being the major requirement for
multistage flash
vaporisation. Many desalination plants in Saudi Arabia use heat
from co-generation units
where electricity is also generated and exported to the grid. In
2008, 19 TWh of electricity
and about 1.2 Billion m3 of water were delivered from co-
generation desalination plants.
A minimum overall efficiency (heat + electricity) of 80% is
recommended for Saudi co-
generation plants. This will ensure higher utilisation of
available heat and consequently
potentially more desalinated water for the same amount of
electricity generated. Analysis of
available data from Saudi co-generation desalination plants
shows that power-to-water ratio
(PWR) is on average 1600 MWe per million m3 of desalinated
water. Depending on the
prime mover used in co-generation, PWR can be as high as 4000
MWe per million m3 of
desalinated water. This shows that there is a scope for
improving power output from Saudi
Desalination plants.
9.4 Implementation of a renewable energy programme to
displace fossil fuels
Analysis for the current report shows that there is a great
potential for solar energy in Saudi
Arabia. A photovoltaic area of 22 – 40 km2 in Saudi Arabia can
produce as much electricity
as a 1000 MWe oil-fired power station. We have shown that if
subsidy on oil is removed
then, at current oil prices (assuming $80/barrel), electricity
from PV in Saudi Arabia can be
more competitive than electricity from oil-fired power
generation. Our estimates show that
in order to stimulate PV in Saudi Arabia, an incentive
equivalent to approximately 64
Halalah/kWh needs to be introduced.
Our review of renewable energy options for Saudi Arabia also
showed a great potential for
solar thermal applications. Solar electricity generating systems
(solar thermal concentrators)
can achieve conversion efficiencies of 18-30%. Solar absorption
cooling where thermal
energy from the sun is used for re-generation in absorption
chillers is another possible
application. Despite its great potential, the wide scale
deployment of solar energy in Saudi
Arabia faces several barriers. These include lack of incentives,
high costs (considering
current subsidies on oil), lack of public knowledge, and lack of
professional training.
10. Initiatives for reducing energy consumption on the demand
side
10.1 Introduction and implementation of a new energy
conservation law
An energy conservation law in Saudi Arabia will assist in
facilitating energy savings
throughout society improving efficiency and economic benefits
of energy use. In this context,
energy conservation refers to the reduction of loss and waste in
various energy stages from
energy production to energy consumption and the use of energy
more efficiently and
rationally by strengthening management of energy use by
adopting technologies which are
technically and economically feasible and environmentally
friendly KSA can formulate energy
www.intechopen.com
Energy Efficiency Initiatives for Saudi Arabia on Supply and
Demand Sides
303
conservation policies and plans which can then be incorporated
into the country’s economic
and social development program. KSA can also develop
programmes to enhance and
encourage research in the science of energy conservation. An
energy conservation authority
can be created to become in charge of the supervision and
management of the energy
conservation work throughout the country. In addition, the
construction of new industrial
projects exploiting technologies with excessive energy
consumption and severe waste of
energy should be prohibited and monitored by this authority.
National standards for energy conservation should be
established and published. For
sectors which are not covered by the national standards,
relevant sectional standards of
energy conservation should be established and filed with the
standardization authority.
The following policies on energy conservation technologies
should be particularly
encouraged
demonstrated their maturity and
economic benefits.
-generation of thermal power and district cooling and co-
supply of heat from co-
generation to industrial processes.
pumping equipment in
the industrial sector by developing speed adjustable motors for
energy savings and
electrical and electronic energy-saving technologies for electric
power.
10.2 Introduction and implementation of building regulations
About two thirds of the electric energy generated in Saudi
Arabia is used for operating
buildings. More than 60% of this energy is used in air
conditioning. This high consumption
of electricity combined with escalating energy prices has
created a need for the introduction
of energy conservation measures in buildings in KSA. While a
Saudi building code exists,
this needs to be enforced so that actual savings can be achieved.
Since the main purpose of
building regulations in KSA would be to reduce cooling
demand, they should consider
establishing building designs which encourage the
implementation of energy-saving
measures. This should cover the types of construction
structures, materials, facilities and
products which improve building designs and at the same time
reduce cooling energy
consumption and lighting.
Building regulations in Saudi Arabia should
component of the design,
construction and operation of the building
ide the means for inspection and monitoring of energy
efficient measures during
the construction phase and afterwards during the operation of
the building
an important requirement
for approval
11. Scenario analysis and potential oil savings
This section gives brief analysis of two scenarios for reducing
primary energy consumption
and consequently oil consumption based on the policy
initiatives discussed above. Two
www.intechopen.com
Energy Efficiency – A Bridge to Low Carbon Economy
304
different scenarios are considered to illustrate how the growth
in primary energy demand
might be constrained. Both scenarios are compared with the
Business As Usual (BAU)
scenario presented in Section 5 which assumes the current
predicted rate of growth will be
reached by 2030. The two scenarios represent a lower,
conservative estimate, Low Primary
Energy Conservation (LPEC), and an upper estimate, High
Primary Energy Conservation
(HPEC). The upper estimate assumes that a more ambitious
reduction can be achieved. Both
scenarios include a combination of energy supply, energy
demand and some renewable
energy.
In the power generation sector, several options are considered
for reducing energy
consumption. These include the following
1. Improving the power generation efficiency by increasing the
share of CCGT capacity is
considered. Currently CCGT makes only 7% of the total
generation capacity. CCGT is
the most effective natural gas-based power generation
technology with efficiency of at
least 50%. For CCGT in KSA, an additional benefit can be
recognised. Currently, 45% of
power generation is natural-gas-based and if more natural gas-
based power plants are
built, more oil can be released for export. Two levels of CCGT
are considered here. An
additional 35 GW of power generation capacity is required in
the next two decades. In
the LPEC scenario, an additional 5 GW of CCGT is considered
while in the HPEC
scenario, an additional 30 GW is considered.
2. Reducing electricity consumption by (a) improving appliance
efficiency and (b) utilising
electricity conservation measures in order to reduce
cooling/heating load in the
residential, commercial, and other sectors. The LPEC scenario
considers a reduction of
5% in electricity consumption which can then be translated into
primary energy
savings. The HPEC scenario considers 10% reduction in
electricity consumption.
3. Using renewable energy for generating electricity. This paper
focuses on PV as a means
for generating electricity. The LPEC scenario considers 1 GW
of PV. At current PV
module prices, this corresponds to investment costs of $4-6
billion, a saving of 5 million
barrel of oil per year which can be directed for export and CO2
savings of 2.1 Mt/year.
The HPEC scenario considers a 5 GW of PV capacity which
corresponds to investment costs
of $20-30 billion. These costs, however, are expected to
decrease as the rate of production
increases. A PV capacity of 5 GW would displace 5 million
barrels of oil per year (worth
$300 - $400 million based on current international oil prices)
for export and save 5 Mt/year
of CO2.The desalination sector in KSA uses about 11% of the
total primary energy
consumption. As shown in Section 4.3, this is also expected to
be the case in 2030 with
primary energy consumption reaching 325 TWh in 2030 in order
to satisfy the increasing
demand for water.
In KSA, currently 153 TWh are consumed in the desalination
sector producing 19 TWhe of
electricity and 1135 m3 of desalinated water/year. The LPEC
scenario assumes a reduction
of 5% in primary energy in the desalination sector while the
HPEC scenario assumes a
reduction of 10%. Reducing energy consumption in the
desalination sector can be achieved
in several ways:
thermal energy required by
desalination plants. In membrane desalination plants (such as
reverse osmosis)
electrical energy is required to operate the pumps and
desalination units. In thermal
www.intechopen.com
Energy Efficiency Initiatives for Saudi Arabia on Supply and
Demand Sides
305
distillation plants, both electrical and thermal energy are
required and so both solar PV
and solar thermal applications can be utilised.
water.
lead to lower primary
energy consumption in the desalination sector.
In the BAU scenario, primary energy consumption in the
industrial sector amounts to 379
TWh. The LPEC scenario assumes a modest reduction of 5%
while the HPEC scenario
assumes that a 10% reduction could be achieved.A summary of
the assumptions used for
these two scenarios is shown in Table 5. Figure 10 compares the
LPEC and HPEC scenarios
with the BAU scenario.
Sector
Reduction measure by 2030
LPEC
scenario
HPEC
scenario
Power generation Additional CCGT, GW 5 30
Reduction in Electricity
consumption
5% 10%
Solar PV, GW 1 5
Desalination Reduction in primary energy
consumption, %
5% 10%
Industry Reduction in primary energy
consumption, %
5% 10%
Table 5. Assumptions for the low and high energy conservation
scenarios.
0
200
400
600
800
1000
1200
1400
1600
1800
2000
Current mix 2030 BAU 2030 LPEC 2030 HPEC
Primary
energy,
TWh/year
Power Sector Desalination Industry
111%
increase
5% reduction in PE
16% reduction in
PE
Fig. 10. Reduction in total primary energy according to scenario
1 (LPEC) and scenario 2
(HPEC).
www.intechopen.com
Energy Efficiency – A Bridge to Low Carbon Economy
306
Under the LPEC scenario, a total primary energy saving of only
5% from all the proposed
measures would be achieved compared with BAU. Under the
more ambitious HPEC
scenario, a reduction of 16% could be achieved. A summary of
the results is given in Tables
6 and 7. Table 6 shows that significant oil savings and
additional revenue from export can be
achieved from even the “low primary energy conservation”
scenario. Also Table 6 shows
the potential CO2 savings associated with energy savings in
each of the scenarios. The CO2
savings associated with oil savings in the HPEC scenario are
13% of the total emissions in
2030. These figures account for the difference in CO2 emissions
between oil and natural gas-
fired generation.
Sector BAU LPEC HPEC
Primary energy consumption, TWh/year 1912 1820 1597
% power 63 63 60
% desalination 17 17 18
% industry 20 20 22
% Reduction from BAU - 5% 16%
Oil savings compared to BAU, M barrels/y - 54 185
Additional revenue at today’s oil prices,
$Billion/year
- 4.3 14.8
CO2 savings associated with oil savings, Mt
CO2/y
- 92 126
Table 6. Comparing LPEC and HPEC scenarios to BAU scenario
in KSA.
Base case assumption
Potential PE savings
TWh/year
PE savings
compared to BAU,
%
5 GW of CCGT 12 0.6%
30 GW of CCGT 123 6.4%
1 GW of PV 11 0.6%
5 GW of PV 55 2.8%
5% reduction in electricity consumption 34 1.8%
10% reduction in electricity consumption 67 3.5%
Improving co-generation efficiency from
60% to 65%
16 0.8%
Improving desalination efficiency by
12% (from 60% to 67%)
32 1.7%
10% reduction in industrial primary
energy consumption
38 2%
Table 7. The effect of changing each of the parameters in
comparison to BAU scenario.
It is clear from Table 7that most savings can be achieved by
changing the mix of the power
generation sector. The construction of CCGT power plants in
the future can lead to
significant savings in primary energy and to also additional oil
exports. Electricity efficiency
www.intechopen.com
Energy Efficiency Initiatives for Saudi Arabia on Supply and
Demand Sides
307
improvements in the residential, commercial and industrial
sectors offer the next most
significant savings
12. Conclusion
This paper presented different affordable initiatives for
reducing energy consumption on
both sides of energy supply and demand. Also, the paper
proposed two scenarios which
have been considered to demonstrate the effectiveness of
combination of measures
including fuel switching, energy efficiency and solar energy.
Each scenario compared the
savings that could be achieved relative to Business As Usual
(BAU), which assumes
contained unconstrained growth until 2030. The first scenario
includes 5 GW of new
Combined Cycle Gas Turbines(CCGT), 1 GW of Photo Voltaic
(PV) and only a 5 %
improvement in energy efficiency. The total primary energy
would be reduced by 5 %
compared with BAU. A second ambitious scenario which
includes 30 GW of CCGT, 5 GW of
PV and a 10 % improvement from energy efficiency measures
would lead to an estimated 16
% reduction compared with BAU.
13. References
Abdel-Jawad,Mahmoud. (2001). Energy sources for coupling
with desalination plants in the GCC
countries, report. ESCWA.
Alowaidh, M., and Alnutifi, A., (2010). Technology-Based
Improvement for KSA Energy
Intensity, Internal Report, Saudi Aramco.
Electricity and Cogeneration Regulatory Authority.
(2008).Updated Generation Planning for
Saudi Electricity Sector. Report. Riyadh.
Electricity and Cogeneration Regulatory Authority. (2009).
General Directorate, Economy and
Tariff Affairs, Annual Statistical Booklet on Electricity
Industry. Riyadh.
Electricity Cogeneration Regulatory Authority.(2006). Updated
Generation Planning for Saudi
Electricity Sector. Saudi Arabia.
Elhadj,Elie. (2004). Household water and sanitation services in
Saudi Arabia: an analysis of
economic, political and ecological issues, SOAS Water
Research Group, Jeddah.
International Energy Agency. (2006a). Energy Balances of
OECD Countries. Statistics Division,
International Energy Agency.
International Energy Agency. (2006b). Economic Indicators and
Energy Balances of Non-OECD
Countries. Statistics Division.
International Energy Agency. (2009). Energy Balances of OECD
Countries. Statistics Division.
Liebendorfer, K.M., Andrepont, J.S. (2005). Cooling the Hot
Desert Wind: Turbine Inlet Cooling
with Thermal Energy Storage (TES) Increases Net Power Plant
Output 30%, Proceedings
of the ASHRAE Annual Meeting, ASHRAE Transactions,
Volume 111, Part 2.
Ministry of Water and Electricity. (2006). Electricity Growth
and Development in the Kingdom of
Saudi Arabia, Annual Report, Saudi Arabia.
Ministry Of Water and Electricity. (2009).Electricity Growth
and Development in the Kingdom of
Saudi Arabia, Annual Report, Riyadh.
National Energy Efficiency Program. (2006). Discovering
Business Opportunities in the Energy
Services Industry, Second Workshop, Riyadh, Saudi Arabia.
National Energy Efficiency Program. (2010). Energy Efficiency
Opportunities in the Kingdom of
Saudi Arabia, Report , Saudi Arabia.
www.intechopen.com
Energy Efficiency – A Bridge to Low Carbon Economy
308
Said,S., ElAmin,I. and AlShehri,A. (2205). Renewable energy
potentials in Saudi Arabia. Report.
Saudi Arabia.
Saudi Arabia Standards Organization. (2005). Energy Labelling
and Minimum Energy
Performance Requirements for Air-Conditioners, Standard No.
3459, Saudi Arabia.
Saudi Arabia Standards Organization. (2006). Energy Labelling
Requirements of Household
Electrical Clothes Washing Machines. Standard No. 3569, Saudi
Arabia.
Saudi Arabia Standards Organization.(2007). Energy
Performance Capacity and Labelling of
Household Refrigerators, Refrigerator-Freezers, and Freezers,
Standard No. 3620, Saudi
Arabia.
Saudi Arabian Standards Organization. (2005). Energy
Labelling and Minimum Energy
Performance Requirements for Air‐Conditioners. Standard 3459,
Saudi Arabia.
Saudi Electricity Company. (2009). Annual Report, Riyadh.
Saudi Electricity Company.(2010). Annual Report, Riyadh.
World Bank. (2007). World Development Indicators, Report,
Washington, D.C.
www.intechopen.com
Energy Efficiency - A Bridge to Low Carbon Economy
Edited by Dr. Zoran Morvaj
ISBN 978-953-51-0340-0
Hard cover, 344 pages
Publisher InTech
Published online 16, March, 2012
Published in print edition March, 2012
InTech Europe
University Campus STeP Ri
Slavka Krautzeka 83/A
51000 Rijeka, Croatia
Phone: +385 (51) 770 447
Fax: +385 (51) 686 166
www.intechopen.com
InTech China
Unit 405, Office Block, Hotel Equatorial Shanghai
No.65, Yan An Road (West), Shanghai, 200040, China
Phone: +86-21-62489820
Fax: +86-21-62489821
Energy efficiency is finally a common sense term. Nowadays
almost everyone knows that using energy more
efficiently saves money, reduces the emissions of greenhouse
gasses and lowers dependence on imported
fossil fuels. We are living in a fossil age at the peak of its
strength. Competition for securing resources for
fuelling economic development is increasing, price of fuels will
increase while availability of would gradually
decline. Small nations will be first to suffer if caught
unprepared in the midst of the struggle for resources
among the large players. Here it is where energy efficiency has
a potential to lead toward the natural next step
- transition away from imported fossil fuels! Someone said that
the only thing more harmful then fossil fuel is
fossilized thinking. It is our sincere hope that some of chapters
in this book will influence you to take a fresh
look at the transition to low carbon economy and the role that
energy efficiency can play in that process.
How to reference
In order to correctly reference this scholarly work, feel free to
copy and paste the following:
Y. Alyousef and M. Abu-ebid (2012). Energy Efficiency
Initiatives for Saudi Arabia on Supply and Demand
Sides, Energy Efficiency - A Bridge to Low Carbon Economy,
Dr. Zoran Morvaj (Ed.), ISBN: 978-953-51-0340-
0, InTech, Available from:
http://www.intechopen.com/books/energy-efficiency-a-bridge-
to-low-carbon-
economy/energy-efficiency-initiatives-for-saudi-arabia-on-
supply-and-demand-sides
© 2012 The Author(s). Licensee IntechOpen. This is an open
access article
distributed under the terms of the Creative Commons
Attribution 3.0
License, which permits unrestricted use, distribution, and
reproduction in
any medium, provided the original work is properly cited.
http://creativecommons.org/licenses/by/3.0

More Related Content

Similar to 13 Energy Efficiency Initiatives for Saudi Arabia on Su.docx

New base 30 november 2021 energy news issue 1472 by khaled al awadi
New base  30 november  2021 energy news issue   1472  by khaled al awadiNew base  30 november  2021 energy news issue   1472  by khaled al awadi
New base 30 november 2021 energy news issue 1472 by khaled al awadiKhaled Al Awadi
 
The role of Saudi Arabia in Global Energy Markets
The role of Saudi Arabia in Global Energy MarketsThe role of Saudi Arabia in Global Energy Markets
The role of Saudi Arabia in Global Energy MarketsEdouardLotz
 
New base special 28 september 2014
New base special  28 september   2014New base special  28 september   2014
New base special 28 september 2014Khaled Al Awadi
 
indian energy sector overview
indian energy sector overviewindian energy sector overview
indian energy sector overviewshivraj negi
 
Energy Sector of Bangladesh
Energy Sector of Bangladesh Energy Sector of Bangladesh
Energy Sector of Bangladesh Md. Rasadul Islam
 
New base energy news 28 may 2020 issue no. 1342 senior editor eng. khaled ...
New base energy news 28 may  2020   issue no. 1342 senior editor eng. khaled ...New base energy news 28 may  2020   issue no. 1342 senior editor eng. khaled ...
New base energy news 28 may 2020 issue no. 1342 senior editor eng. khaled ...Khaled Al Awadi
 
World Energy Outlook 2016 - Executive Summary
World Energy Outlook 2016 - Executive SummaryWorld Energy Outlook 2016 - Executive Summary
World Energy Outlook 2016 - Executive SummaryMarcellus Drilling News
 
Hydrogen Generation Market.pdf
Hydrogen Generation Market.pdfHydrogen Generation Market.pdf
Hydrogen Generation Market.pdfgeetabhandari8
 
New base 481 special 18 november 2014
New base 481 special  18 november  2014New base 481 special  18 november  2014
New base 481 special 18 november 2014Khaled Al Awadi
 
New base 578 special 08 april 2015
New base 578 special  08 april  2015New base 578 special  08 april  2015
New base 578 special 08 april 2015Khaled Al Awadi
 
The Changing Joule Dynamic | Accenture
The Changing Joule Dynamic | AccentureThe Changing Joule Dynamic | Accenture
The Changing Joule Dynamic | Accentureaccenture
 
Microsoft word new base 994 special 02 february 2017 energy news
Microsoft word   new base 994 special 02 february 2017 energy newsMicrosoft word   new base 994 special 02 february 2017 energy news
Microsoft word new base 994 special 02 february 2017 energy newsKhaled Al Awadi
 
New base march 07 2022 energy news issue - 1492 by khaled al awadi
New base march 07 2022  energy news issue - 1492  by khaled al awadiNew base march 07 2022  energy news issue - 1492  by khaled al awadi
New base march 07 2022 energy news issue - 1492 by khaled al awadiKhaled Al Awadi
 
New base 18 january 2018 energy news issue 1129 by khaled al awadi
New base 18 january 2018 energy news issue   1129  by khaled al awadiNew base 18 january 2018 energy news issue   1129  by khaled al awadi
New base 18 january 2018 energy news issue 1129 by khaled al awadiKhaled Al Awadi
 
Mark Walkington on the Ministry of Economic Development's energy projections
Mark Walkington on the Ministry of Economic Development's energy projectionsMark Walkington on the Ministry of Economic Development's energy projections
Mark Walkington on the Ministry of Economic Development's energy projectionsmhjbnz
 
New base 26 septempber 2021 energy news issue 1458 by khaled al awadi
New base  26 septempber 2021 energy news issue   1458  by khaled al awadiNew base  26 septempber 2021 energy news issue   1458  by khaled al awadi
New base 26 septempber 2021 energy news issue 1458 by khaled al awadiKhaled Al Awadi
 
Issues and challenges with renewable energy in oman
Issues and challenges with renewable energy in omanIssues and challenges with renewable energy in oman
Issues and challenges with renewable energy in omaneSAT Publishing House
 
New base energy news 05 january 2020 issue no. 1307 - senior editor eng. kh...
New base energy news 05 january 2020   issue no. 1307 - senior editor eng. kh...New base energy news 05 january 2020   issue no. 1307 - senior editor eng. kh...
New base energy news 05 january 2020 issue no. 1307 - senior editor eng. kh...Khaled Al Awadi
 

Similar to 13 Energy Efficiency Initiatives for Saudi Arabia on Su.docx (20)

New base 30 november 2021 energy news issue 1472 by khaled al awadi
New base  30 november  2021 energy news issue   1472  by khaled al awadiNew base  30 november  2021 energy news issue   1472  by khaled al awadi
New base 30 november 2021 energy news issue 1472 by khaled al awadi
 
The role of Saudi Arabia in Global Energy Markets
The role of Saudi Arabia in Global Energy MarketsThe role of Saudi Arabia in Global Energy Markets
The role of Saudi Arabia in Global Energy Markets
 
New base special 28 september 2014
New base special  28 september   2014New base special  28 september   2014
New base special 28 september 2014
 
indian energy sector overview
indian energy sector overviewindian energy sector overview
indian energy sector overview
 
SAUDI ARABIA.pptx
SAUDI ARABIA.pptxSAUDI ARABIA.pptx
SAUDI ARABIA.pptx
 
Energy Sector of Bangladesh
Energy Sector of Bangladesh Energy Sector of Bangladesh
Energy Sector of Bangladesh
 
New base energy news 28 may 2020 issue no. 1342 senior editor eng. khaled ...
New base energy news 28 may  2020   issue no. 1342 senior editor eng. khaled ...New base energy news 28 may  2020   issue no. 1342 senior editor eng. khaled ...
New base energy news 28 may 2020 issue no. 1342 senior editor eng. khaled ...
 
World Energy Outlook 2016 - Executive Summary
World Energy Outlook 2016 - Executive SummaryWorld Energy Outlook 2016 - Executive Summary
World Energy Outlook 2016 - Executive Summary
 
Hydrogen Generation Market.pdf
Hydrogen Generation Market.pdfHydrogen Generation Market.pdf
Hydrogen Generation Market.pdf
 
New base 481 special 18 november 2014
New base 481 special  18 november  2014New base 481 special  18 november  2014
New base 481 special 18 november 2014
 
New base 578 special 08 april 2015
New base 578 special  08 april  2015New base 578 special  08 april  2015
New base 578 special 08 april 2015
 
The Changing Joule Dynamic | Accenture
The Changing Joule Dynamic | AccentureThe Changing Joule Dynamic | Accenture
The Changing Joule Dynamic | Accenture
 
Microsoft word new base 994 special 02 february 2017 energy news
Microsoft word   new base 994 special 02 february 2017 energy newsMicrosoft word   new base 994 special 02 february 2017 energy news
Microsoft word new base 994 special 02 february 2017 energy news
 
New base march 07 2022 energy news issue - 1492 by khaled al awadi
New base march 07 2022  energy news issue - 1492  by khaled al awadiNew base march 07 2022  energy news issue - 1492  by khaled al awadi
New base march 07 2022 energy news issue - 1492 by khaled al awadi
 
Blue Crude 19-2
Blue Crude 19-2Blue Crude 19-2
Blue Crude 19-2
 
New base 18 january 2018 energy news issue 1129 by khaled al awadi
New base 18 january 2018 energy news issue   1129  by khaled al awadiNew base 18 january 2018 energy news issue   1129  by khaled al awadi
New base 18 january 2018 energy news issue 1129 by khaled al awadi
 
Mark Walkington on the Ministry of Economic Development's energy projections
Mark Walkington on the Ministry of Economic Development's energy projectionsMark Walkington on the Ministry of Economic Development's energy projections
Mark Walkington on the Ministry of Economic Development's energy projections
 
New base 26 septempber 2021 energy news issue 1458 by khaled al awadi
New base  26 septempber 2021 energy news issue   1458  by khaled al awadiNew base  26 septempber 2021 energy news issue   1458  by khaled al awadi
New base 26 septempber 2021 energy news issue 1458 by khaled al awadi
 
Issues and challenges with renewable energy in oman
Issues and challenges with renewable energy in omanIssues and challenges with renewable energy in oman
Issues and challenges with renewable energy in oman
 
New base energy news 05 january 2020 issue no. 1307 - senior editor eng. kh...
New base energy news 05 january 2020   issue no. 1307 - senior editor eng. kh...New base energy news 05 january 2020   issue no. 1307 - senior editor eng. kh...
New base energy news 05 january 2020 issue no. 1307 - senior editor eng. kh...
 

More from durantheseldine

Angela’s Ashes​ - Murasaki Shikibu said that the novel happens be.docx
Angela’s Ashes​ - Murasaki Shikibu said that the novel happens be.docxAngela’s Ashes​ - Murasaki Shikibu said that the novel happens be.docx
Angela’s Ashes​ - Murasaki Shikibu said that the novel happens be.docxdurantheseldine
 
ANG1922, Winter 2016Essay 02 InstructionsYour second e.docx
ANG1922, Winter 2016Essay 02 InstructionsYour second e.docxANG1922, Winter 2016Essay 02 InstructionsYour second e.docx
ANG1922, Winter 2016Essay 02 InstructionsYour second e.docxdurantheseldine
 
Anecdotal Records Anecdotal Record Developmental Domain__ _.docx
Anecdotal Records Anecdotal Record Developmental Domain__      _.docxAnecdotal Records Anecdotal Record Developmental Domain__      _.docx
Anecdotal Records Anecdotal Record Developmental Domain__ _.docxdurantheseldine
 
Andy and Beth are neighbors in a small duplex. In the evenings after.docx
Andy and Beth are neighbors in a small duplex. In the evenings after.docxAndy and Beth are neighbors in a small duplex. In the evenings after.docx
Andy and Beth are neighbors in a small duplex. In the evenings after.docxdurantheseldine
 
Andrew John De Los SantosPUP 190SOS 111 Sustainable CitiesMar.docx
Andrew John De Los SantosPUP 190SOS 111 Sustainable CitiesMar.docxAndrew John De Los SantosPUP 190SOS 111 Sustainable CitiesMar.docx
Andrew John De Los SantosPUP 190SOS 111 Sustainable CitiesMar.docxdurantheseldine
 
Android Permissions DemystifiedAdrienne Porter Felt, Erika.docx
Android Permissions DemystifiedAdrienne Porter Felt, Erika.docxAndroid Permissions DemystifiedAdrienne Porter Felt, Erika.docx
Android Permissions DemystifiedAdrienne Porter Felt, Erika.docxdurantheseldine
 
ANDREW CARNEGIE PRINCE OF STEELNARRATOR On November 25th, 1835 i.docx
ANDREW CARNEGIE PRINCE OF STEELNARRATOR On November 25th, 1835 i.docxANDREW CARNEGIE PRINCE OF STEELNARRATOR On November 25th, 1835 i.docx
ANDREW CARNEGIE PRINCE OF STEELNARRATOR On November 25th, 1835 i.docxdurantheseldine
 
Andrew CassidySaint Leo UniversityContemporary Issues in Crimina.docx
Andrew CassidySaint Leo UniversityContemporary Issues in Crimina.docxAndrew CassidySaint Leo UniversityContemporary Issues in Crimina.docx
Andrew CassidySaint Leo UniversityContemporary Issues in Crimina.docxdurantheseldine
 
andrea lunsfordstanford universitymichal brodysono.docx
andrea lunsfordstanford universitymichal brodysono.docxandrea lunsfordstanford universitymichal brodysono.docx
andrea lunsfordstanford universitymichal brodysono.docxdurantheseldine
 
Andrea Azpiazo – Review One. Little Havana Multifamily Developme.docx
Andrea Azpiazo – Review One.  Little Havana Multifamily Developme.docxAndrea Azpiazo – Review One.  Little Havana Multifamily Developme.docx
Andrea Azpiazo – Review One. Little Havana Multifamily Developme.docxdurantheseldine
 
And what we students of history always learn is that the human bein.docx
And what we students of history always learn is that the human bein.docxAnd what we students of history always learn is that the human bein.docx
And what we students of history always learn is that the human bein.docxdurantheseldine
 
and Contradiction in Architecture Robert Venturi .docx
and Contradiction in Architecture Robert Venturi .docxand Contradiction in Architecture Robert Venturi .docx
and Contradiction in Architecture Robert Venturi .docxdurantheseldine
 
Ancient Egypt1The Civilization of the Nile River V.docx
Ancient Egypt1The Civilization of the Nile River V.docxAncient Egypt1The Civilization of the Nile River V.docx
Ancient Egypt1The Civilization of the Nile River V.docxdurantheseldine
 
Anayze a landmark case. The assesment should include a full discussi.docx
Anayze a landmark case. The assesment should include a full discussi.docxAnayze a landmark case. The assesment should include a full discussi.docx
Anayze a landmark case. The assesment should include a full discussi.docxdurantheseldine
 
Anatomy and Physiology of the Digestive SystemObjectives· Iden.docx
Anatomy and Physiology of the Digestive SystemObjectives· Iden.docxAnatomy and Physiology of the Digestive SystemObjectives· Iden.docx
Anatomy and Physiology of the Digestive SystemObjectives· Iden.docxdurantheseldine
 
ANAThe Article Review by Jeanette Keith on Book by Stephanie McCu.docx
ANAThe Article  Review by Jeanette Keith on Book by Stephanie McCu.docxANAThe Article  Review by Jeanette Keith on Book by Stephanie McCu.docx
ANAThe Article Review by Jeanette Keith on Book by Stephanie McCu.docxdurantheseldine
 
Analyzing workers social networking behavior – an invasion of priva.docx
Analyzing workers social networking behavior – an invasion of priva.docxAnalyzing workers social networking behavior – an invasion of priva.docx
Analyzing workers social networking behavior – an invasion of priva.docxdurantheseldine
 
Analyzing and Visualizing Data Chapter 6Data Represent.docx
Analyzing and Visualizing Data Chapter 6Data Represent.docxAnalyzing and Visualizing Data Chapter 6Data Represent.docx
Analyzing and Visualizing Data Chapter 6Data Represent.docxdurantheseldine
 
Analyzing and Visualizing Data Chapter 1The .docx
Analyzing and Visualizing Data Chapter 1The .docxAnalyzing and Visualizing Data Chapter 1The .docx
Analyzing and Visualizing Data Chapter 1The .docxdurantheseldine
 
Analyzing a Primary Source RubricName ______________________.docx
Analyzing a Primary Source RubricName ______________________.docxAnalyzing a Primary Source RubricName ______________________.docx
Analyzing a Primary Source RubricName ______________________.docxdurantheseldine
 

More from durantheseldine (20)

Angela’s Ashes​ - Murasaki Shikibu said that the novel happens be.docx
Angela’s Ashes​ - Murasaki Shikibu said that the novel happens be.docxAngela’s Ashes​ - Murasaki Shikibu said that the novel happens be.docx
Angela’s Ashes​ - Murasaki Shikibu said that the novel happens be.docx
 
ANG1922, Winter 2016Essay 02 InstructionsYour second e.docx
ANG1922, Winter 2016Essay 02 InstructionsYour second e.docxANG1922, Winter 2016Essay 02 InstructionsYour second e.docx
ANG1922, Winter 2016Essay 02 InstructionsYour second e.docx
 
Anecdotal Records Anecdotal Record Developmental Domain__ _.docx
Anecdotal Records Anecdotal Record Developmental Domain__      _.docxAnecdotal Records Anecdotal Record Developmental Domain__      _.docx
Anecdotal Records Anecdotal Record Developmental Domain__ _.docx
 
Andy and Beth are neighbors in a small duplex. In the evenings after.docx
Andy and Beth are neighbors in a small duplex. In the evenings after.docxAndy and Beth are neighbors in a small duplex. In the evenings after.docx
Andy and Beth are neighbors in a small duplex. In the evenings after.docx
 
Andrew John De Los SantosPUP 190SOS 111 Sustainable CitiesMar.docx
Andrew John De Los SantosPUP 190SOS 111 Sustainable CitiesMar.docxAndrew John De Los SantosPUP 190SOS 111 Sustainable CitiesMar.docx
Andrew John De Los SantosPUP 190SOS 111 Sustainable CitiesMar.docx
 
Android Permissions DemystifiedAdrienne Porter Felt, Erika.docx
Android Permissions DemystifiedAdrienne Porter Felt, Erika.docxAndroid Permissions DemystifiedAdrienne Porter Felt, Erika.docx
Android Permissions DemystifiedAdrienne Porter Felt, Erika.docx
 
ANDREW CARNEGIE PRINCE OF STEELNARRATOR On November 25th, 1835 i.docx
ANDREW CARNEGIE PRINCE OF STEELNARRATOR On November 25th, 1835 i.docxANDREW CARNEGIE PRINCE OF STEELNARRATOR On November 25th, 1835 i.docx
ANDREW CARNEGIE PRINCE OF STEELNARRATOR On November 25th, 1835 i.docx
 
Andrew CassidySaint Leo UniversityContemporary Issues in Crimina.docx
Andrew CassidySaint Leo UniversityContemporary Issues in Crimina.docxAndrew CassidySaint Leo UniversityContemporary Issues in Crimina.docx
Andrew CassidySaint Leo UniversityContemporary Issues in Crimina.docx
 
andrea lunsfordstanford universitymichal brodysono.docx
andrea lunsfordstanford universitymichal brodysono.docxandrea lunsfordstanford universitymichal brodysono.docx
andrea lunsfordstanford universitymichal brodysono.docx
 
Andrea Azpiazo – Review One. Little Havana Multifamily Developme.docx
Andrea Azpiazo – Review One.  Little Havana Multifamily Developme.docxAndrea Azpiazo – Review One.  Little Havana Multifamily Developme.docx
Andrea Azpiazo – Review One. Little Havana Multifamily Developme.docx
 
And what we students of history always learn is that the human bein.docx
And what we students of history always learn is that the human bein.docxAnd what we students of history always learn is that the human bein.docx
And what we students of history always learn is that the human bein.docx
 
and Contradiction in Architecture Robert Venturi .docx
and Contradiction in Architecture Robert Venturi .docxand Contradiction in Architecture Robert Venturi .docx
and Contradiction in Architecture Robert Venturi .docx
 
Ancient Egypt1The Civilization of the Nile River V.docx
Ancient Egypt1The Civilization of the Nile River V.docxAncient Egypt1The Civilization of the Nile River V.docx
Ancient Egypt1The Civilization of the Nile River V.docx
 
Anayze a landmark case. The assesment should include a full discussi.docx
Anayze a landmark case. The assesment should include a full discussi.docxAnayze a landmark case. The assesment should include a full discussi.docx
Anayze a landmark case. The assesment should include a full discussi.docx
 
Anatomy and Physiology of the Digestive SystemObjectives· Iden.docx
Anatomy and Physiology of the Digestive SystemObjectives· Iden.docxAnatomy and Physiology of the Digestive SystemObjectives· Iden.docx
Anatomy and Physiology of the Digestive SystemObjectives· Iden.docx
 
ANAThe Article Review by Jeanette Keith on Book by Stephanie McCu.docx
ANAThe Article  Review by Jeanette Keith on Book by Stephanie McCu.docxANAThe Article  Review by Jeanette Keith on Book by Stephanie McCu.docx
ANAThe Article Review by Jeanette Keith on Book by Stephanie McCu.docx
 
Analyzing workers social networking behavior – an invasion of priva.docx
Analyzing workers social networking behavior – an invasion of priva.docxAnalyzing workers social networking behavior – an invasion of priva.docx
Analyzing workers social networking behavior – an invasion of priva.docx
 
Analyzing and Visualizing Data Chapter 6Data Represent.docx
Analyzing and Visualizing Data Chapter 6Data Represent.docxAnalyzing and Visualizing Data Chapter 6Data Represent.docx
Analyzing and Visualizing Data Chapter 6Data Represent.docx
 
Analyzing and Visualizing Data Chapter 1The .docx
Analyzing and Visualizing Data Chapter 1The .docxAnalyzing and Visualizing Data Chapter 1The .docx
Analyzing and Visualizing Data Chapter 1The .docx
 
Analyzing a Primary Source RubricName ______________________.docx
Analyzing a Primary Source RubricName ______________________.docxAnalyzing a Primary Source RubricName ______________________.docx
Analyzing a Primary Source RubricName ______________________.docx
 

Recently uploaded

The basics of sentences session 2pptx copy.pptx
The basics of sentences session 2pptx copy.pptxThe basics of sentences session 2pptx copy.pptx
The basics of sentences session 2pptx copy.pptxheathfieldcps1
 
Call Girls in Dwarka Mor Delhi Contact Us 9654467111
Call Girls in Dwarka Mor Delhi Contact Us 9654467111Call Girls in Dwarka Mor Delhi Contact Us 9654467111
Call Girls in Dwarka Mor Delhi Contact Us 9654467111Sapana Sha
 
Software Engineering Methodologies (overview)
Software Engineering Methodologies (overview)Software Engineering Methodologies (overview)
Software Engineering Methodologies (overview)eniolaolutunde
 
Incoming and Outgoing Shipments in 1 STEP Using Odoo 17
Incoming and Outgoing Shipments in 1 STEP Using Odoo 17Incoming and Outgoing Shipments in 1 STEP Using Odoo 17
Incoming and Outgoing Shipments in 1 STEP Using Odoo 17Celine George
 
URLs and Routing in the Odoo 17 Website App
URLs and Routing in the Odoo 17 Website AppURLs and Routing in the Odoo 17 Website App
URLs and Routing in the Odoo 17 Website AppCeline George
 
Sanyam Choudhary Chemistry practical.pdf
Sanyam Choudhary Chemistry practical.pdfSanyam Choudhary Chemistry practical.pdf
Sanyam Choudhary Chemistry practical.pdfsanyamsingh5019
 
microwave assisted reaction. General introduction
microwave assisted reaction. General introductionmicrowave assisted reaction. General introduction
microwave assisted reaction. General introductionMaksud Ahmed
 
Grant Readiness 101 TechSoup and Remy Consulting
Grant Readiness 101 TechSoup and Remy ConsultingGrant Readiness 101 TechSoup and Remy Consulting
Grant Readiness 101 TechSoup and Remy ConsultingTechSoup
 
Concept of Vouching. B.Com(Hons) /B.Compdf
Concept of Vouching. B.Com(Hons) /B.CompdfConcept of Vouching. B.Com(Hons) /B.Compdf
Concept of Vouching. B.Com(Hons) /B.CompdfUmakantAnnand
 
Solving Puzzles Benefits Everyone (English).pptx
Solving Puzzles Benefits Everyone (English).pptxSolving Puzzles Benefits Everyone (English).pptx
Solving Puzzles Benefits Everyone (English).pptxOH TEIK BIN
 
Micromeritics - Fundamental and Derived Properties of Powders
Micromeritics - Fundamental and Derived Properties of PowdersMicromeritics - Fundamental and Derived Properties of Powders
Micromeritics - Fundamental and Derived Properties of PowdersChitralekhaTherkar
 
How to Make a Pirate ship Primary Education.pptx
How to Make a Pirate ship Primary Education.pptxHow to Make a Pirate ship Primary Education.pptx
How to Make a Pirate ship Primary Education.pptxmanuelaromero2013
 
Alper Gobel In Media Res Media Component
Alper Gobel In Media Res Media ComponentAlper Gobel In Media Res Media Component
Alper Gobel In Media Res Media ComponentInMediaRes1
 
A Critique of the Proposed National Education Policy Reform
A Critique of the Proposed National Education Policy ReformA Critique of the Proposed National Education Policy Reform
A Critique of the Proposed National Education Policy ReformChameera Dedduwage
 
Introduction to ArtificiaI Intelligence in Higher Education
Introduction to ArtificiaI Intelligence in Higher EducationIntroduction to ArtificiaI Intelligence in Higher Education
Introduction to ArtificiaI Intelligence in Higher Educationpboyjonauth
 
Industrial Policy - 1948, 1956, 1973, 1977, 1980, 1991
Industrial Policy - 1948, 1956, 1973, 1977, 1980, 1991Industrial Policy - 1948, 1956, 1973, 1977, 1980, 1991
Industrial Policy - 1948, 1956, 1973, 1977, 1980, 1991RKavithamani
 
Employee wellbeing at the workplace.pptx
Employee wellbeing at the workplace.pptxEmployee wellbeing at the workplace.pptx
Employee wellbeing at the workplace.pptxNirmalaLoungPoorunde1
 

Recently uploaded (20)

The basics of sentences session 2pptx copy.pptx
The basics of sentences session 2pptx copy.pptxThe basics of sentences session 2pptx copy.pptx
The basics of sentences session 2pptx copy.pptx
 
Call Girls in Dwarka Mor Delhi Contact Us 9654467111
Call Girls in Dwarka Mor Delhi Contact Us 9654467111Call Girls in Dwarka Mor Delhi Contact Us 9654467111
Call Girls in Dwarka Mor Delhi Contact Us 9654467111
 
Software Engineering Methodologies (overview)
Software Engineering Methodologies (overview)Software Engineering Methodologies (overview)
Software Engineering Methodologies (overview)
 
Incoming and Outgoing Shipments in 1 STEP Using Odoo 17
Incoming and Outgoing Shipments in 1 STEP Using Odoo 17Incoming and Outgoing Shipments in 1 STEP Using Odoo 17
Incoming and Outgoing Shipments in 1 STEP Using Odoo 17
 
URLs and Routing in the Odoo 17 Website App
URLs and Routing in the Odoo 17 Website AppURLs and Routing in the Odoo 17 Website App
URLs and Routing in the Odoo 17 Website App
 
Sanyam Choudhary Chemistry practical.pdf
Sanyam Choudhary Chemistry practical.pdfSanyam Choudhary Chemistry practical.pdf
Sanyam Choudhary Chemistry practical.pdf
 
TataKelola dan KamSiber Kecerdasan Buatan v022.pdf
TataKelola dan KamSiber Kecerdasan Buatan v022.pdfTataKelola dan KamSiber Kecerdasan Buatan v022.pdf
TataKelola dan KamSiber Kecerdasan Buatan v022.pdf
 
microwave assisted reaction. General introduction
microwave assisted reaction. General introductionmicrowave assisted reaction. General introduction
microwave assisted reaction. General introduction
 
Grant Readiness 101 TechSoup and Remy Consulting
Grant Readiness 101 TechSoup and Remy ConsultingGrant Readiness 101 TechSoup and Remy Consulting
Grant Readiness 101 TechSoup and Remy Consulting
 
Concept of Vouching. B.Com(Hons) /B.Compdf
Concept of Vouching. B.Com(Hons) /B.CompdfConcept of Vouching. B.Com(Hons) /B.Compdf
Concept of Vouching. B.Com(Hons) /B.Compdf
 
Solving Puzzles Benefits Everyone (English).pptx
Solving Puzzles Benefits Everyone (English).pptxSolving Puzzles Benefits Everyone (English).pptx
Solving Puzzles Benefits Everyone (English).pptx
 
Micromeritics - Fundamental and Derived Properties of Powders
Micromeritics - Fundamental and Derived Properties of PowdersMicromeritics - Fundamental and Derived Properties of Powders
Micromeritics - Fundamental and Derived Properties of Powders
 
How to Make a Pirate ship Primary Education.pptx
How to Make a Pirate ship Primary Education.pptxHow to Make a Pirate ship Primary Education.pptx
How to Make a Pirate ship Primary Education.pptx
 
Alper Gobel In Media Res Media Component
Alper Gobel In Media Res Media ComponentAlper Gobel In Media Res Media Component
Alper Gobel In Media Res Media Component
 
Model Call Girl in Tilak Nagar Delhi reach out to us at 🔝9953056974🔝
Model Call Girl in Tilak Nagar Delhi reach out to us at 🔝9953056974🔝Model Call Girl in Tilak Nagar Delhi reach out to us at 🔝9953056974🔝
Model Call Girl in Tilak Nagar Delhi reach out to us at 🔝9953056974🔝
 
A Critique of the Proposed National Education Policy Reform
A Critique of the Proposed National Education Policy ReformA Critique of the Proposed National Education Policy Reform
A Critique of the Proposed National Education Policy Reform
 
Introduction to ArtificiaI Intelligence in Higher Education
Introduction to ArtificiaI Intelligence in Higher EducationIntroduction to ArtificiaI Intelligence in Higher Education
Introduction to ArtificiaI Intelligence in Higher Education
 
Model Call Girl in Bikash Puri Delhi reach out to us at 🔝9953056974🔝
Model Call Girl in Bikash Puri  Delhi reach out to us at 🔝9953056974🔝Model Call Girl in Bikash Puri  Delhi reach out to us at 🔝9953056974🔝
Model Call Girl in Bikash Puri Delhi reach out to us at 🔝9953056974🔝
 
Industrial Policy - 1948, 1956, 1973, 1977, 1980, 1991
Industrial Policy - 1948, 1956, 1973, 1977, 1980, 1991Industrial Policy - 1948, 1956, 1973, 1977, 1980, 1991
Industrial Policy - 1948, 1956, 1973, 1977, 1980, 1991
 
Employee wellbeing at the workplace.pptx
Employee wellbeing at the workplace.pptxEmployee wellbeing at the workplace.pptx
Employee wellbeing at the workplace.pptx
 

13 Energy Efficiency Initiatives for Saudi Arabia on Su.docx

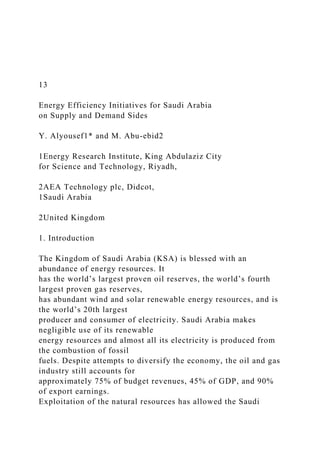
  • 1. 13 Energy Efficiency Initiatives for Saudi Arabia on Supply and Demand Sides Y. Alyousef1* and M. Abu-ebid2 1Energy Research Institute, King Abdulaziz City for Science and Technology, Riyadh, 2AEA Technology plc, Didcot, 1Saudi Arabia 2United Kingdom 1. Introduction The Kingdom of Saudi Arabia (KSA) is blessed with an abundance of energy resources. It has the world’s largest proven oil reserves, the world’s fourth largest proven gas reserves, has abundant wind and solar renewable energy resources, and is the world’s 20th largest producer and consumer of electricity. Saudi Arabia makes negligible use of its renewable energy resources and almost all its electricity is produced from the combustion of fossil fuels. Despite attempts to diversify the economy, the oil and gas industry still accounts for approximately 75% of budget revenues, 45% of GDP, and 90% of export earnings. Exploitation of the natural resources has allowed the Saudi
  • 2. government to keep energy prices low through a system of direct and indirect subsidies. The nation has benefited greatly from these policies, but together with increased prosperity and sophistication, a culture of wasteful energy usage has become established. KSA is experienced rapid economic growth over recent years. Since 2000, the energy consumption per capita has increased by more than 30%. This increase in primary energy consumption has occurred during a period of declining oil exports. In 2008, the total primary energy consumption has approximately reached 800 million barrels of oil equivalent (BOE), of which more than 60% was oil. The consumption of primary energy within the Kingdom is expected to double in 2030 leading to diminishing oil exports based on current trends (Ministry of Water and Electricity, 2009). There is widespread recognition within KSA that with growing internal demand for primary energy there will be a declining proportion of oil for export. Consequently, the national government has identified energy efficiency as a key national priority, reflecting the rapid increase in domestic consumption of petroleum products, related GHG emissions and the associated opportunity cost of lost export revenues. There is also a strategic national push to develop an energy efficiency and renewable technology R&D and manufacturing base in an attempt to diversify the economy away from fossil fuels.
  • 3. *Corresponding Author www.intechopen.com Energy Efficiency – A Bridge to Low Carbon Economy 280 2. Fossil fuel production and consumption 2.1 Oil production and consumption Saudi Arabia is the largest producer and net exporter of oil in the world with more than 10 million barrels/day produced in 2007. The state-owned oil company, Saudi Aramco, is the world’s largest oil company. The country has around 100 major oil and gas fields and more than 1500 wells. Recently, the Saudi Arabia’s Ministry of Petroleum and Mineral Resources (MPMR) announced their plan to increase the production capacity to 12.5 million barrels/day by 2009 but these plans have been delayed due to the collapse of oil price at the end of 2008 (Alowaidh, et.al, 2010). In 2008, KSA exported an estimated 8.4 million barrels/day of petroleum liquids, the majority of which was crude oil. Increasing oil exports is a national priority which can positively influence economic development and prosperity in the country. However, while Saudi Arabia has the necessary
  • 4. infrastructure to double its export capacity, oil exported over the past few years has been gradually decreasing due to increasing internal consumption. Figure 1 shows that consumption of oil within the country has been gradually increasing due to population growth, strong economic, industrial growth and subsidised prices for electricity and transport fuel. Fig. 1. Oil production, export and consumption in Saudi Arabia. Approximately 3200 million barrels of oil were produced in 2008, of which 560 million barrels (952 TWh) was consumed in the country. About 9.6% of oil consumed within KSA was used as feedstock and the rest as primary energy. As primary energy, oil was mainly used for transport (43%), power generation (39%), in co- generation desalination plants (8%), and for other uses (10%) such as for example the oil and petrochemical industry(Alowaidh, et.al, 2010). www.intechopen.com Energy Efficiency Initiatives for Saudi Arabia on Supply and Demand Sides 281 2.2 Natural gas production and consumption
  • 5. In 2008, Saudi Arabia produced 86 billion m3 (550 million barrels of oil equivalent or about 900 TWh) of natural gas of which 13% was lost in flaring. All natural gas produced was consumed within KSA as feedstock (38%), in power generation (34%), in desalination plants (11%) and in industry (17%). The production of natural gas has been increasing to fuel the growth in the petrochemical, power generation, and water desalination sectors(Alowaidh, et.al, 2010). While the majority of oil produced is exported, all natural gas produced in Saudi Arabia is used within the country. According to Saudi Aramco, the production of natural gas is expected to double to 150 billion m3in 2030. 2.3 Potential for oil savings According to independent analysis quoted in industry reports, demand for oil is expected to rise by 8 to 10% in 2010 mostly in the area of power generation. A plan which allows KSA to cut down on its oil consumption in the power generation sector and to re-direct that additional oil for export can bring about many economic and environmental benefits. Based on current growth rates, oil consumption is expected to reach 800 million barrels/year by 2030. A 10% annual reduction in oil consumption within KSA in 2030 will result in the release of 80 million barrels of oil/year for export. At today’s price of oil, this corresponds to additional revenue from oil export of $6 billion/year. This 10% reduction in
  • 6. oil consumption is a realistic target for Saudi Arabia and can be achieved through i. Energy efficiency improvement on the supply side (i.e. in power stations and industry) as well as on the demand side (i.e. reducing electricity consumption), ii. Energy and resource conservation (e.g. reducing water demand reduces energy demand in desalination plants), and iii. The utilisation of renewable energy sources such as solar and wind energy. In general, increased oil savings can be achieved by gradual fuel switching (combined with energy efficiency improvement) in the power generation and co- generation desalination sectors. The share of natural gas in these two sectors is currently 47%. If the share of natural gas in these two sectors alone increases to 60% in 2030, the potential annual oil savings can amount to 120 million barrels/year leading to additional revenue of $9 Billion/year at current oil prices. This switch from oil to gas is also associated with environmental benefits since natural gas has lower CO2 emissions than oil. 3.Overview of primary energy flow Saudi Arabia’s annual primary energy consumption increased from about 10 MWh/capita in 1971 to 47 MWh/capita in 2008(Electricity and Cogeneration Regulatory Authority,2008). Currently KSA is one of the top 15 countries in the world in
  • 7. terms of primary energy use on a per-capita basis. This significant increase in energy demand is due to rapid economic and industrial growth in Saudi Arabia over the past few decades. In 2008, the total oil and gas consumption exceeded 1 billion barrels of oil equivalent (BOE), of which approximately 23% was used as feedstock and the rest as an energy source in power generation plants, co- generation desalination plants, transport and industry. This consumption of primary energy (oil and natural gas) is expected to double over the next two decades as shown in Figure 2. www.intechopen.com Energy Efficiency – A Bridge to Low Carbon Economy 282 In 2030, oil and natural gas demand is expected to increase to more than 1500 million barrels of oil equivalent/year. As evident from Figure 2, the current share of both oil and natural gas is 63% and 37% respectively. The future share of oil and natural gas in the fuel mix in KSA will depend on policies regarding additional gas production and usage. The projection in Figure 2 assumes the same current primary energy mix in 2030. It is expected, however, that natural gas
  • 8. demand in KSA will double by 2030 thus displacing some oil usage and adding to oil exports. The total fossil fuel consumption in KSA in 2008 was approximately 1,766 TWh, 23% of which was used as feedstock in industry, and in other sectors (e.g. LPG in homes). The fuel used as feedstock is not part of the primary energy use and so it is beyond the scope of this paper. The remaining fossil fuel (77%) is used as primary energy in the power generation, water desalination, industrial and transport sectors. This paper does not include energy conservation and oil saving in the transport sector where 28% of the primary energy in KSA is consumed (mainly as oil). About 55% of the primary energy in KSA is used in power stations and desalination plants for generating electricity and desalinated water. Of this, 44% is used in power stations owned by the Saudi Electricity Company (SEC) and the remaining 11% is used in co-generation desalination plants. The remaining primary energy is consumed in the industrial sector (11%) and other sectors (6%) such as agriculture and construction(Saudi Electricity Company,2009). 0 500 1000 1500 2000
  • 9. 2500 3000 2004 2006 2008 2020 2030 P ri m a ry e n e rg y , T W h /y Gas Oil 1366 TWh 2035 TWh 2593 TWh
  • 10. Fig. 2. Growth of primary energy demand in KSA (without feedstock). 3.1 Primary energy consumption in the power generation sector The Saudi Electricity Company (SEC) controls the electricity sector and owns a total of 70 power generation stations. The current power generation capacity is around 39 GW of which 89% is owned by SEC, 6% from desalination co- generation plants and 5% from on-site www.intechopen.com Energy Efficiency Initiatives for Saudi Arabia on Supply and Demand Sides 283 generation (mainly at ARAMCO’s sites). The breakdown of power stations under the control of SEC in terms of capacities is shown in Figure 3(Saudi Electricity Company, 2010). 0 5 10
  • 11. 15 20 25 30 35 40 2005 2006 2007 2008 Generation capacity, GWe Gas turbines Steam turbines CCGT Diesel engines Fig. 3. Breakdown of actual generation capacity (GW) in SEC power stations (2004–2008). In 2008, the more-efficient combined cycle gas turbines (CCGT) accounted for only 7% of the total capacity with steam and gas turbines making up the majority of the generating capacity. The electricity generated from the different types of power generating stations is shown in Figure 4. 0 50
  • 12. 100 150 200 250 2005 2006 2007 2008 Electricity produced, TWhe/y SEC - Gas turbines SEC - Steam turbines SEC - CCGT SEC - Diesel engines Desalination plants Large consumers Fig. 4. Breakdown of electricity produced from different generation technologies (2004- 2008). www.intechopen.com Energy Efficiency – A Bridge to Low Carbon Economy 284 The fuel consumed in power stations amounted to 604 TWh
  • 13. (355 million barrels of oil equivalent) with 55% being from oil and 45% from natural gas. Based on 2008 fuel consumption and electricity production figures, a nominal power generation efficiency of 29.5% is obtained for all power generation in Saudi Arabia. This efficiency is low in comparison to world averages. For example, the average power generation efficiency for UK power generation is 38.6%(Electricity and Cogeneration Regulatory Authority,2009). If retiring power stations in KSA are replaced by CCGT, higher efficiencies from the power sector can be expected, as modern CCGT power stations are capable of delivering seasonal efficiencies in the order of 45%-50%, based on KSA climate conditions. While fuel consumption in SEC power stations has been gradually increasing, the share of natural gas has decreased from over 50% in 2004 to 45% in 2008. Thus, there could be a great potential in the power sector for gas to replace oil which will then lead to additional oil exports and so contributing to economic and environmental benefits. The switch from oil dominated electricity generation sector to more natural gas, will lead to more oil becoming available for export, improved generation efficiency and reduction in CO2 emissions. In order to satisfy future growth, it is predicted that an additional 35 GWe of electricity generation capacity, with an additional capital investment of $120 billion, is required in Saudi Arabia by 2030(Elhadj,E.,2004). If the current power
  • 14. generation mix is maintained, fuel consumption in the power generation sector will be 48% of the total primary energy consumption (2,593 TWh in 2030). If a scenario, where all newly-built power stations are CCGT, is considered, the nominal power generation efficiency could increase to 37% leading to about 20% reduction in predicted fuel consumption and also reducing the need for investment in new generation capacity. This shows the importance of increasing the share of CCGT in the power generation mix. 3.2 Primary energy consumption in the desalination sector In Saudi Arabia there exists a strong link between water and energy consumption because a large portion of water consumed is desalinated water which is transported for long distances. A summary of water production and demand in Saudi Arabia is given in Figure 5(Abdel-Jawad, M., 2001). Desalination is an energy intensive process. In Saudi Arabia, in 2008, a total of 153 TWh (57% gas and 43% oil) were used to produce 1135.6 m3 of water and 19 TWhe of electricity. The two main desalination methods used in KSA (and in the Middle East in general) are multi-stage flash (MSF) distillation and reverse osmosis(World Bank,2007). Power generation produces significant amounts of heat which, if not utilised, will be dumped to the atmosphere. Heat from power generation can be utilised in desalination.
  • 15. Combining power generation with desalination has higher energy efficiency than generating electricity or desalinating water separately, with energy efficiency improvement reaching 10-20% better. So an effective policy is one which promotes the construction of co-generation desalination plants where heat can be recovered and used while at the same time generating electricity. In order to satisfy future growth in water demand, an additional 20-30 desalination plants with total capital investment of $50 billion will be needed by 2030. If the volume of www.intechopen.com Energy Efficiency Initiatives for Saudi Arabia on Supply and Demand Sides 285 desalinated water doubles in 2030 as expected, and if desalination plants maintain their current efficiencies, fuel consumption by these plants will also double to more than 300 TWh.An effective policy for reducing primary energy consumption in the co-generation desalination sector is to introduce standards for minimum co- generation efficiencies from such plants.
  • 16. Desalinated water 6% (1135 Mm3) Non-renewable underground water 81% (14580 Mm3) Surface water and renewable shallow aquifers 12% (2160 Mm3) Treated sewage water 1% (180 Mm3) Total water consumption 18,000 Mm3 Industry 11% (2,000 Mm3) Domestic
  • 17. 9% (1,600 Mm3) Irrigation 80% (14,400 Mm3) Fig. 5. Water production and demand in Saudi Arabia. 3.3 Primary energy consumption in the industrial sector The industrial sector in KSA consists of oil refining, petrochemicals, iron and steel, cement in addition to other sectors. The average growth rate in the industrial sector is 4.3% with a total GDP of more than $240 Billion. The petrochemical sub- sector is one of the fastest growing sectors and has a 1.2% share in GDP. In 2008, primary energy consumption in the industrial sector reached 150 TWh representing 11% of total primary energy use in KSA. Assuming a growth rate of 4.3%, this is expected to increase to 379 TWh in 2030. 4. Electricity demand in Saudi Arabia In 2008, electricity produced in Saudi Arabia was 204 TWh, 11% of which was lost in transmission and distribution. The total electricity consumption
  • 18. in 2008 was about 181 TWh mainly in the residential sector (53%) with a consumption of 97 TWh at the user end which corresponds to approximately 285 TWh (168 million barrels of oil equivalent) at the power station inlet. Between 2004 and 2008, electricity consumption in the Kingdom has grown at an annual average of 5.1%. As a result of population and economic growth in Saudi Arabia, electricity consumption is expected to double to about 360 TWh in 2030.The breakdown of electricity delivered is shown in Figure 6(Saudi Electricity Company,2010). www.intechopen.com Energy Efficiency – A Bridge to Low Carbon Economy 286 18% 53% 12%
  • 19. 11% 6% Industrial Residential Government Commercial Other 23 TWhT&D Losses 181 TWh of electricity delivered 204 TWh of electricity Generated Fig. 6. Electricity flow in the Kingdom of Saudi Arabia in 2008. 5. Growth of primary energy and electricity demand Figure 2 above shows the expected primary energy consumption in 2020 and 2030. Based on the discussion in Sections 2, 3 and 4 above, future primary energy demand in different sectors is estimated as shown in Table 1. Table 1 gives a
  • 20. summary of the assumptions undertaken in obtaining the future primary energy demand in KSA in 2030 for the power generation, desalination and industry sectors following a business-as-usual (BAU) scenario. As stated above, primary energy consumption in the transport and the “other” (including agriculture, construction industry, etc.) sectors are excluded from this study. According to the BAU scenario, the share of the total primary energy demand for these three sectors increases from the current 66% to 74% in 2030. Based on the BAU scenario, the annual growth rate for primary energy demand in Saudi Arabia as a whole is 3% and in comparison with 1.6%/annum worldwide growth demand projected by the IEA(International Energy Agency,2009). For the three sectors in Table 1, a growth in demand of 3.4%/annum is estimated indicating the importance of implementing primary energy saving measures in these sectors in particular. www.intechopen.com Energy Efficiency Initiatives for Saudi Arabia on Supply and Demand Sides 287 Sector Projection
  • 21. Current, TWh/y CO2 emissions, T CO2/y(1) 2030, TWh/y CO2 emissions, T CO2/y(3) Power generation Fuel consumption in the power generation sector is approximately 600 TWh. The power generation capacity and power output are expected to double. Assuming the same generation mix (i.e. CCGT, steam turbines, gas turbines) is maintained, fuel consumption will also double.
  • 22. 604 328 1208 655 Desalination Municipal water demand will increase from the current 1.6 billion m3/year to 3.4 billion m3/year in 2030. Assuming the same share of desalinated water in the municipal sector is maintained (i.e. 70%), an additional 1.3 billion m3 of water from desalination processes will be required. The trend in KSA is to build cogeneration desalination plants, so a doubling of primary energy consumption is almost required. Using the ratio of desalination capacity in 2030 and currently, the energy use in 2030 is 325 TWh. 153 77 325 179
  • 23. Industry Using a growth rate similar to the current rate (i.e. 4.3%), the demand by industry in 2030 is 379 TWh 150 54(2) 379 135(2) (1) Based on emission factors of 350 g/kWh for gas and 700 g/kWh for oil. (2)The smaller emissions from industry are due to the much higher natural gas consumption in comparison to oil. (3) Assuming same energy mix and same emissions factors Table 1. Summary of current and future (business-as-usual) primary energy demand by sector. www.intechopen.com Energy Efficiency – A Bridge to Low Carbon Economy 288 6. Energy efficiency challenges and barriers The challenge electricity-generating utilities face is the provision of secure and stable supplies of electricity to their customers. A major tool in
  • 24. meeting this challenge is energy efficiency; however, both challenges and barriers face multi- faceted cultural, economic, technical, and institutional problems, which may require mandatory and educational initiatives to overcome them, as well as institutional reorganisation 6.1 Cultural barriers The historical low fuel and electricity prices, along with decades of increasing prosperity, have led to an endemic culture of profligate energy usage. The high standards of living taken for granted by new generations of Saudi youths entering the workforce depend on secure and stable energy, yet these figures strongly indicate that unless energy-efficiency measures are swiftly incorporated at all levels of the supply- demand equation, economic development may not be able to meet expectations. The problem is compounded by the twin growth profiles of population and per-capita energy consumption. From 2002 to 2006, the population has grown by an average of 2.6% p.a. and per- capita energy consumption by an average of 6.1% p.a. Over the same period as shown in Figure 7, SEC’s generating capacity has grown by an annual average of 5.4% yet total peak loads have grown by an annual average of 7.6%. Total consumption increased from 128,629 GWh in 2002 to 163,147 GWh in 2006, an average increase of 6.7% p.a. Although in absolute terms the increase in residential consumption during the period was greater than the combined total
  • 25. consumption of the agricultural and commercial sectors, expressed as percentages, the greatest average annual increase was in the commercial sector at 13.4%, followed by the residential sector at 7.9%. The smallest increase in consumption was in the industrial sector, which only increased by industrial consumption by 2.8% p.a. (Ministry of Water and Electricity, 2006). Fig. 7. Growth of Saudi electricity utility generating capacity and total peak loads in Saudi Arabia. Solid lines (1976-2007) are MOWE statistics; dashed lines (2008-2023) are projections. www.intechopen.com Energy Efficiency Initiatives for Saudi Arabia on Supply and Demand Sides 289 Despite the large annual increases in electricity consumption there is currently limited interest in the subject of energy efficiency among consumers from any sector, and little awareness of the opportunities available to them or of the benefits of specific energy efficiency technologies and practices. The recent government decision to abolish electricity price subsidies may provide an impetus to change this into a
  • 26. culture of energy efficiency; however, for this to happen, consumers need to be energy aware and tariffs need to actually reflect the true costs of generation, transmission, and distribution. 6.2 Economic barriers The Saudi Electric Company needs to raise at least SR 380 billion in investments for the period 2009-2017 (Saudi Electricity Company,2009) if it is to ensure security of supply and meet its capacity increase targets. Although there are proposals to open the electricity generating industry to private sector involvement, the high capital costs and low tariffs mean that it would not be an economically viable investment. This is especially the case in sparsely-populated rural areas where the low customer density profile means that the cost of generation and distribution to utility companies may be significantly higher than in urban areas where customer densities are much higher. Saudi financial institutions have yet to make major investments in energy efficiency projects. Despite many projects offering 2-3 year payback periods, committing capital to investments in new energy technologies is still considered an adverse risk. A similar attitude is found in all electricity consumer sectors. Not only are they also reluctant to make investments in energy efficient technologies, but the direct and indirect medium- and long-term economic gains of energy efficiency are often overlooked in favour of the short-term capital-cost
  • 27. savings available with cheaper equipment and work practices. Although the Government recently decided to abolish electricity price subsidies, costs to consumers have risen, and environmental costs are still not internalised in energy tariffs. To make sustainable reductions in energy use, consumers must see clear financial benefits: Subsidized energy prices mean consumers have little incentive to save energy. Even assuming that consumers had accurate information about the benefits of energy efficiency measures, had a range of energy-efficient appliances from which to choose, and had the financial means to purchase them, there would still be little economic reason for them to do so because electricity tariffs are lower than the expected avoided costs of electricity. In addition, despite import duties on electrical goods, the market is flooded with cheap imported products. 6.3 Technical barriers Perhaps the biggest problem facing the energy supply sector is the large seasonal variation in electricity consumption. In the hot summer season, there is increasing energy demand for air conditioning, especially by the residential and commercial sectors. Figure 8 shows a chart of the daily variation in peak load and the daily temperature profile measured in Riyadh on 09 September 2006. Peak load follows temperature throughout the day, with minimum demand and minimum temperatures in the early morning and maximum demand and
  • 28. maximum temperatures in the early afternoon. Peak load power is provided by gas turbines; they have the advantages of fast start-up times and can quickly respond to changes www.intechopen.com Energy Efficiency – A Bridge to Low Carbon Economy 290 in demand, but have the disadvantage of being relatively inefficient. An additional disadvantage is that during peak hours, when demand is at a maximum, ambient temperatures are also at a maximum, which can degrade turbine efficiencies by up to 20%. Another problem is the low reserve available generation margin. In Figure 7, the generating capacity of the electric utilities from 1976 to 2007 is shown along with the total peak load. Each increase in generation capacity is met by an increase in consumption. In 2002, generating capacity increased by 9.6%, but the following year, 2003, saw consumption increase by 9.8%. In 1996, 2001, and every year since 2004, the electric utilities have had insufficient capacity to meet the peak load. Fig. 8. Daily variation in peak load and temperature
  • 29. (temperatures for Riyadh, 09 Sept. 2006). 6.4 Institutional barriers Perhaps because of its unique position as a major oil and gas producer, and its resultant low domestic energy prices, Saudi Arabia lags behind many other developing nations in implementing energy efficiency strategies. As a consequence, there is no central institution responsible for energy efficiency at a national level, responsibility for oil, natural gas, and electricity is divided amongst several ministries and institutions, and there are no explicit end-user policies. The Ministry of Petroleum and Mineral Resources (MPMR) is responsible for the activities of oil companies, the largest of which is Saudi Aramco. Saudi Aramco produces almost all the country’s crude oil and all of its natural gas liquids. It is involved in exploration, production, and refining of crude oil, as well overseas marketing and domestic distribution of petroleum products. The Ministry is also responsible for the gas industry. Saudi Aramco produces, transports, and markets natural gas to large gas consumers such as power plants, desalination plants, and process industries. It also provides gas to the Saudi Gas Company, which delivers and sells natural gas to small consumers. www.intechopen.com
  • 30. Energy Efficiency Initiatives for Saudi Arabia on Supply and Demand Sides 291 The electricity industry answers to the Ministry of Water and Electricity (MOWE), although the Electricity Cogeneration Regulatory Authority (ECRA) regulates the industry and ensures high quality electric power and services are provided at reliable levels and reasonable prices; ECRA is also responsible for energy conservation. Power generation, transmission, and distribution are carried out the Saudi Electric Company (SEC). As an entity, SEC has been operational since 2000 and was formed by ministerial decree through the merger of ten regional power companies. SEC is a joint stock company; however, the majority stockholder is the Saudi government. Although many national organisations deal with limited aspects of energy efficiency and have sophisticated skill sets, their work is often duplicated, their strategies and policies are limited in scope, and their activities are not coordinated. Ultimately, none of the initiatives taken by these bodies, or those taken by major commercial and industrial concerns, are enforceable outside their own organisations or have much effect on a national scale due to lack of transparency on the part of governmental organisations and commercial
  • 31. confidentiality concerns by commerce and industry. There are a few sustainable energy policies and standards at a national level, but they are not enforced by law and are not legally binding. The Saudi Arabian Standards Organisation (SASO), for example, has published standards for consumer electrical appliances, which if implemented, should decrease the availability of cheap imports and increase the uptake of energy efficient appliances; however, the organisation is not able to enforce the standards, and despite import tariffs, the market is flooded with cheap energy inefficient products (National Energy Efficiency Program, 2010). 7. Energy efficiency initiatives A number of energy efficiency and conservation initiatives have been taken by various agencies in response to the increasing demand for electric power and to help ensure security of supply. Steps to reduce energy demand have been taken by the Saudi Arabian Standards Organization (SASO) with standards for the use of advanced insulating materials in the construction of new commercial buildings, and by the restructuring of electricity tariffs by the Saudi Electric Company. At the same as expanding conventional generation capacity, MOWE is attempting to reduce peak demand by setting limits on the maximum power delivered to large electricity consumers, and by establishing a demand-side management programme. MOWE is also
  • 32. enabling major consumers in industry and commerce to reduce peak demand time consumption and to shift their usage patterns to off-peak times, while agricultural consumers are required to reschedule their irrigation to off-peak times. In addition, new developments designed with large air conditioning loads are required to incorporate thermal energy storage systems. Another initiative is the proposal to privatize and reorganize the electricity sector into three independent sectors: generation, transmission, and distribution, and to allow private-sector participation in new power-generation projects. An estimated 837 MW peak load reduction was achieved in 2001 through these initiatives in the governmental sector and by 34 MW in the industrial sector; the commercial sector, however, increased their peak load by 126 MW during the same period. Although each of these initiatives is important in its own right, they have not been coordinated by a central authority and may have limited long- term effect. For this reason, www.intechopen.com Energy Efficiency – A Bridge to Low Carbon Economy 292
  • 33. perhaps the most important initiative has been the establishment of the National Energy Efficiency Programme. During the 5 years that NEEP has been active, it has coordinated a varied programme of activities including: -of-use tariff programme for major industrial and commercial customers with SEC electrical appliances with SASO -through energy audits of governmental, commercial, and industrial facilities commercial, and industrial facilities d seminars 7.1 Tariff restructuring Historically, tariffs have been heavily subsidised. The subsidy being the difference between the average cost of production and the tariff. Prior to 1984 there was single flat-rate tariff of 0.05 SR/kWh for industrial customers and 0.07 SR/kWh for
  • 34. residential customers. For tariff purposes, industrial customers also include agriculture, hospitals, and charities; while government is included with residential customers. Over the next decade, the flat-rate industrial tariff was unchanged, while residential usage was assessed according to a three- tier tariff. During this time, despite rising production costs, rather than raising tariffs or adjusting rates downward, they were adjusted upward, first in 1985 which saw the usage level at which the maximum tariff started double from 2000 to 4000 kWh/month, and again in 1992 when it was increased to 6000 kWh/month (Saudi Electricity Company, 2010). In 1995, a two-tier tariff was introduced for industrial customers, which effectively doubled charges as the higher tariff of 0.10 SR/kWh started at 2000 kWh/month. At the same time, the maximum charge for residential users was increased from 0.15 SR/kWh to 0.20 SR/kWh with no adjustment in the level at which the highest tariff started. The major change in tariff structure occurred in 2000, with the
  • 35. introduction of 11 tiers in the tariffs for residential customers ranging from 0.05 SR/kWh to 0.38 SR/kWh, and the reintroduction of a flat rate tariff for industrial customers at the higher rate of 0.12 SR/kWh. The residential tariffs were in force for 7 months before being lowered to 0.05 SR/KWh to 0.26 SR/KWh; however, the number of tiers and usage was not changed. 7.2 Time-of-use tariffs In addition, to restructuring industrial tariffs, a voluntary pilot time-of-use-tariff (TOU) programme was introduced for industrial and commercial customers with consumptions exceeding 600 MWh per annum. The pilot programme was limited to customers in Riyadh, which is part of SEC’s Central Operating Area and was conducted by SEC in collaboration with NEEP. www.intechopen.com Energy Efficiency Initiatives for Saudi Arabia on Supply and Demand Sides 293
  • 36. The TOU programme divides the year into two: summer, which runs from June to September, and winter, which runs from October to May. The summer has two periods, on- peak and off-peak. On peak applies on weekdays (i.e. Saturday to Wednesday) from one o’clock in the afternoon until 5 o’clock in the evening, this being the time of maximum domestic usage as well the time of least gas-turbine efficiency due to high ambient temperatures. Off-peak applies on weekdays at all other times, and at weekends. The winter is off-peak at all times. Generally, the more customers shift or curtail their usage to a TOU tariff during peak periods, the greater the net benefits to both the utility companies and its customers should be. Since the pilot TOU tariff program was voluntary, to ensure a high rate of customer participation, a peak to off-peak rate ratio was selected to maximise its appeal to a wide range of customers, rather than to maximise the benefit to the utility company. Several peak to off-peak rate ratios were proposed to large customers; most expressed interest in 4:1 and 2:1 ratios, with the strongest preference being for a TOU rate with a 4:1 peak to off-peak rate ratio. The TOU tariffs were calculated using Long Run Marginal Cost differentiated by time-of- use. The peak TOU tariff was set at 0.35 SR/kWh for industrial customers and 0.76 SR/kWh for commercial customers, and the off-peak TOU tariff was set at 0.09 SR/kWh and 0.19
  • 37. SR/kWh for industrial and commercial customers respectively. The outcome of the 2006 pilot TOU tariff programme is summarised in Table 3. From June to September 2006, the maximum on-peak reduction was 15.3 MW. About 10% of the total peak energy used, 2494 MWh, was shifted from peak to off-peak periods, 1717 MWh by industrial customers and 777 MWh by commercial customers. The total reduction in bills for all customers was 351510 SR, industrial customers saved 78160 SR, and commercial customers 273350 SR. Industrial customers contributed 69% to the total energy shift and their bill reduction was 22% of the total. In 2007 the number of participating industrial customers increased to 145 and commercial customers to 37; the maximum peak-load reduction was 90 MW with total savings of 64 million SR. In order to attract more participants, the on-peak tariff in 2008 was reduced to 0.09 SR for industrial customers and 0.19 SR for commercial customers. Industrial Commercial Tariffs Normal (SR/kWh) 0.12 0.05 – 0.26 On-Peak TOU† (SR/kWh) 0.35 0.76 Off-Peak TOU‡ (SR/kWh) 0.09 0.19 Outcome Customers 26 9 Max Peak-Load Reduction (MW) 11.9 3.4
  • 38. Total Energy Saving (MWh) 1717 777 Total Bill Reduction (thousand SR) 78.16 273.35 †On-Peak TOU: June-Sept, Sat-Wed, 13:00-17:00 ‡Off-Peak TOU: All other periods Source: NEEP (2006) Table 3. Pilot 2006 Time-of-Use (TOU) tariff programme. www.intechopen.com Energy Efficiency – A Bridge to Low Carbon Economy 294 7.3 Energy efficiency labels and standards for new equipment Substantial energy savings are possible by replacing energy- inefficient electrical appliances with energy-efficient appliances. A cost-effective method of doing so is to determine which classes of appliances consume the most energy and to develop minimum energy efficiency standards to which they have to comply. The standards describe testing and classification procedures for compliance. The appliances then bear energy- efficiency labels to provide consumers with information about their energy performance.
  • 39. These can be expressed in terms of energy use per hour, energy efficiency as a percentage, a coefficient of performance, or as an estimated cost of usage. In addition to such technical data, labels can also show a comparative index to simplify purchasing decisions for the general public; typical forms are ‘energy-stars’ or ‘good-better-best’ systems. Testing, performance-measuring procedures, and energy efficiency and labelling standards have been drafted by SASO in collaboration with NEEP for three of the major energy- consuming classes of electrical equipment: Ducted and non- ducted air-conditioners; household refrigerators, refrigerator-freezers, and freezers; and household clothes washing machines. Prior to this programme, the only appliances in Saudi Arabia to have energy efficiency regulations were air conditioners; however, they were ineffectively enforced. The existing standards for refrigerators, freezers, and washing machines, as well as for air- conditioners, were for health and safety and for physical and technical compatibility. Locally manufactured equipment tends to have low energy efficiencies and imported electrical equipment is subject to import duties. These factors, in addition to low levels of awareness amongst consumers, mean that energy use is not generally a significant factor in consumer purchases. Initiatives to change purchasing priorities include a comprehensive programme of education and awareness aimed at all sectors of the supply-demand chain, and financial incentives in the form of rebates for the purchase
  • 40. of energy-efficient appliances. The energy efficiency labels display manufacturer specific details, the appliance’s electrical specifications and operational capacity, and its performance under standard tests (Saudi Arabia Standards Organization, 2006). The label also shows a number of stars indicating its claimed energy efficiency at rated conditions. An example energy efficiency label for washing machines is shown in Figure 9; labels for other appliances differ only in their appliance-specific requirements in the main panel. A maximum of six stars can be displayed; the more stars, the greater the energy efficiency. The number of stars is derived differently for each class of appliance: For air-conditioners, it is the ratio of output cooling in Btu/hr to the input power in Watts at a given operating point; for domestic washing machines, it is primarily a function of the energy used per load and its rated load capacity; and for refrigerators and freezers, it is the reduction in energy consumption for their class expressed as a percentage. The derivation of energy star ratings for these appliances is in shown in Table 4. In addition to the testing and certification procedures, the programme is also addressing market transformation issues and the ability of the local manufacturing base to meet the standards. The likely costs for new product design, new technology licenses from foreign partners, production line re-tooling costs, and associated lead
  • 41. times to comply with the standards has been estimated for these appliances and a market transformation strategy is being developed. Information and awareness programmes have been developed and www.intechopen.com Energy Efficiency Initiatives for Saudi Arabia on Supply and Demand Sides 295 education and advertising campaigns targeted to industry, business, and consumers have been designed. Future assessments will be made to determine whether, as in developed countries, market forces will drive the adoption of more efficient models or whether mandatory standards will be required(Saudi Arabia Standards Organization, 2007). Fig. 9. Energy efficiency label for washing machines. Washing Machines Refrigerators & Freezers Air Conditioners
  • 42. Star Rating Function of input energy and load capacity (dimensionless) Amount energy consumption < class limit (%) Ratio of output cooling rate to input power (Btu/h/w) ≥ 6.0 5.0 to 5.9 4.0 to 4.9 3.0 to 3.9 2.0 to 2.9 < 2.0 30 25 20 15 10 5 > 10 9.5 to 10
  • 43. 9 to 9.5 8.5 to 9 7.5 to 8.5 < 7.5 6 5 4 3 2 1 Source: SASO (2005, 2006, 2007) Table 4. Derivation of energy star rating for washing machines, refrigerators and freezers, and air-conditioners. www.intechopen.com Energy Efficiency – A Bridge to Low Carbon Economy 296 7.4 Energy audits NEEP conducted a programme of energy audits to focus attention on the concept and benefits of energy efficiency by providing demonstrable ‘proof of concept’. The energy audits increased corporate awareness of energy efficiency
  • 44. measures and technical and economic recommendations were made available for policy makers. The energy audits were conducted at various levels; the simplest identified areas where consumers could reduce their energy usage. It involved walk- through surveys of governmental, commercial, and small industrial premises and provided immediate feedback of zero- and low-cost energy-saving possibilities. The audits examined electric utility equipment, HVAC systems, lighting, and water heating systems. As well examining the actual components of each system, the audits also examined the types of components used, locations, capacities, control systems, set points, replacement schedules, operational profiles, and historical records of electricity consumption. The results showed energy savings of at least 15% in educational buildings, 10% in shopping malls, and 10% in the industrial sector, with some smaller commercial premises showing potential savings of up to 35%. Savings in HVAC systems were obtained by rescheduling chiller and exhaust operation; all chillers were stopped overnight with maximum venting during the early morning to remove accumulated heat, and daytime break-period venting was minimised. Lighting systems phased in lower wattage fluorescent tubes, replaced electro- magnetic ballasts with electronic ballasts, and phased in halogen lamps with 50% lower wattage high-pressure sodium lamps; in addition, better use of natural lighting was made. Occupancy- based lighting and air-
  • 45. conditioning schedules were introduced, with occupancy sensors fitted where appropriate, and in larger facilities HVAC fresh-air streams were pre-cooled by exhaust streams. More-detailed energy audits were performed at medium- and large-scale industrial and commercial facilities to identify specific areas in which electrical and thermal energy savings could be made. Industrial facilities included refineries, power plants, and chemical and processing plants; and commercial facilities included hotels, hospitals, shopping centres, private schools, large mosques, and office buildings. In addition to the systems mentioned above, the detailed audits also examined more specialised equipment and plant such as compressed air systems, electric motors and pumps, steam systems, and boilers and furnaces. The audits indicated that energy consumption in KSA could typically be reduced by up to 20% compared to current levels, with commensurate reductions in CO2 emissions, and that in some older industrial facilities energy savings between 40% and 70% could be obtained by rescheduling plant and equipment operation and introducing energy performance monitoring systems. Where retrofit or replacement was recommended, payback periods between 3 months and 5 years were estimated. The most-detailed energy audits were of boilers, furnaces, and steam systems. These were conducted in conjunction with intensive training courses in boiler and furnace efficiency. After implementing all zero- and low-cost measures guidance
  • 46. was given in preparing a loan request package to finance high capital-cost measures. Recommended energy efficiency improvements ranged from simple tune-ups to complete retrofits with potential energy savings between 5% and 10%. Data from the programme are being used to target marketing efforts for detailed energy audits and feasibility studies, and are also being used for national energy efficiency www.intechopen.com Energy Efficiency Initiatives for Saudi Arabia on Supply and Demand Sides 297 planning and policy analysis. Although most facilities were well maintained, much of the maintenance was reactive, not proactive, and in some facilities cooling and lighting was operated continuously regardless of occupancy. Most importantly, however, despite management awareness of the concept of energy conservation, few energy accounting systems were in place. Although the audits highlighted energy saving potentials, long-term energy savings can only be realized through total energy management programmes, the foremost aspect of which is commitment at a corporate level to
  • 47. energy conservation. 7.5 Promotion of an energy service industry Energy Service Companies (ESCOs) have been successfully operating in industrial countries for more than 50 years. ESCOs specialize in reducing their customers’ energy consumption through a combination of engineering expertise and financial services. After conducting energy audits, ESCOs help customers upgrade their facilities and reduce energy costs by investing future cash flows from energy savings using a type of project financing called ‘performance contracting’, in which cost-saving measures are implemented at no initial cost to the customer and the energy savings are used to pay back the initial investment. ESCOs in Saudi Arabia face the same barriers that other energy efficiency initiatives and projects have encountered. Most of these barriers are due to unfamiliarity with the concept and mode of their operation by clients and financing intuitions; the financial barriers, however, relate to the fact that the ESCO industry is new in Saudi Arabia. In countries with well- established bank structures, ESCOs guarantee energy savings large enough to cover their clients’ debt obligations and banks carry the credit risks. In countries with new ESCO markets, such as Saudi Arabia, banks are reluctant to carry credit risks and ESCOs must carry both performance and credit risks; the clients carry the business risk in both cases ( National Energy Efficiency Program, 2006).
  • 48. The annual energy efficiency market in Saudi Arabia has been estimated at SR 1.2 billion for the commercial, governmental, and industrial sectors alone [20]. Many organizations in Saudi Arabia have old and inefficient facilities, and although they would like to implement energy-conservation measures, they have neither the expertise nor the initial capital to do so, despite potential energy savings of up to 35%. There are presently five ESCOs in Saudi Arabia, and in an initiative designed to increase this number and to help those already established, NEEP organised two business advisory seminars addressing all aspects of the energy services industry. The first presented 25 topics over three days, and the second, 32 topics over five days. The seminars gave potential ESCOs advice about how to overcome contractual and legal start-up barriers, and how to identify and exploit energy-efficiency opportunities on a commercial basis. They also provided hands- on experience in business development, marketing, customer relations, contracts, staffing, and international joint ventures. In the short-term, however, the institutional, financial and commercial barriers are likely to prevent them from exploiting the opportunities. 7.6 Energy efficiency information and awareness Due to the very low levels of awareness of the advantages and possibilities of energy efficiency on the part of both the energy service industry as well as that of energy end users, NEEP initiated an information and awareness programme to determine current levels of
  • 49. awareness of energy efficient opportunities, equipment, and financing mechanisms. The www.intechopen.com Energy Efficiency – A Bridge to Low Carbon Economy 298 first part surveyed the energy service industry, and the second part surveyed energy end- users. The majority of planned energy efficiency measures target high energy consumers. The data obtained will help formulate information management and distribution strategies, and to assist energy service companies identify and exploit market opportunities. The information and awareness programme compiled detailed information on the breakdown of electricity consumption. The Western Region accounts for 38% of residential electricity consumption, the Central Region accounts for 39% of governmental consumption, and the Eastern Region accounts for 83% of industrial consumption. Electricity is an energy source for 99% of energy end users, 80% of whom consume less than 4,000 kWh per month with 1.4% consuming more than 10,000 kWh per month. Petroleum is an energy source for 21% of customers and gas for 7%.
  • 50. The majority of survey respondents feel that energy bills are the least controllable of their operational costs, as a result, they rarely budget for energy efficiency measures. Where energy efficiency projects are undertaken, they appear to be entirely self-financed. The surveys did not identify, directly or anecdotally, any examples of financial institution involvement. Ninety percent of energy service-industry respondents were unaware of local financing options and 80% were not prepared to self-finance energy audits or implement recommendations. Among energy end-user respondents, 58% were not prepared to self- finance energy audits or implement recommendations. Among incentive options for implementing energy efficiency programs, 40% preferred free studies, 23% preferred policies and regulations, reward schemes were preferred by 23%, and soft loans was preferred by 14%. Among common energy efficiency measures implemented in the residential sector, 90% turn off unused equipment, 34% have energy saving lamps, and 34% clean their air-conditioning filters. Self-financed energy- efficient purchases were reported by 30% of residential respondents; of these 40% were for lighting, 34% for air conditioning, 16% for refrigerators and freezers, and 14% for water heaters. A compilation of key information about energy-efficient equipment and estimates of possible energy and monetary savings was made for dissemination by local organisations,
  • 51. the media, and the Internet. It is part of an on-going nation-wide public-awareness programme designed to educate consumers and to influence their buying decisions in favour of energy-efficient devices. A permanent energy- efficiency exhibition is planned for the newly constructed Prince Salman Science Oasis in Riyadh, and others may follow in other regions. The exhibits will include interactive displays and information about energy efficient air-conditioning systems, lighting, cooking, water heating, and insulation. 7.7 Energy efficient equipment leasing programme This is an ongoing programme designed to eliminate financial barriers to the purchase of energy-efficient equipment by supplying energy-efficient equipment to consumers and recovering the cost through lease payments added to electricity bills. Energy savings are expected to cover the cost of the leases. Initially the programme will target air-conditioning units, and replace energy-inefficient units with energy-efficient units. Electricity demand is expected to fall by an amount proportionate to the number of units supplied through the programme. An important aspect of the programme is that units are traded-in. Without this www.intechopen.com Energy Efficiency Initiatives for Saudi Arabia on Supply and
  • 52. Demand Sides 299 provision, the old air-conditioning units would be retained and utilized in a location that wasn’t previously air conditioned; instead of reducing energy consumption, this would add to consumption and increase demand on the grid. The trade-in condition also allows proper disposal of hazardous materials and correct recycling and disposal of the old units. 7.8 Technical and management training In addition to the seminars and training mentioned above, training in various other energy efficiency disciplines was provided in the form of workshops and seminars. Most workshops were offered in several venues across the country but were only made available to suitably qualified professionals as a major consideration was training trainers. Over 400 personnel from all sectors attended the training sessions, many of whom have gone on to establish regular training sessions and energy efficiency programmes in their own institutions and companies. Sessions included: -efficiency project financing
  • 53. chnical efficiency and energy management -side management 8. Policy recommendations During the course of the programme the need for additional government initiatives were identified; the most critical of which are: 8.1 Endorsement Enforceable legislation is essential if energy efficiency measures are to have long-term national effect. For energy efficiency to become an integral and fundamental part of doing business, active and unequivocal support and endorsement by the Government of Saudi Arabia is essential. Leading institutions, such as KACST and SASO, ministries such as MOWE and MPMR, and major industries must be seen to take the lead and to support the concept and goals of the energy efficiency and conservation. 8.2 Transparency Government needs to take the lead in transparency. All government agencies and ministries, as well as industry and commerce, must make information about their energy consumption patterns and energy efficiency activities available. Historically, commercial confidentiality has been cited for the reason very little data has been made available to public oversight.
  • 54. Without data, however, advisory and regulatory engineers and consultants are unable to provide detailed advice and feasibility studies to improve plant efficiency. Lack of data also www.intechopen.com Energy Efficiency – A Bridge to Low Carbon Economy 300 degrades the ability to formulate public policy and to assure the security and economic growth of Saudi Arabia through efficient and wise use of its energy resources. Public sector and large industrial plants and facilities should conduct mandatory energy audits and the verifiable non-confidential results need to be in the public domain. Ideally, information claimed to be confidential should be supported with documented reasons in support, and should, to the governing authority’s satisfaction, adequately demonstrate that disclosure could seriously and prejudicially affect their commercial interests. 8.3 Training Government needs to address the critical shortage of qualified engineers and technicians. There are at present insufficient suitably qualified and
  • 55. experienced engineers and technicians to perform the necessary work on a national scale. The provision of training needs to be accelerated. 8.4 Awareness Government support is needed to increase public awareness of energy efficiency to a level substantially higher than its present level. High-level public figures need to endorse the effort to conserve the country’s finite natural resources; in local and national legislation; in professionally produced programmes and campaigns of public awareness; but most importantly, through public, private, and professional example. 8.5 Financing An initial programme of government intervention or subsidy, perhaps in the form of early adoption loan guarantees or a sliding scale of energy rebates, is required to encourage financial institutions to finance projects identified and endorsed as technically and economically feasible. 8.6 Inertia Even when positive benefits are clearly demonstrated, resistance to change and a reluctance to adopt new technologies and methods extends from government procurement specifications to the adoption of energy efficiency standards for appliances and equipment. Decades of low energy prices and the consequent endemic
  • 56. wastefulness, requires the imposition and coordination of top-down energy efficiency policies and regulations to invoke changes in energy usage. Even with high level endorsement, public awareness campaigns, and financial inducements, public acceptance is likely to lag behind awareness. For this reason, the government should consider a staged implementation of policies, starting with those with the greatest public need or support. 8.7 National centre Responsibility for energy efficiency rests on everyone, yet to ensure that measures are applied consistently and efforts are not duplicated, central coordination is required. This could be provided by a national centre for energy efficiency. In addition to continuing and extending the work initiated by NEEP, the centre should be able to advise at all levels and www.intechopen.com Energy Efficiency Initiatives for Saudi Arabia on Supply and Demand Sides 301 on all aspects of energy efficiency and conservation, and should be responsible for ensuring that they inform all aspects of governmental policy.
  • 57. 9. Initiatives for reducing energy consumption on the supply side 9.1 Modernisation of existing power plants Most power generation capacity in Saudi Arabia comes from open cycle gas turbines and from steam turbines with efficiencies around 30%. Based on current mix of power generation capacity in Saudi Arabia, the nominal efficiency for the current power generation mix is around 29.5%. This relatively low energy level can be improved by converting existing open cycle gas turbines (OCGT) and steam turbine (ST)-based power plants to combined cycle gas turbines CCGT which can achieve efficiencies as high as 50% in Saudi Arabia. The value of constructing CCGTs rather than OCGTs has been recognised in Saudi Arabia. For, example the new power plant constructed at Qurayyah in the East part of SA was originally intended to be OCGT (15 x 127 MWe). The OCGT plant with a total capacity of ~ 1.9GW was completed in May 2010 with an investment cost of $ 570 Million. However, recently a $300 Million contract was awarded to GE to supply five STs for a major expansion of the Qurayyah OCGT plant and converting it to CCGT. This will increase the output of the power plant from 1.9 GW to 3.1 GW. Considering OCGT, there are currently more than 3 GWe of power plants which can be potentially converted to CCGT. Our calculations show that this conversion can potentially
  • 58. provide an opportunity for oil saving of 14-15 million barrels/year which equate to additional revenue of $Bn1.2/year at current oil prices. The conversion to CCGT will produce more electricity for the same amount of fuel. However, the operation of CCGT will require additional infrastructure and so additional investment will be required for the conversion. The techno-economic feasibility of converting to CCGT then needs to be investigated on a case-by-case basis. 9.2 Minimum efficiency standard for new power plants The overall nominal efficiency of power generation in Saudi Arabia can be improved by setting a minimum efficiency standard for new power plants. This will ultimately lead to a reduction in the additional capacity required by 2030 (currently at 35 GWe) and will consequently lead to primary energy/oil savings. These minimum efficiency standards are dependent on climatic conditions and so they need to be estimated specifically for Saudi Arabia and may differ from one region to another. For example, higher ambient air temperature will increase the compression power requirement thus reducing efficiency. In addition, higher condenser water temperatures will reduce the efficiency of the steam cycles. Thus, these need to be taken into consideration in setting minimum efficiency standards for Saudi Arabia. We recommend a minimum efficiency standard of 36% for new gas turbines and 52% for CCGT.
  • 59. OCGT power plants will still be required to meet peak demand. However, it is obvious that significant improvements in the overall efficiency level and reduction in energy consumption can be achieved by building more CCGT power plants. Considering a situation where all newly-built power plants to 2030 are CCGT, oil savings of 140 million www.intechopen.com Energy Efficiency – A Bridge to Low Carbon Economy 302 barrels of oil/year can be achieved. This corresponds to revenue of $Bn11/year at current oil prices. 9.3 Minimum overall efficiency standard for co-generation desalination plants Desalinated water demand in Saudi Arabia is expected to increase over the next two decades with an additional 20-30 desalination plants required by 2030. Desalination plants are energy-intensive with heat being the major requirement for multistage flash vaporisation. Many desalination plants in Saudi Arabia use heat from co-generation units where electricity is also generated and exported to the grid. In 2008, 19 TWh of electricity
  • 60. and about 1.2 Billion m3 of water were delivered from co- generation desalination plants. A minimum overall efficiency (heat + electricity) of 80% is recommended for Saudi co- generation plants. This will ensure higher utilisation of available heat and consequently potentially more desalinated water for the same amount of electricity generated. Analysis of available data from Saudi co-generation desalination plants shows that power-to-water ratio (PWR) is on average 1600 MWe per million m3 of desalinated water. Depending on the prime mover used in co-generation, PWR can be as high as 4000 MWe per million m3 of desalinated water. This shows that there is a scope for improving power output from Saudi Desalination plants. 9.4 Implementation of a renewable energy programme to displace fossil fuels Analysis for the current report shows that there is a great potential for solar energy in Saudi Arabia. A photovoltaic area of 22 – 40 km2 in Saudi Arabia can produce as much electricity as a 1000 MWe oil-fired power station. We have shown that if subsidy on oil is removed then, at current oil prices (assuming $80/barrel), electricity from PV in Saudi Arabia can be more competitive than electricity from oil-fired power generation. Our estimates show that in order to stimulate PV in Saudi Arabia, an incentive equivalent to approximately 64 Halalah/kWh needs to be introduced.
  • 61. Our review of renewable energy options for Saudi Arabia also showed a great potential for solar thermal applications. Solar electricity generating systems (solar thermal concentrators) can achieve conversion efficiencies of 18-30%. Solar absorption cooling where thermal energy from the sun is used for re-generation in absorption chillers is another possible application. Despite its great potential, the wide scale deployment of solar energy in Saudi Arabia faces several barriers. These include lack of incentives, high costs (considering current subsidies on oil), lack of public knowledge, and lack of professional training. 10. Initiatives for reducing energy consumption on the demand side 10.1 Introduction and implementation of a new energy conservation law An energy conservation law in Saudi Arabia will assist in facilitating energy savings throughout society improving efficiency and economic benefits of energy use. In this context, energy conservation refers to the reduction of loss and waste in various energy stages from energy production to energy consumption and the use of energy more efficiently and rationally by strengthening management of energy use by adopting technologies which are technically and economically feasible and environmentally friendly KSA can formulate energy www.intechopen.com
  • 62. Energy Efficiency Initiatives for Saudi Arabia on Supply and Demand Sides 303 conservation policies and plans which can then be incorporated into the country’s economic and social development program. KSA can also develop programmes to enhance and encourage research in the science of energy conservation. An energy conservation authority can be created to become in charge of the supervision and management of the energy conservation work throughout the country. In addition, the construction of new industrial projects exploiting technologies with excessive energy consumption and severe waste of energy should be prohibited and monitored by this authority. National standards for energy conservation should be established and published. For sectors which are not covered by the national standards, relevant sectional standards of energy conservation should be established and filed with the standardization authority. The following policies on energy conservation technologies should be particularly encouraged demonstrated their maturity and
  • 63. economic benefits. -generation of thermal power and district cooling and co- supply of heat from co- generation to industrial processes. pumping equipment in the industrial sector by developing speed adjustable motors for energy savings and electrical and electronic energy-saving technologies for electric power. 10.2 Introduction and implementation of building regulations About two thirds of the electric energy generated in Saudi Arabia is used for operating buildings. More than 60% of this energy is used in air conditioning. This high consumption of electricity combined with escalating energy prices has created a need for the introduction of energy conservation measures in buildings in KSA. While a Saudi building code exists, this needs to be enforced so that actual savings can be achieved. Since the main purpose of building regulations in KSA would be to reduce cooling demand, they should consider establishing building designs which encourage the implementation of energy-saving measures. This should cover the types of construction structures, materials, facilities and products which improve building designs and at the same time reduce cooling energy consumption and lighting. Building regulations in Saudi Arabia should
  • 64. component of the design, construction and operation of the building ide the means for inspection and monitoring of energy efficient measures during the construction phase and afterwards during the operation of the building an important requirement for approval 11. Scenario analysis and potential oil savings This section gives brief analysis of two scenarios for reducing primary energy consumption and consequently oil consumption based on the policy initiatives discussed above. Two www.intechopen.com Energy Efficiency – A Bridge to Low Carbon Economy 304 different scenarios are considered to illustrate how the growth in primary energy demand might be constrained. Both scenarios are compared with the
  • 65. Business As Usual (BAU) scenario presented in Section 5 which assumes the current predicted rate of growth will be reached by 2030. The two scenarios represent a lower, conservative estimate, Low Primary Energy Conservation (LPEC), and an upper estimate, High Primary Energy Conservation (HPEC). The upper estimate assumes that a more ambitious reduction can be achieved. Both scenarios include a combination of energy supply, energy demand and some renewable energy. In the power generation sector, several options are considered for reducing energy consumption. These include the following 1. Improving the power generation efficiency by increasing the share of CCGT capacity is considered. Currently CCGT makes only 7% of the total generation capacity. CCGT is the most effective natural gas-based power generation technology with efficiency of at least 50%. For CCGT in KSA, an additional benefit can be recognised. Currently, 45% of power generation is natural-gas-based and if more natural gas- based power plants are built, more oil can be released for export. Two levels of CCGT are considered here. An additional 35 GW of power generation capacity is required in the next two decades. In the LPEC scenario, an additional 5 GW of CCGT is considered while in the HPEC scenario, an additional 30 GW is considered. 2. Reducing electricity consumption by (a) improving appliance
  • 66. efficiency and (b) utilising electricity conservation measures in order to reduce cooling/heating load in the residential, commercial, and other sectors. The LPEC scenario considers a reduction of 5% in electricity consumption which can then be translated into primary energy savings. The HPEC scenario considers 10% reduction in electricity consumption. 3. Using renewable energy for generating electricity. This paper focuses on PV as a means for generating electricity. The LPEC scenario considers 1 GW of PV. At current PV module prices, this corresponds to investment costs of $4-6 billion, a saving of 5 million barrel of oil per year which can be directed for export and CO2 savings of 2.1 Mt/year. The HPEC scenario considers a 5 GW of PV capacity which corresponds to investment costs of $20-30 billion. These costs, however, are expected to decrease as the rate of production increases. A PV capacity of 5 GW would displace 5 million barrels of oil per year (worth $300 - $400 million based on current international oil prices) for export and save 5 Mt/year of CO2.The desalination sector in KSA uses about 11% of the total primary energy consumption. As shown in Section 4.3, this is also expected to be the case in 2030 with primary energy consumption reaching 325 TWh in 2030 in order to satisfy the increasing demand for water. In KSA, currently 153 TWh are consumed in the desalination
  • 67. sector producing 19 TWhe of electricity and 1135 m3 of desalinated water/year. The LPEC scenario assumes a reduction of 5% in primary energy in the desalination sector while the HPEC scenario assumes a reduction of 10%. Reducing energy consumption in the desalination sector can be achieved in several ways: thermal energy required by desalination plants. In membrane desalination plants (such as reverse osmosis) electrical energy is required to operate the pumps and desalination units. In thermal www.intechopen.com Energy Efficiency Initiatives for Saudi Arabia on Supply and Demand Sides 305 distillation plants, both electrical and thermal energy are required and so both solar PV and solar thermal applications can be utilised. water. lead to lower primary
  • 68. energy consumption in the desalination sector. In the BAU scenario, primary energy consumption in the industrial sector amounts to 379 TWh. The LPEC scenario assumes a modest reduction of 5% while the HPEC scenario assumes that a 10% reduction could be achieved.A summary of the assumptions used for these two scenarios is shown in Table 5. Figure 10 compares the LPEC and HPEC scenarios with the BAU scenario. Sector Reduction measure by 2030 LPEC scenario HPEC scenario Power generation Additional CCGT, GW 5 30 Reduction in Electricity consumption 5% 10% Solar PV, GW 1 5 Desalination Reduction in primary energy consumption, % 5% 10%
  • 69. Industry Reduction in primary energy consumption, % 5% 10% Table 5. Assumptions for the low and high energy conservation scenarios. 0 200 400 600 800 1000 1200 1400 1600 1800 2000 Current mix 2030 BAU 2030 LPEC 2030 HPEC Primary energy,
  • 70. TWh/year Power Sector Desalination Industry 111% increase 5% reduction in PE 16% reduction in PE Fig. 10. Reduction in total primary energy according to scenario 1 (LPEC) and scenario 2 (HPEC). www.intechopen.com Energy Efficiency – A Bridge to Low Carbon Economy 306 Under the LPEC scenario, a total primary energy saving of only 5% from all the proposed measures would be achieved compared with BAU. Under the more ambitious HPEC scenario, a reduction of 16% could be achieved. A summary of the results is given in Tables 6 and 7. Table 6 shows that significant oil savings and
  • 71. additional revenue from export can be achieved from even the “low primary energy conservation” scenario. Also Table 6 shows the potential CO2 savings associated with energy savings in each of the scenarios. The CO2 savings associated with oil savings in the HPEC scenario are 13% of the total emissions in 2030. These figures account for the difference in CO2 emissions between oil and natural gas- fired generation. Sector BAU LPEC HPEC Primary energy consumption, TWh/year 1912 1820 1597 % power 63 63 60 % desalination 17 17 18 % industry 20 20 22 % Reduction from BAU - 5% 16% Oil savings compared to BAU, M barrels/y - 54 185 Additional revenue at today’s oil prices, $Billion/year - 4.3 14.8 CO2 savings associated with oil savings, Mt CO2/y - 92 126 Table 6. Comparing LPEC and HPEC scenarios to BAU scenario in KSA.
  • 72. Base case assumption Potential PE savings TWh/year PE savings compared to BAU, % 5 GW of CCGT 12 0.6% 30 GW of CCGT 123 6.4% 1 GW of PV 11 0.6% 5 GW of PV 55 2.8% 5% reduction in electricity consumption 34 1.8% 10% reduction in electricity consumption 67 3.5% Improving co-generation efficiency from 60% to 65% 16 0.8% Improving desalination efficiency by 12% (from 60% to 67%) 32 1.7% 10% reduction in industrial primary energy consumption
  • 73. 38 2% Table 7. The effect of changing each of the parameters in comparison to BAU scenario. It is clear from Table 7that most savings can be achieved by changing the mix of the power generation sector. The construction of CCGT power plants in the future can lead to significant savings in primary energy and to also additional oil exports. Electricity efficiency www.intechopen.com Energy Efficiency Initiatives for Saudi Arabia on Supply and Demand Sides 307 improvements in the residential, commercial and industrial sectors offer the next most significant savings 12. Conclusion This paper presented different affordable initiatives for reducing energy consumption on both sides of energy supply and demand. Also, the paper proposed two scenarios which have been considered to demonstrate the effectiveness of combination of measures including fuel switching, energy efficiency and solar energy.
  • 74. Each scenario compared the savings that could be achieved relative to Business As Usual (BAU), which assumes contained unconstrained growth until 2030. The first scenario includes 5 GW of new Combined Cycle Gas Turbines(CCGT), 1 GW of Photo Voltaic (PV) and only a 5 % improvement in energy efficiency. The total primary energy would be reduced by 5 % compared with BAU. A second ambitious scenario which includes 30 GW of CCGT, 5 GW of PV and a 10 % improvement from energy efficiency measures would lead to an estimated 16 % reduction compared with BAU. 13. References Abdel-Jawad,Mahmoud. (2001). Energy sources for coupling with desalination plants in the GCC countries, report. ESCWA. Alowaidh, M., and Alnutifi, A., (2010). Technology-Based Improvement for KSA Energy Intensity, Internal Report, Saudi Aramco. Electricity and Cogeneration Regulatory Authority. (2008).Updated Generation Planning for Saudi Electricity Sector. Report. Riyadh. Electricity and Cogeneration Regulatory Authority. (2009). General Directorate, Economy and Tariff Affairs, Annual Statistical Booklet on Electricity Industry. Riyadh. Electricity Cogeneration Regulatory Authority.(2006). Updated Generation Planning for Saudi
  • 75. Electricity Sector. Saudi Arabia. Elhadj,Elie. (2004). Household water and sanitation services in Saudi Arabia: an analysis of economic, political and ecological issues, SOAS Water Research Group, Jeddah. International Energy Agency. (2006a). Energy Balances of OECD Countries. Statistics Division, International Energy Agency. International Energy Agency. (2006b). Economic Indicators and Energy Balances of Non-OECD Countries. Statistics Division. International Energy Agency. (2009). Energy Balances of OECD Countries. Statistics Division. Liebendorfer, K.M., Andrepont, J.S. (2005). Cooling the Hot Desert Wind: Turbine Inlet Cooling with Thermal Energy Storage (TES) Increases Net Power Plant Output 30%, Proceedings of the ASHRAE Annual Meeting, ASHRAE Transactions, Volume 111, Part 2. Ministry of Water and Electricity. (2006). Electricity Growth and Development in the Kingdom of Saudi Arabia, Annual Report, Saudi Arabia. Ministry Of Water and Electricity. (2009).Electricity Growth and Development in the Kingdom of Saudi Arabia, Annual Report, Riyadh. National Energy Efficiency Program. (2006). Discovering Business Opportunities in the Energy Services Industry, Second Workshop, Riyadh, Saudi Arabia.
  • 76. National Energy Efficiency Program. (2010). Energy Efficiency Opportunities in the Kingdom of Saudi Arabia, Report , Saudi Arabia. www.intechopen.com Energy Efficiency – A Bridge to Low Carbon Economy 308 Said,S., ElAmin,I. and AlShehri,A. (2205). Renewable energy potentials in Saudi Arabia. Report. Saudi Arabia. Saudi Arabia Standards Organization. (2005). Energy Labelling and Minimum Energy Performance Requirements for Air-Conditioners, Standard No. 3459, Saudi Arabia. Saudi Arabia Standards Organization. (2006). Energy Labelling Requirements of Household Electrical Clothes Washing Machines. Standard No. 3569, Saudi Arabia. Saudi Arabia Standards Organization.(2007). Energy Performance Capacity and Labelling of Household Refrigerators, Refrigerator-Freezers, and Freezers, Standard No. 3620, Saudi Arabia. Saudi Arabian Standards Organization. (2005). Energy
  • 77. Labelling and Minimum Energy Performance Requirements for Air‐Conditioners. Standard 3459, Saudi Arabia. Saudi Electricity Company. (2009). Annual Report, Riyadh. Saudi Electricity Company.(2010). Annual Report, Riyadh. World Bank. (2007). World Development Indicators, Report, Washington, D.C. www.intechopen.com Energy Efficiency - A Bridge to Low Carbon Economy Edited by Dr. Zoran Morvaj ISBN 978-953-51-0340-0 Hard cover, 344 pages Publisher InTech Published online 16, March, 2012 Published in print edition March, 2012 InTech Europe University Campus STeP Ri Slavka Krautzeka 83/A 51000 Rijeka, Croatia Phone: +385 (51) 770 447
  • 78. Fax: +385 (51) 686 166 www.intechopen.com InTech China Unit 405, Office Block, Hotel Equatorial Shanghai No.65, Yan An Road (West), Shanghai, 200040, China Phone: +86-21-62489820 Fax: +86-21-62489821 Energy efficiency is finally a common sense term. Nowadays almost everyone knows that using energy more efficiently saves money, reduces the emissions of greenhouse gasses and lowers dependence on imported fossil fuels. We are living in a fossil age at the peak of its strength. Competition for securing resources for fuelling economic development is increasing, price of fuels will increase while availability of would gradually decline. Small nations will be first to suffer if caught unprepared in the midst of the struggle for resources among the large players. Here it is where energy efficiency has a potential to lead toward the natural next step - transition away from imported fossil fuels! Someone said that the only thing more harmful then fossil fuel is
  • 79. fossilized thinking. It is our sincere hope that some of chapters in this book will influence you to take a fresh look at the transition to low carbon economy and the role that energy efficiency can play in that process. How to reference In order to correctly reference this scholarly work, feel free to copy and paste the following: Y. Alyousef and M. Abu-ebid (2012). Energy Efficiency Initiatives for Saudi Arabia on Supply and Demand Sides, Energy Efficiency - A Bridge to Low Carbon Economy, Dr. Zoran Morvaj (Ed.), ISBN: 978-953-51-0340- 0, InTech, Available from: http://www.intechopen.com/books/energy-efficiency-a-bridge- to-low-carbon- economy/energy-efficiency-initiatives-for-saudi-arabia-on- supply-and-demand-sides © 2012 The Author(s). Licensee IntechOpen. This is an open access article distributed under the terms of the Creative Commons Attribution 3.0 License, which permits unrestricted use, distribution, and reproduction in any medium, provided the original work is properly cited.