Potential energy is the energy that an object possesses due to its position or state of strain. Objects have potential energy due to their height or position, such as water in a dam or a mango on a tree. Objects can also have potential energy due to strain, such as a wound spring, stretched rubber band, or compressed spring. Potential energy is calculated as U=Mgh, where U is potential energy, M is mass, g is acceleration due to gravity, and h is height. When a spring is wound in a toy car, the force applied is stored as potential energy that then gives motion to the toy car when released.
Dialogic book reading practices as potential learning contexts in EYL classesLola Devung
This document discusses dialogic reading, which is a technique for reading books with children where the roles of reader and listener are shared. It provides background on how dialogic reading promotes learning and reviews the author's research studying its implementation. The research found that dialogic reading helped improve children's vocabulary and language skills when teachers were trained first. It recommends dialogic reading as a potential learning method but emphasizes the importance of teacher training to properly implement its strategies.
This document provides a rubric for scoring short answer responses that connect ideas between two given selections. It outlines four score points - 0 for no answer, 1 for a reasonable idea but lacking evidence, 2 for a reasonable idea supported by evidence from both selections, and 3 for a perceptive idea supported by specific, well-chosen evidence. The document also provides examples of sample questions and answers that demonstrate how to structure a response by explaining the idea for each selection and citing relevant evidence from both.
This document provides examples of various primary sources or documents and asks whether each example would be considered a primary source. Primary sources are original materials created at the time under study that provide first-hand accounts of events or experiences. The document lists examples like letters, diaries, maps, photographs, newspaper clippings, audio/video recordings, artifacts, eyewitness accounts, and other original materials created during the time period being studied.
The document contains performance data and analysis for an algorithm company from December 2020 to April 2024. It provides financial metrics like sales, operating profit, net income, debt ratio, and EPS on a quarterly and annual basis. It also includes the company's stock price trends, probability of price increases, and recommendations to buy, sell, or hold amounts of the company's stocks. The analysis is from The Algorithm Company Analysis Consulting, which provides investment consulting services but does not guarantee the accuracy of the data and analysis.
This document provides a performance analysis and stock trading strategy for Algorithm (consolidated) 003650 over a 3-month period. It summarizes the company's recent annual and quarterly financial performance. It then provides the stock's current and projected price ranges, an evaluation of the stock, and a suggested purchase amount. It outlines buying and selling amounts for the stock across different price ranges. Finally, it shows the stock's predicted probability of rising in price over the next 3 months according to two sectors and on average.
This document provides a summary of a company's financial performance and stock price predictions over several quarters based on an analysis by an algorithm. It shows key metrics like sales, profits, debt ratios, and stock prices historically and makes recommendations to buy, sell, or hold shares based on the current and predicted stock price ranges. The analysis also considers broader market sector performance to determine an overall stock price rise probability score.
This document provides a summary of a company's financial performance and stock analysis over several quarters from 2020-2024. It includes metrics like sales, operating profit, net income, debt ratios, and earnings per share. The document also evaluates the company's current stock price compared to different indication price ranges, and suggests purchasing stocks if the price is between the mid and high mid ranges. Compliance notices at the end explain that the analysis is for reference only and the user bears full responsibility for investment decisions.
This document provides a summary of a company's financial performance and stock analysis over time. It includes tables with metrics like sales, operating profit, net income, debt ratios, and earnings per share from 2020-2024. Charts show the company's stock price probability score compared to industry averages and estimated purchase amounts for different stock price ranges. The analysis concludes the stock is currently undervalued and a purchase is recommended. Disclaimers note the analysis is for reference only and users are responsible for their own investment decisions based on this information.
This document provides a performance analysis of an algorithm company over several time periods. It includes key financial metrics such as sales, operating profit, net income, operating rate, net rate, return on equity, debt ratio, and quick ratio from 2020 to 2024. It also shows the company's stock price, earnings per share, book value per share, and dividends. The document analyzes the company's stock price rise probability score and increase rate for different sectors over time. It provides an investment opinion and suggested purchase amount for the company's stock.
This document provides a performance analysis of an algorithm (consolidated) over several time periods. It includes key financial metrics such as sales, operating profit, net income, operating rate, net rate, and debt ratio from 2020-2024. It also estimates stock prices at different indication price ranges and provides the gap between the current stock price and each range. Finally, it evaluates the stock price rise probability score over several periods and sectors to inform investment decisions.
This document provides a performance analysis of an algorithm (consolidated) company over several time periods. It includes financial metrics like sales, operating profit, net income, debt ratio, and earnings per share for recent quarters and annual periods. It also estimates the company's indication price range and stock price, along with investment opinions and strategies based on the algorithm's analysis of the company's performance and prospects. Disclaimers are provided that the analysis is for reference only and accuracy is not guaranteed, while compliance with laws regarding investment decisions and use of the information is required.
This document provides a summary of key financial metrics and analysis of an algorithm company over several quarters and years. It includes metrics like sales, operating profit, net income, debt ratios, and stock price indicators. Charts show the company's indication price compared to its current stock price and predictions for price changes. The analysis rates the company's stock price rise probability and provides strategies around purchasing amounts based on the indication price ranges.
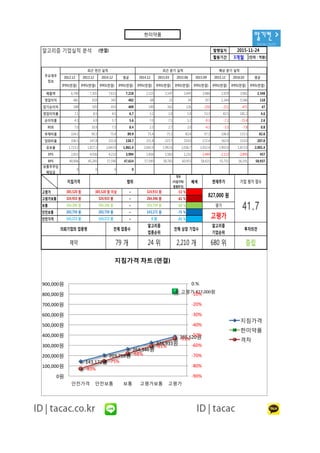
1. 알기컨 >
tacac.co.kr
알고리즘 기업실적 분석 (연결) 발행일자
활용기간 3개월 (단위 : 억원)
2012.12 2013.12 2014.12 평균 2014.12 2015.03 2015.06 2015.09 2015.12 2016.03 평균
IFRS(연결) IFRS(연결) IFRS(연결) IFRS(연결) IFRS(연결) IFRS(연결) IFRS(연결) IFRS(연결) IFRS(연결) IFRS(연결) IFRS(연결)
매출액 6,740 7,301 7,613 7,218 2,115 2,147 2,445 2,684 2,929 3,061 2,348
영업이익 481 619 345 482 68 21 24 357 1,244 5,546 118
당기순이익 288 505 433 409 149 162 126 -250 -211 -471 47
영업이익률 7.1 8.5 4.5 6.7 3.2 1.0 1.0 13.3 42.5 181.2 4.6
순이익률 4.3 6.9 5.7 5.6 7.0 7.5 5.2 -9.3 -7.2 -15.4 2.6
ROE 7.0 10.9 7.3 8.4 2.5 2.7 2.0 -4.2 -3.5 -7.8 0.8
부채비율 104.1 90.3 75.4 89.9 75.4 75.3 82.4 97.3 106.0 115.5 82.6
당좌비율 106.5 147.8 221.8 158.7 221.8 223.7 210.0 172.4 162.0 153.0 207.0
유보율 1,713.2 1,827.1 2,043.9 1,861.4 2,043.9 1,992.6 2,036.7 1,932.4 1,902.0 1,872.0 2,001.4
EPS 2,815 4,936 4,232 3,994 1,456 1,583 1,232 -2,444 -2,113 -2,895 457
BPS 40,006 45,245 57,590 47,614 57,590 58,783 60,953 58,421 55,751 56,191 58,937
보통주주당
배당금
0 0 0 0
2015-11-24
주요재무
정보
최근 연간 실적 예상 분기 실적최근 분기 실적
143,172원
203,759원
264,346원
324,933원
385,520원
고평가 827,000원
-83%
-75%
-68%
-61%
-53%
-90%
-80%
-70%
-60%
-50%
-40%
-30%
-20%
-10%
0.%
0원
100,000원
200,000원
300,000원
400,000원
500,000원
600,000원
700,000원
800,000원
900,000원
안전가격 안전보통 보통 고평가보통 고평가
지침가격 차트 (연결)
지침가격
한미약품
격차
격차
(지침가격/
현재주가)
배색
고평가 ~ -53 %
고평가보통 ~ -61 %
보통 ~ -68 %
안전보통 ~ -75 %
안전가격 ~ -83 %
투자의견의뢰기업의 업종명
제약 79 개 24 위 2,210 개 680 위 중립
전체 상장 기업수
알고리즘
기업순위
알고리즘
업종순위
전체 업종수
현재주가
827,000 원
평가
고평가0 원
385,520 원
324,933 원
264,346 원
203,759 원
143,172 원
385,520 원 이상
324,933 원
264,346 원
203,759 원
143,172 원
41.7
범위
324,933 원
264,346 원
203,759 원
143,172 원
지침가격 기업 평가 점수
공지사항
한미약품
2. 알기컨 >
tacac.co.kr공지사항 (compliance notice)
① 알고리즘 기업분석 컨설팅에서 제공하는 정보는 신뢰할 만한 자료 및 정보와
알고리즘 기업분석 프로그램(TACAP)을 통해 얻어진 것이나 그 정확성이나 완전
성을 보장 할 수 없으며, 시간이 경과함에 따라 변경될 수 있습니다. 따라서 정보
의 오류,누락에 대하여 알고리즘 기업분석 컨설팅에서 제공하는 자료의 대한 결
과에 대해 법적인 책임을 지지 않습니다.
② 알고리즘 기업분석 컨설팅 및 본 사이트에서 제공하는 모든 정보는 투자판단
의 참고자료이며, 투자의 최종 책임은 본 정보를 이용하시는 이용자에게 있습니
다.
③ 알고리즘 기업분석 컨설팅 및 본 사이트에서는 일임매매 등 관련법규에 위배
되는 행위는 일체 하지 않습니다.
④ 이용자는 알고리즘 기업분석 컨설팅 및 본 사이트에서 제공한 정보를 무단으
로 재배포 및 재활용 할 수 없습니다.
⑤ 알고리즘 기업분석 보고서의 정확성을 높이기 위해 활용기간을 필히 숙지하
시길 바랍니다.
①
알고리즘
성을
의
과에
②
의
다
③
되는
④
로
⑤
시길
Tel : 070 - 4667 - 5009 Email : tacac@tacac.co.kr
Homepage : tacac.co.kr Blog : tacac.blog.me
기업분석신청 : http://tacac.co.kr/?page_id=1374
3. 알기컨 >
tacac.co.kr
[예정 매입 금액] 임의 작성
-4% -1%
8%
-10%
-1%
-17%
-45%
59%
-85%
-10%-9% -14%
37%
-45%
-4%
-100%
-80%
-60%
-40%
-20%
0%
20%
40%
60%
80%
2015.07.28 2015.08.26 2015.09.23 2015.10.26 2015.11.23
주가 상승 확률 증가율
A 섹터
B 섹터
최종평균
49점 47점 46점
50점
46점 45점
35점
30점
20점
50점
27점 25점
42점
38점
33점
53점
36점 35점
0점
10점
20점
30점
40점
50점
60점
2015.06.30 2015.07.28 2015.08.26 2015.09.23 2015.10.26 2015.11.23
주가 상승 확률 점수
A 섹터
B 섹터
최종평균
한미약품
공지사항
알고리즘 주식매매 전략서 (연결) 발행일자
활용기간
격차
(지침가격/
현재주가)
배색
2015-11-24
3개월
8 주
5 주
4 주
3 주
2 주
-75 %
-83 %
1,049,282 원
1,151,286 원
예정 매입 금액
5,000,000 원
추천 매입 금액
지침가격 범위
-68 %
평가현재주가 투자의견
중립
주가 상승 확률 점수
28.0
1,392,328 원 추천 매입 주식수
-61 %324,933 원
~
324,933 원 ~
827,000 원 고평가
고평가 743,271 원385,520 원 385,520 원 이상 324,933 원 -53 %
2 주
매수 / 매도 매수 / 매도 주식수
143,172 원
0 원
845,275 원
947,278 원
고평가보통
보통
264,346 원
203,759 원
143,172 원
264,346 원
203,759 원
143,172 원
~
~
~
안전보통
안전가격
264,346 원
203,759 원
41.6 점 38.2 점 33.4 점 52.9 점 36.4 점 35.0 점
28.0
2015.11.23 주가 상승 확률 점수
A 섹터
B 섹터
최종 평균
48.6 점 46.8 점 46.3 점 50.1 점 45.7 점 45.4 점
34.6 점 29.6 점 20.4 점 50.1 점 27.1 점 24.6 점
2015.06.30 2015.07.28 2015.08.26 2015.09.23 2015.10.26
-17 %B 섹터
40.7-7 %
-1 %-10 %8 %-1 %-4 %A 섹터
최종 평균 -9 % -14 % 37 % -45 % -4 %
-45 % 59 % -85 % -10 %
최종 점수최종 증가율2015.11.232015.10.262015.09.232015.08.262015.07.28
4. 알기컨 >
tacac.co.kr공지사항 (compliance notice)
① 알고리즘 기업분석 컨설팅에서 제공하는 정보는 신뢰할 만한 자료 및 정보와
알고리즘 기업분석 프로그램(TACAP)을 통해 얻어진 것이나 그 정확성이나 완전
성을 보장 할 수 없으며, 시간이 경과함에 따라 변경될 수 있습니다. 따라서 정보
의 오류,누락에 대하여 알고리즘 기업분석 컨설팅에서 제공하는 자료의 대한 결
과에 대해 법적인 책임을 지지 않습니다.
② 알고리즘 기업분석 컨설팅 및 본 사이트에서 제공하는 모든 정보는 투자판단
의 참고자료이며, 투자의 최종 책임은 본 정보를 이용하시는 이용자에게 있습니
다.
③ 알고리즘 기업분석 컨설팅 및 본 사이트에서는 일임매매 등 관련법규에 위배
되는 행위는 일체 하지 않습니다.
④ 이용자는 알고리즘 기업분석 컨설팅 및 본 사이트에서 제공한 정보를 무단으
로 재배포 및 재활용 할 수 없습니다.
⑤ 알고리즘 기업분석 보고서의 정확성을 높이기 위해 활용기간을 필히 숙지하
시길 바랍니다.
Tel : 070 - 4667 - 5009 Email : tacac@tacac.co.kr
Homepage : tacac.co.kr Blog : tacac.blog.me
기업분석신청 : http://tacac.co.kr/?page_id=1374
①
알고리즘
성을
의
과에
②
의
다
③
되는
④
로
⑤
시길