Este documento proporciona instrucciones sobre el uso de las barras de herramientas y menús en Word, incluyendo cómo agregar sombreado, color y rellenos a gráficos. También explica cómo insertar y modificar marcadores, estilos y saltos de página. Por último, describe cómo crear y administrar documentos maestros y subdocumentos.
El documento contrasta el sentido literal y figurado de las palabras. El sentido literal mantiene el significado habitual de una palabra o frase, mientras que el sentido figurado no corresponde directamente con su significado habitual e implica algo más allá de su definición.
1) Chronic hepatitis C virus infection can cause a variety of extrahepatic manifestations including mixed cryoglobulinemia, a condition where low levels of cryoglobulins in the blood vessel can lead to inflammation.
2) Rituximab, a monoclonal antibody targeting CD20 found on B cells, has shown effectiveness in treating the symptoms of mixed cryoglobulinemia, particularly rashes and kidney involvement.
3) Combining rituximab treatment with pegylated interferon and ribavirin therapy may provide the best chance of achieving both clinical response and viral clearance for patients with mixed cryoglobulinemia caused by chronic hepatitis C infection.
The document is a June 2014 market report on the central business district (CBD) of Ho Chi Minh City covering the office, retail, hotel, and serviced apartment markets. It provides an overview and performance data for each sector, including occupancy rates, rental rates, and outlooks. The key findings are that Grade A office occupancy rates increased in May while rents declined slightly, retail rental rates remained stable but occupancy continued to drop, and the hotel sector saw improving performance and outlook.
The Food Security Bill aims to provide subsidized food grains to 75% of India's population. It legally entitles priority households to 35kg of grains per month and general households to 5kg per person per month. It also includes provisions for maternal and child nutrition programs. However, there are concerns about the large cost of implementation and risk of leakage given the scale of public distribution needed. Proper identification of beneficiaries and enforcement of transparency measures will be critical to the success of the bill.
Este documento proporciona una receta para un pastel de surimi que incluye 250g de surimi o palitos de cangrejo, 3 huevos, sal, 200ml de nata para cocinar y 100ml de tomate frito. Las instrucciones indican picar el surimi y mezclarlo con los demás ingredientes en un bol, verter la mezcla en un molde para microondas engrasado y cocinarlo durante 5 minutos en el microondas.
The document contains performance data and analysis for an algorithm company from December 2020 to April 2024. It provides financial metrics like sales, operating profit, net income, debt ratio, and EPS on a quarterly and annual basis. It also includes the company's stock price trends, probability of price increases, and recommendations to buy, sell, or hold amounts of the company's stocks. The analysis is from The Algorithm Company Analysis Consulting, which provides investment consulting services but does not guarantee the accuracy of the data and analysis.
This document provides a performance analysis and stock trading strategy for Algorithm (consolidated) 003650 over a 3-month period. It summarizes the company's recent annual and quarterly financial performance. It then provides the stock's current and projected price ranges, an evaluation of the stock, and a suggested purchase amount. It outlines buying and selling amounts for the stock across different price ranges. Finally, it shows the stock's predicted probability of rising in price over the next 3 months according to two sectors and on average.
This document provides a summary of a company's financial performance and stock price predictions over several quarters based on an analysis by an algorithm. It shows key metrics like sales, profits, debt ratios, and stock prices historically and makes recommendations to buy, sell, or hold shares based on the current and predicted stock price ranges. The analysis also considers broader market sector performance to determine an overall stock price rise probability score.
This document provides a summary of a company's financial performance and stock analysis over several quarters from 2020-2024. It includes metrics like sales, operating profit, net income, debt ratios, and earnings per share. The document also evaluates the company's current stock price compared to different indication price ranges, and suggests purchasing stocks if the price is between the mid and high mid ranges. Compliance notices at the end explain that the analysis is for reference only and the user bears full responsibility for investment decisions.
This document provides a summary of a company's financial performance and stock analysis over time. It includes tables with metrics like sales, operating profit, net income, debt ratios, and earnings per share from 2020-2024. Charts show the company's stock price probability score compared to industry averages and estimated purchase amounts for different stock price ranges. The analysis concludes the stock is currently undervalued and a purchase is recommended. Disclaimers note the analysis is for reference only and users are responsible for their own investment decisions based on this information.
This document provides a performance analysis of an algorithm company over several time periods. It includes key financial metrics such as sales, operating profit, net income, operating rate, net rate, return on equity, debt ratio, and quick ratio from 2020 to 2024. It also shows the company's stock price, earnings per share, book value per share, and dividends. The document analyzes the company's stock price rise probability score and increase rate for different sectors over time. It provides an investment opinion and suggested purchase amount for the company's stock.
This document provides a performance analysis of an algorithm (consolidated) over several time periods. It includes key financial metrics such as sales, operating profit, net income, operating rate, net rate, and debt ratio from 2020-2024. It also estimates stock prices at different indication price ranges and provides the gap between the current stock price and each range. Finally, it evaluates the stock price rise probability score over several periods and sectors to inform investment decisions.
This document provides a performance analysis of an algorithm (consolidated) company over several time periods. It includes financial metrics like sales, operating profit, net income, debt ratio, and earnings per share for recent quarters and annual periods. It also estimates the company's indication price range and stock price, along with investment opinions and strategies based on the algorithm's analysis of the company's performance and prospects. Disclaimers are provided that the analysis is for reference only and accuracy is not guaranteed, while compliance with laws regarding investment decisions and use of the information is required.
This document provides a summary of key financial metrics and analysis of an algorithm company over several quarters and years. It includes metrics like sales, operating profit, net income, debt ratios, and stock price indicators. Charts show the company's indication price compared to its current stock price and predictions for price changes. The analysis rates the company's stock price rise probability and provides strategies around purchasing amounts based on the indication price ranges.
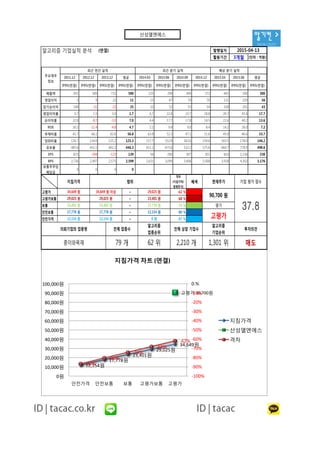
1. 알기컨 >
tacac.co.kr
알고리즘 기업실적 분석 (연결) 발행일자
활용기간 3개월 (단위 : 억원)
2011.12 2012.12 2013.12 평균 2014.03 2014.06 2014.09 2014.12 2015.03 2015.06 평균
IFRS(연결) IFRS(연결) IFRS(연결) IFRS(연결) IFRS(연결) IFRS(연결) IFRS(연결) IFRS(연결) IFRS(연결) IFRS(연결) IFRS(연결)
매출액 451 589 731 590 225 294 309 372 441 500 300
영업이익 3 9 22 11 15 67 70 70 131 229 56
당기순이익 148 -51 -22 25 10 52 55 54 100 201 43
영업이익률 0.7 1.5 3.0 1.7 6.7 22.8 22.7 18.8 29.7 45.8 17.7
순이익률 32.8 -8.7 -3.0 7.0 4.4 17.7 17.8 14.5 22.6 40.2 13.6
ROE 30.3 -11.4 -4.8 4.7 2.1 9.4 9.0 8.4 14.2 26.0 7.2
부채비율 41.7 66.1 62.6 56.8 63.8 52.3 47.1 51.6 49.0 46.6 53.7
당좌비율 126.7 134.0 115.2 125.3 117.7 152.8 163.6 150.6 163.5 178.0 146.2
유보율 485.6 451.1 402.2 446.3 411.1 475.6 532.2 575.6 664.7 778.9 498.6
EPS 825 -284 -123 139 56 290 307 301 603 1,156 238
BPS 2,726 2,497 2,575 2,599 2,631 3,099 3,406 3,568 3,918 4,302 3,176
보통주주당
배당금
0 0 0 0
2015-04-13
주요재무
정보
최근 연간 실적 예상 분기 실적최근 분기 실적
12,154원
17,778원
23,401원
29,025원
34,649원
고평가 90,700원
-87%
-80%
-74%
-68%
-62%
-100%
-90%
-80%
-70%
-60%
-50%
-40%
-30%
-20%
-10%
0.%
0원
10,000원
20,000원
30,000원
40,000원
50,000원
60,000원
70,000원
80,000원
90,000원
100,000원
안전가격 안전보통 보통 고평가보통 고평가
지침가격 차트 (연결)
지침가격
산성앨엔에스
격차
격차
(지침가격/
현재주가)
배색
고평가 ~ -62 %
고평가보통 ~ -68 %
보통 ~ -74 %
안전보통 ~ -80 %
안전가격 ~ -87 %
투자의견의뢰기업의 업종명
종이와목재 79 개 62 위 2,210 개 1,301 위 매도
전체 상장 기업수
알고리즘
기업순위
알고리즘
업종순위
전체 업종수
현재주가
90,700 원
평가
고평가0 원
34,649 원
29,025 원
23,401 원
17,778 원
12,154 원
34,649 원 이상
29,025 원
23,401 원
17,778 원
12,154 원
37.8
범위
29,025 원
23,401 원
17,778 원
12,154 원
지침가격 기업 평가 점수
공지사항
산성앨엔에스
2. 알기컨 >
tacac.co.kr공지사항 (compliance notice)
① 알고리즘 기업분석 컨설팅에서 제공하는 정보는 신뢰할 만한 자료 및 정보와
알고리즘 기업분석 프로그램(TACAP)을 통해 얻어진 것이나 그 정확성이나 완전
성을 보장 할 수 없으며, 시간이 경과함에 따라 변경될 수 있습니다. 따라서 정보
의 오류,누락에 대하여 알고리즘 기업분석 컨설팅에서 제공하는 자료의 대한 결
과에 대해 법적인 책임을 지지 않습니다.
② 알고리즘 기업분석 컨설팅 및 본 사이트에서 제공하는 모든 정보는 투자판단
의 참고자료이며, 투자의 최종 책임은 본 정보를 이용하시는 이용자에게 있습니
다.
③ 알고리즘 기업분석 컨설팅 및 본 사이트에서는 일임매매 등 관련법규에 위배
되는 행위는 일체 하지 않습니다.
④ 이용자는 알고리즘 기업분석 컨설팅 및 본 사이트에서 제공한 정보를 무단으
로 재배포 및 재활용 할 수 없습니다.
⑤ 알고리즘 기업분석 보고서의 정확성을 높이기 위해 활용기간을 필히 숙지하
시길 바랍니다.
①
알고리즘
성을
의
과에
②
의
다
③
되는
④
로
⑤
시길
Tel : 070 - 4667 - 5009 Email : tacac@tacac.co.kr
Homepage : tacac.co.kr Blog : tacac.blog.me
기업분석신청 : http://tacac.co.kr/?page_id=1374
3. 알기컨 >
tacac.co.kr
[예정 매입 금액] 임의 작성
-6%
11%
-5% -1% -3%
-32%
31%
23%
-19%
-64%
-16%
20%
-3%
4%
-24%
-80%
-60%
-40%
-20%
0%
20%
40%
2014.12.11 2015.01.13 2015.02.10 2015.03.13 2015.04.10
주가 상승 확률 증가율
A 섹터
B 섹터
최종평균
49점
46점
52점 50점 49점 48점
35점
26점
38점
50점
42점
25점
42점
36점
45점 44점 45점
37점
0점
10점
20점
30점
40점
50점
60점
2014.11.13 2014.12.11 2015.01.13 2015.02.10 2015.03.13 2015.04.10
주가 상승 확률 점수
A 섹터
B 섹터
최종평균
산성앨엔에스
공지사항
알고리즘 주식매매 전략서 (연결) 발행일자
활용기간
격차
(지침가격/
현재주가)
배색
2015-04-13
3개월
13 주
8 주
6 주
4 주
3 주
-80 %
-87 %
147,464 원
158,836 원
예정 매입 금액
1,500,000 원
추천 매입 금액
지침가격 범위
-74 %
평가현재주가 투자의견
매도
주가 상승 확률 점수
29.2
183,414 원 추천 매입 주식수
-68 %29,025 원
~
29,025 원 ~
90,700 원 고평가
고평가 113,347 원34,649 원 34,649 원 이상 29,025 원 -62 %
2 주
매수 / 매도 매수 / 매도 주식수
12,154 원
0 원
124,719 원
136,091 원
고평가보통
보통
23,401 원
17,778 원
12,154 원
23,401 원
17,778 원
12,154 원
~
~
~
안전보통
안전가격
23,401 원
17,778 원
41.8 점 36.2 점 44.9 점 43.8 점 45.4 점 36.5 점
29.2
2015.04.10 주가 상승 확률 점수
A 섹터
B 섹터
최종 평균
48.9 점 46.1 점 51.9 점 49.6 점 49.2 점 47.6 점
34.6 점 26.3 점 37.9 점 49.6 점 41.7 점 25.4 점
2014.11.13 2014.12.11 2015.01.13 2015.02.10 2015.03.13
-32 %B 섹터
43.3-4 %
-3 %-1 %-5 %11 %-6 %A 섹터
최종 평균 -16 % 20 % -3 % 4 % -24 %
31 % 23 % -19 % -64 %
최종 점수최종 증가율2015.04.102015.03.132015.02.102015.01.132014.12.11
4. 알기컨 >
tacac.co.kr공지사항 (compliance notice)
① 알고리즘 기업분석 컨설팅에서 제공하는 정보는 신뢰할 만한 자료 및 정보와
알고리즘 기업분석 프로그램(TACAP)을 통해 얻어진 것이나 그 정확성이나 완전
성을 보장 할 수 없으며, 시간이 경과함에 따라 변경될 수 있습니다. 따라서 정보
의 오류,누락에 대하여 알고리즘 기업분석 컨설팅에서 제공하는 자료의 대한 결
과에 대해 법적인 책임을 지지 않습니다.
② 알고리즘 기업분석 컨설팅 및 본 사이트에서 제공하는 모든 정보는 투자판단
의 참고자료이며, 투자의 최종 책임은 본 정보를 이용하시는 이용자에게 있습니
다.
③ 알고리즘 기업분석 컨설팅 및 본 사이트에서는 일임매매 등 관련법규에 위배
되는 행위는 일체 하지 않습니다.
④ 이용자는 알고리즘 기업분석 컨설팅 및 본 사이트에서 제공한 정보를 무단으
로 재배포 및 재활용 할 수 없습니다.
⑤ 알고리즘 기업분석 보고서의 정확성을 높이기 위해 활용기간을 필히 숙지하
시길 바랍니다.
Tel : 070 - 4667 - 5009 Email : tacac@tacac.co.kr
Homepage : tacac.co.kr Blog : tacac.blog.me
기업분석신청 : http://tacac.co.kr/?page_id=1374
①
알고리즘
성을
의
과에
②
의
다
③
되는
④
로
⑤
시길