The document contains performance data and analysis for an algorithm company from December 2020 to April 2024. It provides financial metrics like sales, operating profit, net income, debt ratio, and EPS on a quarterly and annual basis. It also includes the company's stock price trends, probability of price increases, and recommendations to buy, sell, or hold amounts of the company's stocks. The analysis is from The Algorithm Company Analysis Consulting, which provides investment consulting services but does not guarantee the accuracy of the data and analysis.
This document provides a performance analysis and stock trading strategy for Algorithm (consolidated) 003650 over a 3-month period. It summarizes the company's recent annual and quarterly financial performance. It then provides the stock's current and projected price ranges, an evaluation of the stock, and a suggested purchase amount. It outlines buying and selling amounts for the stock across different price ranges. Finally, it shows the stock's predicted probability of rising in price over the next 3 months according to two sectors and on average.
This document provides a summary of a company's financial performance and stock price predictions over several quarters based on an analysis by an algorithm. It shows key metrics like sales, profits, debt ratios, and stock prices historically and makes recommendations to buy, sell, or hold shares based on the current and predicted stock price ranges. The analysis also considers broader market sector performance to determine an overall stock price rise probability score.
This document provides a summary of a company's financial performance and stock analysis over several quarters from 2020-2024. It includes metrics like sales, operating profit, net income, debt ratios, and earnings per share. The document also evaluates the company's current stock price compared to different indication price ranges, and suggests purchasing stocks if the price is between the mid and high mid ranges. Compliance notices at the end explain that the analysis is for reference only and the user bears full responsibility for investment decisions.
This document provides a summary of a company's financial performance and stock analysis over time. It includes tables with metrics like sales, operating profit, net income, debt ratios, and earnings per share from 2020-2024. Charts show the company's stock price probability score compared to industry averages and estimated purchase amounts for different stock price ranges. The analysis concludes the stock is currently undervalued and a purchase is recommended. Disclaimers note the analysis is for reference only and users are responsible for their own investment decisions based on this information.
This document provides a performance analysis of an algorithm company over several time periods. It includes key financial metrics such as sales, operating profit, net income, operating rate, net rate, return on equity, debt ratio, and quick ratio from 2020 to 2024. It also shows the company's stock price, earnings per share, book value per share, and dividends. The document analyzes the company's stock price rise probability score and increase rate for different sectors over time. It provides an investment opinion and suggested purchase amount for the company's stock.
This document provides a performance analysis of an algorithm (consolidated) over several time periods. It includes key financial metrics such as sales, operating profit, net income, operating rate, net rate, and debt ratio from 2020-2024. It also estimates stock prices at different indication price ranges and provides the gap between the current stock price and each range. Finally, it evaluates the stock price rise probability score over several periods and sectors to inform investment decisions.
This document provides a performance analysis of an algorithm (consolidated) company over several time periods. It includes financial metrics like sales, operating profit, net income, debt ratio, and earnings per share for recent quarters and annual periods. It also estimates the company's indication price range and stock price, along with investment opinions and strategies based on the algorithm's analysis of the company's performance and prospects. Disclaimers are provided that the analysis is for reference only and accuracy is not guaranteed, while compliance with laws regarding investment decisions and use of the information is required.
This document provides a summary of key financial metrics and analysis of an algorithm company over several quarters and years. It includes metrics like sales, operating profit, net income, debt ratios, and stock price indicators. Charts show the company's indication price compared to its current stock price and predictions for price changes. The analysis rates the company's stock price rise probability and provides strategies around purchasing amounts based on the indication price ranges.
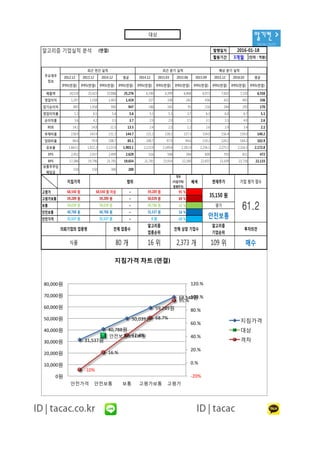
1. 알기컨 >
tacac.co.kr
알고리즘 기업실적 분석 (연결) 발행일자
활용기간 3개월 (단위 : 억원)
2012.12 2013.12 2014.12 평균 2014.12 2015.03 2015.06 2015.09 2015.12 2016.03 평균
IFRS(연결) IFRS(연결) IFRS(연결) IFRS(연결) IFRS(연결) IFRS(연결) IFRS(연결) IFRS(연결) IFRS(연결) IFRS(연결) IFRS(연결)
매출액 24,518 25,423 25,888 25,276 6,390 6,399 6,468 6,973 7,002 7,320 6,558
영업이익 1,297 1,558 1,403 1,419 327 338 242 436 421 492 336
당기순이익 883 1,058 900 947 186 183 95 216 244 293 170
영업이익률 5.3 6.1 5.4 5.6 5.1 5.3 3.7 6.3 6.0 6.7 5.1
순이익률 3.6 4.2 3.5 3.7 2.9 2.9 1.5 3.1 3.5 4.0 2.6
ROE 14.1 14.8 11.5 13.5 2.4 2.3 1.2 2.6 2.9 3.4 2.1
부채비율 158.9 143.9 131.3 144.7 131.3 138.1 137.3 154.0 156.4 159.0 140.2
당좌비율 66.6 79.9 108.7 85.1 108.7 97.9 94.6 110.2 124.2 144.2 102.9
유보율 1,663.1 1,922.2 2,123.9 1,903.1 2,123.9 2,149.4 2,181.9 2,236.1 2,275.5 2,316.3 2,172.8
EPS 2,452 2,937 2,499 2,629 516 508 264 600 705 811 472
BPS 17,386 19,796 21,781 19,654 21,781 21,914 22,180 22,655 23,109 23,718 22,133
보통주주당
배당금
150 150 300 200
최근 연간 실적 예상 분기 실적최근 분기 실적
2016-01-18
주요재무
정보
31,537원
40,788원
50,039원
59,289원
68,540원
안전보통 35,150원
-10%
16.%
42.4%
68.7%
95.%
-20%
0.%
20.%
40.%
60.%
80.%
100.%
120.%
0원
10,000원
20,000원
30,000원
40,000원
50,000원
60,000원
70,000원
80,000원
안전가격 안전보통 보통 고평가보통 고평가
지침가격 차트 (연결)
지침가격
대상
격차
격차
(지침가격/
현재주가)
배색
고평가 ~ 95 %
고평가보통 ~ 69 %
보통 ~ 42 %
안전보통 ~ 16 %
안전가격 ~ -10 %
61.2
범위
59,289 원
50,039 원
40,788 원
31,537 원
지침가격 기업 평가 점수
50,039 원
40,788 원
31,537 원
현재주가
35,150 원
평가
안전보통0 원
68,540 원
59,289 원
50,039 원
40,788 원
31,537 원
68,540 원 이상
59,289 원
투자의견의뢰기업의 업종명
식품 80 개 16 위 2,373 개 109 위 매수
전체 상장 기업수
알고리즘
기업순위
알고리즘
업종순위
전체 업종수
공지사항
대상
2. 알기컨 >
tacac.co.kr공지사항 (compliance notice)
① 알고리즘 기업분석 컨설팅에서 제공하는 정보는 신뢰할 만한 자료 및 정보와
알고리즘 기업분석 프로그램(TACAP)을 통해 얻어진 것이나 그 정확성이나 완전
성을 보장 할 수 없으며, 시간이 경과함에 따라 변경될 수 있습니다. 따라서 정보
의 오류,누락에 대하여 알고리즘 기업분석 컨설팅에서 제공하는 자료의 대한 결
과에 대해 법적인 책임을 지지 않습니다.
② 알고리즘 기업분석 컨설팅 및 본 사이트에서 제공하는 모든 정보는 투자판단
의 참고자료이며, 투자의 최종 책임은 본 정보를 이용하시는 이용자에게 있습니
다.
③ 알고리즘 기업분석 컨설팅 및 본 사이트에서는 일임매매 등 관련법규에 위배
되는 행위는 일체 하지 않습니다.
④ 이용자는 알고리즘 기업분석 컨설팅 및 본 사이트에서 제공한 정보를 무단으
로 재배포 및 재활용 할 수 없습니다.
⑤ 알고리즘 기업분석 보고서의 정확성을 높이기 위해 활용기간을 필히 숙지하
시길 바랍니다.
①
알고리즘
성을
의
과에
②
의
다
③
되는
④
로
⑤
시길
Tel : 070 - 4667 - 5009 Email : tacac@tacac.co.kr
Homepage : tacac.co.kr Blog : tacac.blog.me
기업분석신청 : http://tacac.co.kr/?page_id=1374
3. [예정 매입 금액] 임의 작성
알기컨 >
tacac.co.kr
17%
-14%
-4%
10%
2%
57%
-61%
34%
25%
-41%
36%
-32% -27%
45%
-18%
-80%
-60%
-40%
-20%
0%
20%
40%
60%
80%
2015.09.17 2015.10.20 2015.11.17 2015.12.15 2016.01.15
주가 상승 확률 증가율
A 섹터
B 섹터
최종평균
43점
52점
46점 44점
49점 50점
20점
46점
29점
44점
58점
41점
32점
49점
37점
29점
54점
45점
0점
10점
20점
30점
40점
50점
60점
70점
2015.08.20 2015.09.17 2015.10.20 2015.11.17 2015.12.15 2016.01.15
주가 상승 확률 점수
A 섹터
B 섹터
최종평균
대상
공지사항
알고리즘 주식매매 전략서 (연결) 발행일자
활용기간
격차
(지침가격/
현재주가)
배색
~
~
~
안전보통
안전가격
50,039 원
40,788 원
68,540 원 68,540 원 이상 59,289 원 95 %
145 주
매수 / 매도 매수 / 매도 주식수
31,537 원
0 원
-3,508,019 원
-2,163,677 원
고평가보통
보통
50,039 원
40,788 원
31,537 원
50,039 원
40,788 원
31,537 원
범위
42 %
평가현재주가 투자의견
매수
주가 상승 확률 점수
42.3
5,108,153 원 추천 매입 주식수
69 %59,289 원
~
59,289 원 ~
35,150 원 안전보통
고평가 -4,852,360 원
예정 매입 금액
10,000,000 원
추천 매입 금액
지침가격
-819,335 원
525,006 원
2016-01-18
3개월
17 주
-20 주
-43 주
-59 주
-71 주
16 %
-10 %
B 섹터
최종 평균
43.2 점 51.8 점 45.6 점 43.9 점 48.7 점 49.7 점
20.0 점 46.3 점 28.8 점 43.9 점 58.3 점 41.3 점
2015.08.20 2015.09.17 2015.10.20 2015.11.17 2015.12.15 2016.01.15 주가 상승 확률 점수
A 섹터
31.6 점 49.0 점 37.2 점 29.2 점 53.5 점 45.5 점
42.3
최종 증가율2016.01.152015.12.152015.11.172015.10.202015.09.17
57 %B 섹터
49.01 %
2 %10 %-4 %-14 %17 %A 섹터
최종 평균 36 % -32 % -27 % 45 % -18 %
-61 % 34 % 25 % -41 %
최종 점수
4. 알기컨 >
tacac.co.kr공지사항 (compliance notice)
① 알고리즘 기업분석 컨설팅에서 제공하는 정보는 신뢰할 만한 자료 및 정보와
알고리즘 기업분석 프로그램(TACAP)을 통해 얻어진 것이나 그 정확성이나 완전
성을 보장 할 수 없으며, 시간이 경과함에 따라 변경될 수 있습니다. 따라서 정보
의 오류,누락에 대하여 알고리즘 기업분석 컨설팅에서 제공하는 자료의 대한 결
과에 대해 법적인 책임을 지지 않습니다.
② 알고리즘 기업분석 컨설팅 및 본 사이트에서 제공하는 모든 정보는 투자판단
의 참고자료이며, 투자의 최종 책임은 본 정보를 이용하시는 이용자에게 있습니
다.
③ 알고리즘 기업분석 컨설팅 및 본 사이트에서는 일임매매 등 관련법규에 위배
되는 행위는 일체 하지 않습니다.
④ 이용자는 알고리즘 기업분석 컨설팅 및 본 사이트에서 제공한 정보를 무단으
로 재배포 및 재활용 할 수 없습니다.
⑤ 알고리즘 기업분석 보고서의 정확성을 높이기 위해 활용기간을 필히 숙지하
시길 바랍니다.
Tel : 070 - 4667 - 5009 Email : tacac@tacac.co.kr
Homepage : tacac.co.kr Blog : tacac.blog.me
기업분석신청 : http://tacac.co.kr/?page_id=1374
①
알고리즘
성을
의
과에
②
의
다
③
되는
④
로
⑤
시길