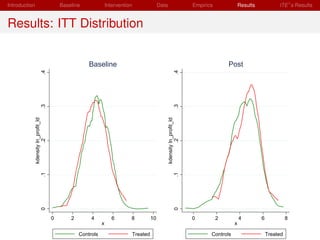
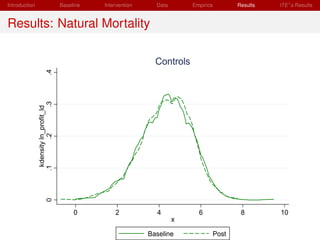
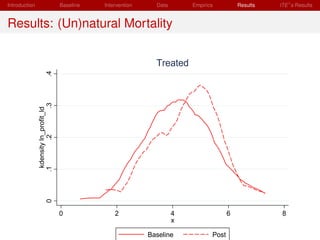
The document summarizes a study that evaluated the impact of a business literacy intervention in rural Mexico. The intervention provided free 6-week business skills courses taught by professors and students to about 25 women entrepreneurs per class. The courses covered topics like accounting, pricing, taxes, and marketing. The study found that the training led to large, positive and significant effects on profits, revenues, and number of clients both in the short- and medium-run. There was also evidence of heterogeneous treatment effects. The results suggest the training improved accounting practices, lowered costs, increased mark-ups, and in some cases lowered prices.

![Introduction Baseline Intervention Data Empirics Results ITE s Results
Motivation
Self employment is prevalent in the developing world
In 2002, the % of self-employed non-agricultural workers is above 60% in
sub-Saharan Africa, the Middle East, North Africa, Latin America, and Asia
Small businesses are often badly managed and rarely have any formal
accounting [DeMel et al., 2008 and 2009; Karlan and Valdivia, 2011;
Bloom et al., 2012]. In particular low returns to capital for females
[DeMel et al., 2008]
As a consequence small businesses might be unprofitable and destined
to fail
Do those businesses lack managerial capital? Most of the discussion
has focused on credit [Morduch and Karlan, 2009], also mis-allocation
of capital [Banerjee and Duflo, 2012]](https://image.slidesharecdn.com/amdslides12062012-130108161859-phpapp02/85/12-06-2012-Giacomo-de-Giorgi-2-320.jpg)
![Introduction Baseline Intervention Data Empirics Results ITE s Results
Introduction
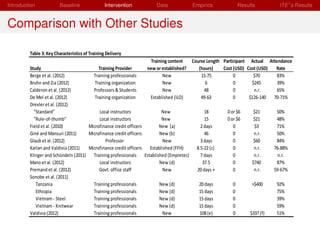
In early 2008 we designed a business literacy intervention in
partnership with a newly founded Mexican NGO: CREA
Previous designs had the provision of business training attached to
microfinance operations [Field et al., 2010; Karlan and Valdivia, 2011;
Drexler et al., 2011]. This makes it harder to identify the parameter of
interest [DeMel et al., 2012]. Bloom et al. (2012) is an exception on
managerial capital in large Indian firms. See MacKenzie and Woodruff
(2012) for a survey.
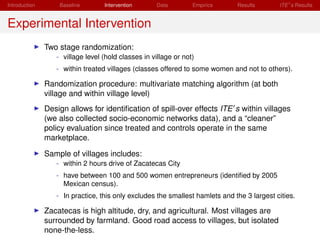
We use a two-stages randomization which helps us identifying ITE s
[Miguel and Kremer, 2004; Angelucci and De Giorgi, 2009] and deal
with GE effects
Provision of business classes in late 2009 for 6 weeks (48 hours in total)
Baseline data summer 2009, first follow-up late summer/fall of 2010,
Second follow-up in the spring of 2012](https://image.slidesharecdn.com/amdslides12062012-130108161859-phpapp02/85/12-06-2012-Giacomo-de-Giorgi-3-320.jpg)


![Introduction Baseline Intervention Data Empirics Results ITE s Results
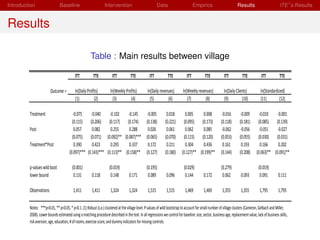
Results (no X s)
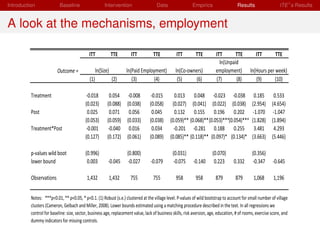
ITT TTE ITT TTE ITT TTE ITT TTE ITT TTE ITT TTE ITT TTE
Outcome = ln(Daily Profits) ln(Weekly Profits) ln(Daily revenues) ln(Weekly revenues) ln(Daily Clients) Standardized Outcomes 1[Accounting]
(1) (2) (3) (4) (5) (6) (7) (8) (7) (8) (7) (8) (7) (8)
Treatment ‐0.079 ‐0.117 ‐0.128 ‐0.186 ‐0.050 ‐0.074 ‐0.109 ‐0.165 ‐0.072 ‐0.110 ‐0.047 ‐0.072 ‐0.032* ‐0.035
(0.128) (0.194) (0.111) (0.162) (0.149) (0.223) (0.119) (0.183) (0.134) (0.206) (0.093) (0.143) (0.017) (0.020)
1{Wave=2} ‐0.055 ‐0.055 0.214** 0.214** 0.038 0.038 0.181** 0.181** ‐0.065 ‐0.065 ‐0.013 ‐0.013 0.002 0.001
(0.072) (0.072) (0.094) (0.094) (0.068) (0.068) (0.083) (0.083) (0.080) (0.080) (0.033) (0.033) (0.013) (0.011)
1{Wave=3} 0.169* 0.169* 0.394*** 0.394*** 0.126 0.126 0.244*** 0.244*** ‐0.066 ‐0.066 ‐0.042 ‐0.042 0.083*** 0.087***
(0.089) (0.089) (0.082) (0.082) (0.082) (0.082) (0.078) (0.078) (0.074) (0.074) (0.051) (0.051) (0.019) (0.019)
Treatment*1{Wave=2} 0.340*** 0.462*** 0.217 0.304* 0.065 0.096 0.215 0.313 0.251 0.337 0.130* 0.185 0.052 0.033
(0.108) (0.156) (0.130) (0.173) (0.129) (0.193) (0.145) (0.218) (0.148) (0.210) (0.072) (0.110) (0.034) (0.021)
Treatment*1{Wave=3} 0.279* 0.383* 0.203 0.288 0.191 0.262 0.140 0.206 0.159 0.226 0.143 0.200 0.073 0.059
(0.152) (0.210) (0.157) (0.220) (0.171) (0.245) (0.177) (0.244) (0.208) (0.294) (0.102) (0.146) (0.066) (0.083)
Observations 1,407 1,407 1,320 1,320 1,536 1,536 1,471 1,471 1,358 1,358 1,795 1,795 1,844 1,844
Treatment*1{Wave=2}=
Treatment*1{Wave=3} 0.752 0.772 0.936 0.946 0.396 0.411 0.763 0.752 0.619 0.635 0.908 0.921 0.790 0.784
Notes: ***p<0.01, ** p<0.05, * p<0.1. (1) Robust (s.e.) clustered at the village level.](https://image.slidesharecdn.com/amdslides12062012-130108161859-phpapp02/85/12-06-2012-Giacomo-de-Giorgi-46-320.jpg)
![Introduction Baseline Intervention Data Empirics Results ITE s Results
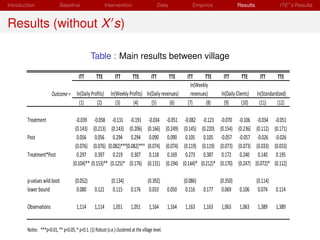
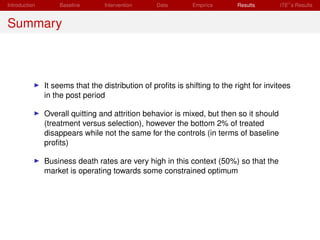
Results Pooled (no X s)
ITT TTE ITT TTE ITT TTE ITT TTE ITT TTE ITT TTE ITT TTE
Standardized
Outcome = ln(Daily Profits) ln(Weekly Profits) ln(Daily revenues) ln(Weekly revenues) ln(Daily Clients) Outcomes 1[Accounting]
(1) (2) (3) (4) (5) (6) (7) (8) (7) (8) (7) (8) (7) (8)
Treatment ‐0.079 ‐0.117 ‐0.128 ‐0.186 ‐0.050 ‐0.074 ‐0.109 ‐0.165 ‐0.072 ‐0.110 ‐0.047 (0.143) ‐0.035* ‐0.035
(0.128) (0.194) (0.111) (0.161) (0.149) (0.223) (0.119) (0.183) (0.134) (0.206) (0.093) ‐0.072 (0.019) (0.020)
Post 0.029 0.029 0.279*** 0.279*** 0.082 0.082 0.207*** 0.207*** ‐0.066 ‐0.066 ‐0.024 ‐0.024 0.032*** 0.034***
(0.069) (0.069) (0.078) (0.078) (0.061) (0.061) (0.061) (0.061) (0.065) (0.065) (0.032) (0.032) (0.010) (0.010)
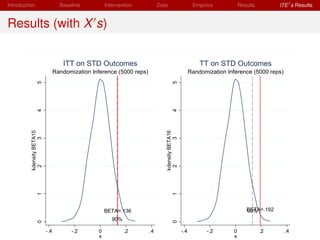
Treatment*Post 0.320*** 0.437*** 0.218* 0.306* 0.116 0.166 0.183* 0.266 0.193 0.268 0.136* 0.192* 0.062 0.040
(0.091) (0.132) (0.115) (0.158) (0.131) (0.196) (0.103) (0.157) (0.160) (0.231) (0.066) (0.102) (0.040) (0.026)
P‐value: Random Inference [0.028] [.001] [.16] [.05] [.369] [.2] [.165] [.035] [.168] [.044] [.067] [.013] [.073] [.105]
Observations 1,407 1,407 1,320 1,320 1,536 1,536 1,471 1,471 1,358 1,358 1,795 1,795 1,844 1,844
Notes: ***p<0.01, ** p<0.05, * p<0.1. (1) Robust (s.e.) clustered at the village level. Permutation test two‐sided p‐values within [brackets] for the treatment effect, based on 5000 replications.](https://image.slidesharecdn.com/amdslides12062012-130108161859-phpapp02/85/12-06-2012-Giacomo-de-Giorgi-47-320.jpg)