
Recommended
More Related Content
What's hot
What's hot (20)
Viewers also liked
Similar to 12 8to10
Similar to 12 8to10 (20)
12 8to10
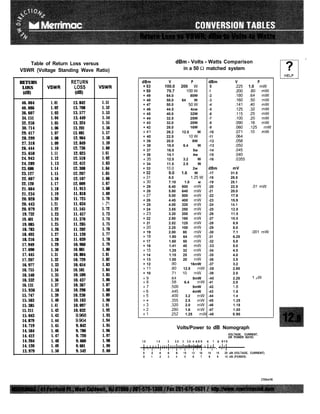
- 1. Table of Return Loss versus dBm - Volts - Watts Comparison VSWR (Voltage Standing Wave Ratio) in a 50 R matched system RETURN RETURN dBm V P dBm V P LOSS VSWR LOSS + 53 100.0 200 w 0 .225 1.0 mW + 50 70.7 1oow -1 -200 .80 mW W) (dB) + 49 64.0 80W -2 ,180 .64 mW + 48 58.0 64 W -3 ,160 .50 mW 46.064 1.01 13.842 1.51 + 47 50.0 5ow -4 .141 .40 mW 40.086 1.02 13.708 1.52 + 46 44.5 4ow -5 ,125 .32 mW 36.607 1.03 13.577 1.53 + 45 40.0 32W -6 ,115 .25 mW 34.151 1.04 13.449 1.54 + 44 32.5 25W -7 ,100 .20 mW 32.256 1.05 13.324 1.55 + 43 32.0 20W -8 ,090 .16 mW 30.714 1.06 13.201 1.56 + 42 28.0 16W -9 ,080 .125 mW 29.417 1.07 13.081 1.57 +41 26.2 12.5 W -10 .071 .lO mW 28.299 1.08 12.964 1.58 + 40 22.5 low -11 ,064 + 39 20.0 8W -12 ,058 27.318 1.09 12.849 1.59 + 38 18.0 6.4 W -13 ,050 26.444 1.10 12.736 1.60 + 37 16.0 5w -14 ,045 25.658 1.11 12.625 1.61 + 36 14.1 4w -15 ,040 24.943 1.12 12.518 1.62 +35 12.5 3.2 W -16 .0355 24.289 1.13 12.412 1.63 + 34 11.5 2.5 W 23.686 1.14 12.308 1.64 + 33 10.0 2w dBm mV 23.127 1.15 12.207 1.65 + 32 9.0 1.6 W -17 31.5 22.607 1.16 12.107 1.66 +31 8.0 l.25W -18 28.5 22.120 1.17 12.009 1.67 +30 7.10 1.0 w -19 25.1 + 29 6.40 800 mW -20 22.5 .Ol mW 21.664 1.18 11.913 1.68 + 28 5.80 640 mW -21 20.0 21.234 1.19 11.818 1.69 +27 5.00 500 mW -22 17.9 20.828 1.20 11.725 1.70 + 26 4.45 400 mW -23 15.9 20.443 1.21 11.634 .i .71 + 25 4.00 320 mW -24 14.1 20.079 1.22 11.545 1.72 + 24 3.55 250 mW -25 12.8 19.732 1.23 11.457 1.73 +23 3.20 200 mW -26 11.5 19.401 1.24 11.370 1.74 + 22 2.80 160 mW -27 10.0 19.085 1.25 11.285 1.75 + 21 2.52 125 mW -28 8.9 18.783 1.26 11.202 1.76 +20 2.25 100 mW -29 8.0 + 19 2.00 80 mW -30 7.1 .OOl mW 18.493 1.27 11.120 1.77 +18 1.80 64 rqW -31 6.25 18.216 1.28 11.039 1.78 + 17 1.60 50 mW -32 5.8 17.949 1.29 10.960 1.79 + 16 1.41 40 mW -33 5.0 17.690 1.30 10.881 1.80 +15 1.25 32 mW -34 4.5 17.445 1.31 10.804 1.81 + 14 1.15 25 mW -35 4.0 17.207 1.32 10.729 1.82 + 13 1.00 20 mW -36 3.5 16.977 1.33 10.654 1.83 + 12 .90 16mW -37 3.2 16.755 1.34 10.581 1.84 +I1 .80 12.5 mW -38 2.85 16.540 1.35 10.509 1.85 + 10 .71 IO mW -39 2.5 16.332 1.36 10.437 1.86 +9 +8 .64 .58 6.4 8mW mW -40 -41 2.25 2.0 1 PW 16.131 1.37 10.367 1.87 +7 ,500 5mW -42 1.8 15.936 1.38 10.298 1.88 +6 ,445 4mW -43 1.6 15.747 1.39 10.230 1.89 +5 ,400 3.2 mW -44 1.4 15.563 1.40 10.163 1.90 +4 ,355 2.5 mW -45 1.25 15.385 1.41 10.097 1.91 +3 ,320 2.0 mW -46 1.18 15.211 1.42 10.032 1.92 +2 ,280 1.6 mW -47 1.00 15.043 1.43 1.93 +l ,252 1.25 mW -48 0.90 14.879 1.44 i:E 1.94 14.719 1.45 9.842 1.95 Volts/Power to dB Nomograph 14.564 1.46 9.780 1.96 14.412 1.47 9.720 1.97 VOLTAGE, CURRENT, OR POWER RATIO 14.264 1.48 9.660 1.98 1.0 1.5 2 2.5 3 3.5 4 4.5 5 6 7 8 910 14.120 1.49 9.601 1.99 I1111 Illt 13.979 1.50 9.542 2.00 0 2 4 6 8 10 12 I 14 “I” “‘I 16 18 20 dB (VOLTAGE, CURRENT) 0 12 3 4 5 6 7 8 9 10 dB (POWER) 25Mar96
- 2. POWER TRANS. VOLTAGE POWER RETURN TRANS. MISSION VSWR REFL. COEFF. REFLECTED LOSS MITTED LOSS % dB % dB p45 IOO- o- 1.02=‘~0’ .010=005 40’ --I.03 .015-- .OOl-- .020- - 35 1.04-- .002- - 1.05+- .025- - il .003- - 1.069- .030- - 31 99.9- - .004=- .l-- 30 1.07-- .005- - .035- - 29 .006- - 1.06-- .040- - 28 .007= - .008- - 1.09-- .045- - .2-- 27 99*8,- .009. - l.lO-- .OlO=- .050- - 26 l.ll-- .3-- 99.7- - .055- - 25 1.12-- .015m- .060-- 1.13-- .4-- 24 99.6. - I.141- .065- - .020- - 1.15-- .070- - .5-- 231 99.5- - 1.16-- .075-w .025.- .6-- 99.4.- I.179- . .06Om - 1.16-- .7-- 99.3.- .030.- .085-- 1.19-- .8- - 99.2- - .035& - 1.20-- 1.21-- .9-- 99.1- - .040- - 1.22-- l .o- 99.06
- 3. P O W E R TRANS- VOLTAGE POWER RETURN TRANS. M I S S I O N VSWR REFL. COEFF. REFLECTED LOSS MITTED LOSS % dB % dB 1.0 0. 100, 0 1.1 .05 1.1 1.2 G--- 19- .lO. 99n 18-- -05 1.3 17-- 2. 16r- 98, .15’ .lO 15r- 1.4 31 97, 14.5- - 14.0-- 1.5 .20 41 13.5-- 96 13.0-- .20 5. 12.5-- 95 1.6 12.0- - 6. 94 .25 8 11.5-- 1.7 .30 7. 93’ ll.O-- . 10.5-- 92 1.8 .40 .30, 9@ ’ lO.O-- 914 1.9 . 10 90 .