10.1002-aisy.202000139Figure2020001390002.pptx.ppt
•Download as PPT, PDF•
0 likes•1 view

Experiment
Recommended

Recommended
More Related Content
Recently uploaded
Recently uploaded (20)
Featured
Featured (20)
10.1002-aisy.202000139Figure2020001390002.pptx.ppt
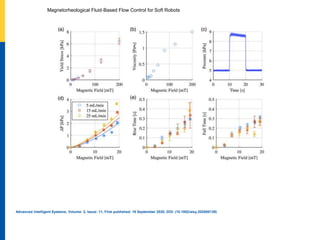
- 1. Magnetorheological Fluid‐Based Flow Control for Soft Robots Advanced Intelligent Systems, Volume: 2, Issue: 11, First published: 18 September 2020, DOI: (10.1002/aisy.202000139)
Editor's Notes
- a) Yield stress results from rheology using Bingham plastic fit. b) Bingham viscosity results from rheology. c) Plot of pressure versus time at a flow rate of 25 mL min−1 and an applied magnetic field of 20 mT activated at t=10 s and deactivated at t=20 s. The shaded region denotes the standard deviation across three trials. d) Plot of the change in pressure versus magnetic field compiled from testing across three flow rates and seven applied magnetic fields. Each mark is the average of three trials, where the change in pressure is defined as the difference between the average pressure measured in the magnet‐on and magnet‐off states. Error bars represent the standard deviation. The solid lines are the theoretical values predicted using Equation (3) for each of the flow rates. e) Plots of the rise time (left) and fall time (right) versus magnetic field compiled from testing across three flow rates and seven applied magnetic fields. The rise time was calculated as the duration between the moment the magnet turned on and the moment the pressure achieved its average value in the magnet‐on state. The fall time was calculated as the duration between the moment the magnet turned off and the moment the pressure achieved its average value in the magnet‐off state. Each mark is the average of three trials. Error bars represent the standard deviation. IF THIS IMAGE HAS BEEN PROVIDED BY OR IS OWNED BY A THIRD PARTY, AS INDICATED IN THE CAPTION LINE, THEN FURTHER PERMISSION MAY BE NEEDED BEFORE ANY FURTHER USE. PLEASE CONTACT WILEY'S PERMISSIONS DEPARTMENT ON PERMISSIONS@WILEY.COM OR USE THE RIGHTSLINK SERVICE BY CLICKING ON THE 'REQUEST PERMISSIONS' LINK ACCOMPANYING THIS ARTICLE. WILEY OR AUTHOR OWNED IMAGES MAY BE USED FOR NON-COMMERCIAL PURPOSES, SUBJECT TO PROPER CITATION OF THE ARTICLE, AUTHOR, AND PUBLISHER.