Night 7k to 12k Navi Mumbai Call Girl Photo 👉 BOOK NOW 9833363713 👈 ♀️ night ...
1 hypoxic ischemic brain damage
1. 1
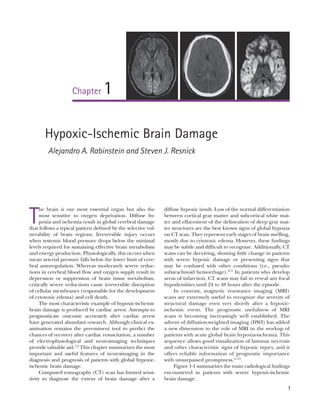
T
he brain is our most essential organ but also the
most sensitive to oxygen deprivation. Diffuse hy-
poxia and ischemia result in global cerebral damage
that follows a typical pattern defined by the selective vul-
nerability of brain regions. Irreversible injury occurs
when systemic blood pressure drops below the minimal
levels required for sustaining effective brain metabolism
and energy production. Physiologically, this occurs when
mean arterial pressure falls below the lower limit of cere-
bral autoregulation. Whereas moderately severe reduc-
tions in cerebral blood flow and oxygen supply result in
depression or suppression of brain tissue metabolism,
critically severe reductions cause irreversible disruption
of cellular membranes (responsible for the development
of cytotoxic edema) and cell death.
The most characteristic example of hypoxic-ischemic
brain damage is produced by cardiac arrest. Attempts to
prognosticate outcome accurately after cardiac arrest
have generated abundant research. Although clinical ex-
amination remains the preeminent tool to predict the
chances of recovery after cardiac resuscitation, a number
of electrophysiological and neuroimaging techniques
provide valuable aid.1,2
This chapter summarizes the most
important and useful features of neuroimaging in the
diagnosis and prognosis of patients with global hypoxic-
ischemic brain damage.
Computed tomography (CT) scan has limited sensi-
tivity to diagnose the extent of brain damage after a
diffuse hypoxic insult. Loss of the normal differentiation
between cortical gray matter and subcortical white mat-
ter and effacement of the delineation of deep gray mat-
ter structures are the best known signs of global hypoxia
on CT scan. They represent early stages of brain swelling,
mostly due to cytotoxic edema. However, these findings
may be subtle and difficult to recognize. Additionally, CT
scans can be deceiving, showing little change in patients
with severe hypoxic damage or presenting signs that
may be confused with other conditions (i.e., pseudo-
subarachnoid hemorrhage).3–5
In patients who develop
areas of infarction, CT scans may fail to reveal any focal
hypodensities until 24 to 48 hours after the episode.
In contrast, magnetic resonance imaging (MRI)
scans are extremely useful to recognize the severity of
structural damage even very shortly after a hypoxic-
ischemic event. The prognostic usefulness of MRI
scans is becoming increasingly well established. The
advent of diffusion-weighted imaging (DWI) has added
a new dimension to the role of MRI in the workup of
patients with acute global brain hypoxia-ischemia. This
sequence allows good visualization of laminar necrosis
and other characteristic signs of hypoxic injury, and it
offers reliable information of prognostic importance
with unsurpassed promptness.5–11
.
Figure 1-1 summarizes the main radiological findings
encountered in patients with severe hypoxic-ischemic
brain damage.
Chapter 1
Hypoxic-Ischemic Brain Damage
Alejandro A. Rabinstein and Steven J. Resnick
2. 2 Hypoxic-Ischemic Brain Damage
CT
DWI
T1
T1 with Contrast
FLAIR
Sequence
Basal ganglia Cerebral cortex
SUMMARY OF HYPOXIC-ISCHEMIC BRAIN DAMAGE
Figure 1-1. Imaging findings in patients with hypoxic-ischemic brain damage affecting the basal ganglia and cerebral cortex.
First row: Axial computed tomography (CT) of the basal ganglia showing symmetrical hypodensity in the caudate nuclei (left).
Axial CT scans of the brain without contrast revealing linear hyperdensity outlining the cortex (right). Second row: Axial
diffusion-weighted imagery (DWI) magnetic resonance imaging (MRI) scan demonstrates bilateral symmetrical hyperintensity
within the stratiocapsular regions (left). Axial DWI MRIs show diffuse hyperintense signal change in the cerebral cortex indicat-
ing laminar necrosis (right). Third row: Axial T1-weighted MRI shows bilateral symmetrical hyperintense signals within the puta-
men bilaterally (left). Axial T1-weighted MRIs show bilateral areas of cortical hyperintensity representing laminar necrosis (right).
Fourth row: Axial T1-weighted MRI with contrast discloses bilateral symmetrical enhancement in the external putamen bilater-
ally (left). Axial and sagittal T1-weighted MRI with contrast show linear enhancement outlining the cortex, predominantly located
in the occipital lobes (right). Fifth row: Axial fluid-attenuated inversion recovery (FLAIR) MRI denoting bilateral symmetrical hy-
perintense signals in the lenticular nuclei (left). Examples of axial FLAIR MRI showing diffuse and focal cortical hyperintensities
distributed throughout the cerebral cortex or preferentially in the medial occipital cortex (right).
3. Hypoxic-Ischemic Brain Damage 3
Case Vignette
A 29-year-old, previously healthy man collapsed after a
lightning strike. A bystander at the scene noted absence of
pulse and audible heartbeat and performed basic cardiopul-
monary resuscitation for nearly 15 minutes. On arrival, para-
medics confirmed the diagnosis of cardiac arrest and initi-
atedfulladvancedcardiaclifesupport.Electricaldefibrillation
resulted in return of spontaneous circulation. Initial neuro-
logical examination at the hospital revealed that the patient
was comatose but with intact brainstem reflexes. He had a
Glasgow coma scale sum score of 4 and exhibited frequent
myoclonic jerks (myoclonic status). He subsequently failed to
regain consciousness. Five days later, he was transferred to a
tertiary care center. That day, an electroencephalogram (EEG)
showed a very low-amplitude, slow (delta, occasional theta)
background. A brain CT scan disclosed severe diffuse edema
(Figure 1-2, upper row). A brain MRI performed 13 days after
the insult displayed signs of extensive laminar necrosis
(Figure 1-2, lower row). A second EEG was essentially un-
changed almost 1 month after the arrest. He remained in
vegetative state 2 months later.
Figure 1-2. Computed tomography (CT) scan of the brain showing effacement of
the perimesencephalic cisterns (thin arrows) and areas of parenchymal low attenuation
(thick arrows, upper left). Lower cut of the same CT scan reveals diffuse sulcal effacement
with decreased differentiation between gray and white matter (upper right). T1-weighted
magnetic resonance imaging scan showing high-intensity signals in the lenticular nuclei
(arrows, lower left). Fluid-attenuated inversion recovery sequence disclosing hyperintense
signal in the medial occipital cortices indicative of laminar necrosis (arrows, lower right).
4. 4 Hypoxic-Ischemic Brain Damage
❖ As illustrated by this case, after an anoxic-ischemic
event, CT may show signs of cerebral edema such as
effacement of sulci, loss of differentiation between
cortical gray matter and underlying white matter,
blurring of the insular ribbon, and loss of distinction
of the margins of the deep gray nuclei (particularly
the lenticular nucleus). Watershed infarctions may
be evident after the first 24 to 48 hours.
❖ In the most severe cases, CT scan may actually display
reversal of the gray/white matter densities with rela-
tively increased density of the thalami, brainstem,
and cerebellum (“reversal sign”).12
This is associated
with an ominous prognosis (Figure 1-3).
❖ Although CT scan may occasionally show early
changes,13
it is most often normal hours after the
insult and may remain unremarkable at later
stages, even in patients with extensive neurological
damage.5
❖ MRI is far more sensitive in the depiction of
hypoxic-ischemic damage. It allows prompt and
reliable identification of areas of laminar necrosis
unrecognizable by CT scan.5
❖ MRI findings, especially extensive cortical laminar
necrosis and presence of changes in the brainstem
and white matter, are associated with poor chances
of recovery.5,7,11
❖ Apart from cortical necrosis, MRI may exhibit
changes in the cerebellum and basal ganglia,
which may be present quite early. Cerebellar
changes are often inconspicuous. Conversely, we
have found an abnormal signal in the basal gan-
glia in the great majority of our patients, although
the time of its appearance may vary. White matter
abnormalities tend to manifest in the late sub-
acute and chronic phases (after 10 days from the
time of injury).6
ADDITIONAL EXAMPLES OF GLOBAL BRAIN EDEMA
Figure 1-3. Additional case illustrating the changes of severe of anoxic brain injury on computed
tomography (CT) scan. A 55-year-old man had a cardiac arrest after surgery. CT scan 12 hours after
the arrest shows effacement of the cortical sulci, loss of distinction of gray white matter junction, and
slit-like lateral ventricles suggestive of diffuse cerebral edema (left). Higher cut displays multiple areas
of decreased attenuation due to diffuse cerebral edema in a gyriform distribution over the hemispheric
convexities (right).
5. Hypoxic-Ischemic Brain Damage 5
Figure 1-4. Diffusion-weighted imaging sequence (left) and corresponding apparent diffusion co-
efficient maps (right) of a brain magnetic resonance image from a 51-year-old woman obtained
16 hours after resuscitation from prolonged cardiac arrest. Note restricted diffusion in the lenticular
nuclei and throughout the cortex of both cerebral hemispheres. The patient remained comatose and
expired 3 days later after withdrawal of life support.
Cortical Laminar Necrosis
❖ Cortical laminar necrosis occurs because of the se-
lective vulnerability of cortical layers 3, 4, and 5 to
anoxia and ischemia. In addition to neurons, glial
cells and blood are also damaged, resulting in a
pan-necrosis. The selective vulnerability of gray
matter may be due to higher metabolic demand
and denser concentration of receptors for excit-
atory amino acids that are released after the anoxic-
ischemic event, precipitating the mechanism of
excitotoxicity.
❖ Early cytotoxic edema in these injured cells is re-
sponsible for the bright signals seen on DWI and
the corresponding low apparent diffusion coeffi-
cient (ADC) values7,10,11
(Figures 1-4 and 1-5).
❖ The hyperintense signal observed on T1-weighted se-
quences is believed to be caused by the accumulation
of denatured proteins in dying cells and does not
represent presence of hemorrhage14,15
(Figure 1-6).
6. 6 Hypoxic-Ischemic Brain Damage
Figure 1-6. T1-weighted magnetic resonance imaging (MRI) scan showing patchy areas of cortical
hyperintensity representing laminar necrosis (thin arrows). Also notice hyperintense signal in the puta-
men (thick arrows). This MRI scan was performed nearly 3 weeks after a cardiac arrest,
Figure 1-5. Additional example
of restricted diffusion affecting ex-
tensively the cortex of both cere-
bral hemispheres in a 58-year-old
patient who underwent cardiopul-
monary resuscitation after out-of
hospital ventricular fibrillation. Im-
ages shown are diffusion-weighted
imaging sequence (left) and appar-
ent diffusion coefficient map (right)
from a brain magnetic resonance
image performed 46 hours after
the cardiac arrest.
7. Hypoxic-Ischemic Brain Damage 7
Figure 1-7. Two cases of anoxic
brain injury depicted on fluid-
attenuated inversion recovery
(FLAIR) sequences. Upper row:
FLAIR sequence of a brain mag-
netic resonance imaging (MRI)
scan of a patient with persistent
coma 6 days after being resusci-
tated from a cardiac arrest. It shows
diffusely increased signal intensity
in the insular, high frontal, parietal,
and occipital cortex. The cortex
also appears swollen in this rela-
tively early stage. Lower row: An-
other example of cortical changes
on FLAIR but in a later stage. This
MRI was obtained 12 days after
cardiac arrest. In addition to the
high-intensity signal changes in the
cortex, the lenticular nuclei also
appear hyperintense bilaterally.
❖ Laminar necrosis may be identified within hours of
the anoxic-ischemic event. In this acute phase (par-
ticularly the first 24 hours), DWI is far superior
to conventional MRI sequences in its ability to
distinguish cortical changes.6,7,11
ADC values are typi-
cally decreased to values ranging from 60% to 80%
of normal.11
Cortical diffusion abnormalities are
associated with poor outcome after cardiac arrest.16
❖ T1 hyperintensities signaling laminar necrosis be-
come evident after 2 weeks, peak at 1 to 3 months,
and then fade slowly but can still be visible as late
as 2 years after the insult.
❖ On fluid-attenuated inversion recovery (FLAIR), in-
jured cortical areas are more prominently hyperin-
tense between 1 month and 1 year after the event.14,15
However, we have observed cortical changes on FLAIR
within a few days of the anoxic insult (Figure 1-7).
❖ Affected cortex tends to appear isointense to slightly
hyperintense on T2-weighted sequence. In our ex-
perience, this sequence offers limited value for the
accurate diagnosis of laminar necrosis.
❖ Cortical enhancement is first seen after 2 weeks,
peaks after 1 to 2 months, and is usually resolved
after 6 months14,15
(Figure 1-8).
❖ Very severe cases of cortical necrosis can be visu-
alized on CT scan, either in the form of gyri-
form high attenuation (likely caused by local
hemorrhage) (Figure 1-9) or areas of cortical
hypoattenuation (Figure 1-10).
8. 8 Hypoxic-Ischemic Brain Damage
Figure 1-8. Magnetic resonance imaging scan of the brain with gadolinium performed for prognostic
purposes 1 month after cardiac arrest in a 45-year-old woman with limited recovery. She was fully inca-
pacitated and was suspected to be cortically blind. Notice diffuse cortical enhancement predominantly
involving the occipital and perirolandic cortical areas.The figure shows enhanced T1-weighted sequences
with axial cuts (upper row), sagittal cut (lower left), and coronal cut (lower right).
9. Hypoxic-Ischemic Brain Damage 9
Figure 1-9. This figure illustrates
the changes caused by cortical
laminar necrosis on computed to-
mography scan. Cortical edema
(low attenuation) can be combined
with small areas of hyperdensity
(likely caused by hemorrhage
or vascular congestion). These
changes can be rather subtle as
seen in the upper left (with magni-
fied view on the upper right) or, less
commonly, more manifest as shown
in the lower row (arrowheads).
Figure 1-10. Computed tomog-
raphy scan of the brain shows mul-
tifocal areas of severe cortical
edema 3 days after cardiac arrest
in a patient with persistent coma
and myoclonic status. Basal gan-
glia also exhibit low attenuation.
10. 10 Hypoxic-Ischemic Brain Damage
Figure 1-11. Magnetic resonance imaging (MRI) scans showing evidence of basal ganglia in-
volvement after anoxic insults. Upper row: Diffusion-weighted imagery sequence revealing restricted
diffusion on bilateral putamen and caudate nuclei (left) and in the caudate nuclei and cortical areas
(right). Lower row: T1-weighted sequence showing high-intensity signal in the putamen bilaterally
(axial view on the left and coronal on the right). Note associated medial occipital changes on the
axial cut.
Basal Ganglia Involvement
❖ Changes in the deep gray nuclei are seen in most
cases of anoxic-ischemic brain damage.
❖ Bilateral thalami, lenticular nuclei, and caudate
nuclei may be involved. As exhibited by the illus-
trations, the distribution of lesions is not uniform
across patients and may change over time in each
patient (Figures 1-11 and 1-12).
❖ Lesions may be seen in association with cortical
laminar changes or in isolation.
❖ Although signal changes are often present early, the
time of appearance varies. The factors determining
the timing and extent of these lesions remain to be
established.
❖ Basal ganglia injury may be the anatomical
substrate that accounts for the various adventi-
tious movements frequently seen in survivors of
cardiac arrest and other severe hypoxic-ischemic
events.
11. Hypoxic-Ischemic Brain Damage 11
Figure 1-12. Magnetic resonance imaging (MRI)
scans showing evidence of basal ganglia involvement
after cardiac arrest. Upper row: T2-weighted sequence
displaying increased signal in lenticular nuclei, caudate
nuclei, and throughout the cortical layer. Lower two
rows: Various examples of anoxic changes affecting
the basal ganglia on FLAIR. Notice that these changes
may occur only in the deep structures (middle row) or
may also involve cortical areas (lower row). The distri-
bution of lesions in the basal ganglia may vary. See
predominant putaminal involvement in the middle and
lower images of the left column, combined caudate and
lenticular involvement on the middle right, and pre-
dominant thalamic lesions in the lower right.
12. 12 Hypoxic-Ischemic Brain Damage
Watershed Infarctions
❖ Watershed infarctions caused by a diffuse anoxic-
ischemic insult appear to be more common in neo-
nates and children.
❖ In adults, we have observed these lesions more often
in patients who survive the event. In addition, water-
shed infarcts are not typically seen in conjunction
with extensive laminar necrosis (Figure 1-13).
❖ It is tempting to hypothesize that watershed in-
farcts occur in cases of severe hypoperfusion with-
out anoxia (as happens when they are caused by
carotid occlusion or critical stenosis with systemic
hypotension), whereas laminar necrosis results
from anoxic injury.
Figure 1-13. Images demonstrate watershed infarctions after cardiac arrest. Upper row: Diffusion-
weighted imaging sequence showing restricted diffusion in internal and external watershed distributions
4 days after cardiac arrest in a pediatric patient. Lower row: Early changes already observed in the fluid-
attenuated inversion recovery sequence. Notice that the changes extend beyond typical watershed terri-
tory to affect larger areas of the frontal cortex on the right hemisphere.
13. Hypoxic-Ischemic Brain Damage 13
Figure 1-14. This figure illustrates predominant anoxic changes in the perirolandic regions after car-
diac arrest. Upper row: Restricted diffusion on diffusion-weighted imaging (left) and corresponding dark
signal on the apparent diffusion coefficient map (right) in a 56-year-old man who sustained prolonged
ventricular fibrillation-arrest 5 days before. Lower row: FLAIR sequence shows high-intensity signal
outlining the perirolandic cortex (normal view on the left and magnified view on the right).
Vulnerable Cortical Areas: Perirolandic
and Occipital Cortex
❖ The perirolandic (Figure 1-14) and occipital cortex
(Figure 1-15) are often involved to a greater extent
than other cortical areas. In our experience, the
medial occipital cortex is the area most commonly
affected after anoxic-ischemic brain injury.
❖ The intense baseline metabolic demand of these
regions may explain their selective vulnerability.
❖ Although it is commonly held that the hippocampi
in the mesial temporal lobes are the cortical areas
most susceptible to anoxia, radiological evidence of
damage to these structures is seen much less com-
monly after cardiac arrest than are lesions in the
medial occipital lobes and perirolandic regions.
However, it has been suggested that the damage to
the hippocampus (along with the corpus callosum
and white matter) may occur as a delayed manifes-
tation of brain anoxia.17
❖ Presence of diffusion abnormalities or T1 hyperin-
tensity in these cortical areas in a patient with coma
of unclear cause should be considered strongly sup-
portive of the diagnosis of hypoxic-ischemic brain
damage.
❖ Cerebellar lesions may be prominent in certain se-
vere cases, and cerebellar ischemia is probably an
extremely poor prognostic indicator (Figure 1-16).
14. 14 Hypoxic-Ischemic Brain Damage
Figure 1-15. Figure demonstrating pre-
dominant involvement of changes indicative
of laminar necrosis in the occipital cortex
(arrows). Diffusion-weighted imaging se-
quence is shown in the upper left and
FLAIR sequence in the rest of the images.
Notice selective involvement of medial oc-
cipital cortex and relative sparing of mesial
temporal structures.
Figure 1-16. Evidence of cerebellar lesions after brain anoxia is seen in this magnetic resonance
image of an 84-year-old woman who had prolonged respiratory arrest. Diffusion-weighted image show-
ing extensive areas of restricted diffusion in both cerebellar hemispheres (left). T2-weighted sequence
also shows high signal intensity in these regions (right).
15. Hypoxic-Ischemic Brain Damage 15
Figure 1-17. False radiological
signs in computed tomography
scans after severe brain anoxia:
pseudo-subarachnoid hemorrh-
age and false hyperdense middle
cerebral artery sign. Pseudo-
subarachnoid hemorrhage thick
arrows in the tentorium and sulci
in the upper left panel and in the
perimesencephalic cisterns in the
upper right panel. Thin arrows
mark examples of false hyper-
dense middle cerebral artery
signs. Notice extensive brain
swelling in all cases.
False Radiological Signs: Pseudo-Subarachnoid
Hemorrhage and False Middle Cerebral Artery Sign
❖ False appearance of subarachnoid hemorrhage
(SAH), or pseudo-SAH, may be seen in cases of ad-
vanced diffuse cerebral edema,3
including that caused
by anoxia-ischemia4
(Figure 1-17, upper row).
❖ The most plausible explanation for the occurrence
of this phenomenon is a combination of displace-
ment of hypoattenuated cerebrospinal fluid, en-
gorgement of pial compliance vessels, and edema
in the adjacent cortex.3
❖ As displayed in our cases, increased attenuation
within the falx, tentorium, and, most remarkably,
the basal cisterns is responsible for the possible
misdiagnosis of SAH. This appearance may be par-
ticularly deceptive in patients with coma of unclear
etiology; in these patients, it may result in unneces-
sary testing.
❖ The pitfall of mistakenly diagnosing SAH in patients
with global edema may be avoided by being aware of
this possibility. When in doubt, it is useful to pay spe-
cial attention to the attenuation values in the basal
cisterns, because they are much lower in these false
cases than those observed in true cases of SAH.3
❖ As clearly shown by the images in Figure 1-17, pa-
tients with severe brain edema may also exhibit the
false appearance of unilateral or, most often, bilat-
eral middle cerebral artery (MCA) signs, which
would suggest bilateral stroke rather than diffuse
anoxia-ischemia. Close attention to the presence of
signs of diffuse swelling beyond the boundaries of
restricted arterial vascular territories helps avoid
this misdiagnosis.
16. 16 Hypoxic-Ischemic Brain Damage
Early and Delayed White Matter Changes:
Anoxic Leukoencephalopathy
❖ White matter lesions typically become visible in the
late subacute or chronic phase of evolution of anoxic-
ischemic brain damage and worsen over time.6,18
(Figure 1-18).
❖ It has been suggested that this delayed leukoen-
cephalopathy may be more common after prolonged
hypoxemia combined with hypotension and acido-
sis,19
yet surprisingly little research addressing this
form of leukoencephalopathy has been reported in
the literature.
❖ Early white matter changes have been observed in
some patients.20
The actual prevalence of this finding
is unclear, but from our experience, it is probably
quite low.
Figure 1-18. Seventy-year-old man with poor recovery 2 weeks after prolonged cardiorespiratory
arrest complicated with renal failure and associated with severe acidosis. Mild initial improvement in
alertness was followed by irreversible decline. Upper row: Axial diffusion-weighted imaging sequence
shows patchy areas of bright signal within the white matter suggestive of anoxic leukoencephalopathy.
These bright spots matched with low apparent diffusion coefficient (ADC) on the ADC map (not shown).
Lower row: Axial FLAIR shows extensive white matter changes in the same patient.
17. Hypoxic-Ischemic Brain Damage 17
References
1. Levy DE, Caronna JJ, Singer BH, Lapinski RH, Frydman
H, Plum F. Predicting outcome from hypoxic-ischemic
coma. JAMA 1985; 253:1420–1426.
2. Maramattom BV, Wijdicks EF. Postresuscitation encepha-
lopathy. Current views, management, and prognostication.
Neurologist 2005; 11:234–243.
3. Given CA, Burdette JH, Elster AD, Williams DW III.
Pseudo-subarachnoid hemorrhage: a potential imaging
pitfall associated with diffuse cerebral edema. AJNR Am J
Neuroradiol 2003; 24:254–256.
4. Phan TG, Wijdicks EF, Worrell GA, Fulgham JR. False
subarachnoid hemorrhage in anoxic encephalopathy
with brain swelling. J Neuroimaging 2000; 10:236–238.
5. Wijdicks EF, Campeau NG, Miller GM. MR imaging in
comatose survivors of cardiac resuscitation. AJNR Am J
Neuroradiol 2001; 22:1561–1565.
6. Arbelaez A, Castillo M, Mukherji SK. Diffusion-weighted
MR imaging of global cerebral anoxia. AJNR Am J Neuro-
radiol 1999; 20:999–1007.
7. Els T, Kassubek J, Kubalek R, Klisch J. Diffusion-weighted
MRI during early global cerebral hypoxia: a predictor for
clinical outcome? Acta Neurol Scand 2004; 110:361–367.
8. Goto Y, Wataya T, Arakawa Y, Hojo M, Chin M, Yamagata S
et al. [Magnetic resonance imaging findings of postresusci-
tation encephalopathy: sequential change and correlation
with clinical outcome]. No To Shinkei 2001; 53:535–540.
9. Komiyama M, Nishikawa M, Yasui T. Cortical laminar
necrosis in brain infarcts: chronological changes on
MRI. Neuroradiology 1997. 39:474–479.
10. McKinney AM, Teksam M, Felice R, Casey SO, Cranford
R, Truwit CL, et al. Diffusion-weighted imaging in the
setting of diffuse cortical laminar necrosis and hypoxic-
ischemic encephalopathy. AJNR Am J Neuroradiol 2004;
25:1659–1665.
11. Lovblad KO, Wetzel SG, Somon T, Wilhelm K, Mehdizade
A, Kelekis A, et al. Diffusion-weighted MRI in cortical
ischaemia. Neuroradiology 2004; 46:175–182.
12. Han BK, Towbin RB, De Courten-Myers G, McLaurin RL,
Ball WS Jr. Reversal sign on CT: effect of anoxic/ischemic
cerebral injury in children. AJNR Am J Neuroradiol 1989;
10:1191–1198.
13. Tippin J, Adams HP Jr, Smoker WR. Early computed to-
mographic abnormalities following profound cerebral
hypoxia. Arch Neurol 1984; 41:1098–1100.
14. Komiyama M, Nakajima H, Nishikawa M, Yasui T. Serial
MR observation of cortical laminar necrosis caused by
brain infarction. Neuroradiology 1998; 40:771–777.
15. Siskas N, Lefkopoulos A, Ioannidis I, Charitandi A,
Dimitriadis AS. Cortical laminar necrosis in brain infarcts:
serial MRI. Neuroradiology 2003; 45:283–288.
16. Barrett KM, Freeman WD, Weindling SM, Brott TG,
Broderick DF, Heckman MG, et al. Brain injury after car-
diopulmonary arrest and its assessment with diffusion-
weighted magnetic resonance imaging. Mayo Clin Proc
2007; 82:828–835.
17. Konaka K, Miyashita K, Naritomi H. Changes in diffusion-
weighted magnetic resonance imaging findings in the
acute and subacute phases of anoxic encephalopathy.
J Stroke Cerebrovasc Dis 2007; 16:82–83.
18. Takahashi S, Higano S, Ishii K, Matsumoto K, Sakamoto
K, Iwasaki Y, et al. Hypoxic brain damage: cortical laminar
necrosis and delayed changes in white matter at sequen-
tial MR imaging. Radiology 1993; 189:449–456.
19. Ginsberg MD, Hedley-Whyte ET, Richardson EP Jr. Hypoxic-
ischemic leukoencephalopathy in man. Arch Neurol 1976;
33:5–14.
20. Chalela JA, Wolf RL, Maldjian JA, Kasner SE. MRI identi-
fication of early white matter injury in anoxic-ischemic
encephalopathy. Neurology 2001; 56:481–485.