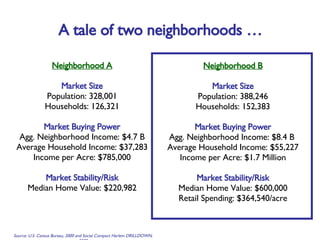
The document compares data between two neighborhoods, Neighborhood A and Neighborhood B. Neighborhood B has a larger population and more households. It also has greater buying power, with higher average and aggregate household incomes. Neighborhood B also shows greater market stability, with higher median home values and retail spending per acre.
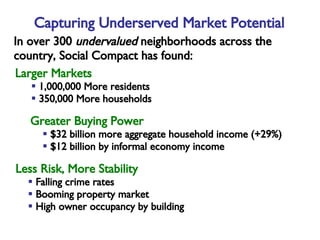
The document then discusses Social Compact's analysis of over 300 undervalued neighborhoods across the country. It found these neighborhoods had larger populations, more households, and greater aggregate buying power compared to previous data. The neighborhoods also showed less risk and more stability.
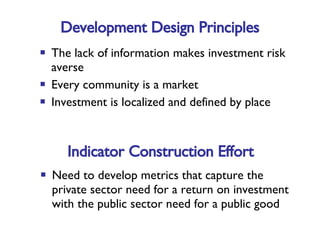
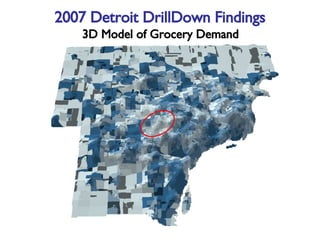
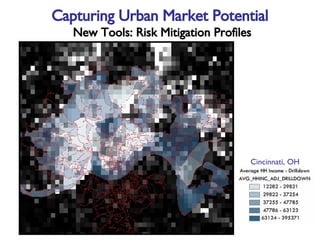
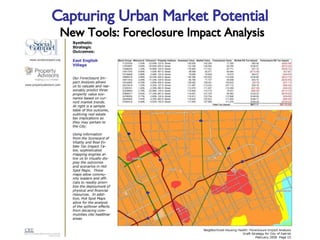
Social Compact has developed tools to capture underserved market potential using data analysis. These tools include analyses of grocery demand, foreclosure

![W W W . S O C I A L C O M P A C T . O R G John Talmage, President and CEO Social Compact, Inc. [email_address] 738 7 th Street, SE Washington, DC 2003](https://image.slidesharecdn.com/061608-sc-kansas-city-presentation-1213711237896689-8/85/06-16-08-Sc-Kansas-City-Presentation-16-320.jpg)


