SlideShare a Scribd company logo
1 of 21
Download to read offline
Business Research Methods, Unit: 5
1
PREPARED BY: Dr. Shriram S. Dawkhar, SIBAR, Pune. (For Student Distribution-MBA)
A)Frequency Distribution:
A frequency distribution is a tabular summary of data showing the frequency (or number) of items
in each of several nonoverlapping classes.
The objective is to provide insights about the data that cannot be quickly obtained by looking only
at the original data.
Example: Sun & Sand Hotel Customer rating
Guests staying at Sun & Sand were asked to rate the quality of their accommodations as being excellent,
above average, average, below average, or poor. The ratings provided by a sample of 20 guests are
shown below.
frequency Distribution/ Frequency Table as given below:
Rating Frequency
Poor 2
Below Average 3
Average 5
Above Average 9
Excellent 1
Total 20
*** The GM of Sun & Sand has a goal that no more than 10% of all guests will rate their stay as worse than
average. How is the S & S inn doing?
The relative frequency of a class is the fraction or proportion of the total number of data
items belonging to the class.
A relative frequency distribution is a tabular summary of a set of data showing the relative
frequency for each class.
The percent frequency of a class is the relative frequency multiplied by 100.
Business Research Methods, Unit: 5
2
PREPARED BY: Dr. Shriram S. Dawkhar, SIBAR, Pune. (For Student Distribution-MBA)
A percent frequency distribution is a tabular summary of a set of data showing the percent
frequency for each class.
Pie Chart:
• The pie chart is a commonly used graphical device for presenting relative frequency
distributions for qualitative data.
• First draw a circle; then use the relative frequencies to subdivide the circle into sectors that
correspond to the relative frequency for each class.
• Since there are 360 degrees in a circle, a class with a relative frequency of .25 would consume
.25(360) = 90 degrees of the circle.
• Or simply 25X3.6= 90 or 10X3.6 = 36
• ( Angel = X/total *360 please check solved example in the class )
Business Research Methods, Unit: 5
3
PREPARED BY: Dr. Shriram S. Dawkhar, SIBAR, Pune. (For Student Distribution-MBA)
Business Research Methods, Unit: 5
4
PREPARED BY: Dr. Shriram S. Dawkhar, SIBAR, Pune. (For Student Distribution-MBA)
Types of statistical measures
Measures of central tendency
Mean / average / arithmetic mean
Median
Mode
Measures of dispersion
Range
Quartile deviation or semi-quartile range
Mean absolute deviation
Standard deviation
Problem: Mean, Mode & Median:
1) Given below 31 students height data, Calculate mean, mode, median and Range.
Business Research Methods, Unit: 5
5
PREPARED BY: Dr. Shriram S. Dawkhar, SIBAR, Pune. (For Student Distribution-MBA)
Problem :2) Apartment Rents:
1) Mean:
The mean of a data set is the average of all the data values.
If the data are from a sample, the mean is denoted by
x
x
n
i=

If the data are from a population, the mean is denoted by
 (mu).
2) Median
The median of a data set is the value in the middle when the data items are arranged in ascending order.
If there is an odd number of items, the median is the value of the middle item.
If there is an even number of items, the median is the average of the values for the middle two items.
Business Research Methods, Unit: 5
6
PREPARED BY: Dr. Shriram S. Dawkhar, SIBAR, Pune. (For Student Distribution-MBA)
3) Mode:
The mode of a data set is the value that occurs with greatest frequency.
Business Research Methods, Unit: 5
7
PREPARED BY: Dr. Shriram S. Dawkhar, SIBAR, Pune. (For Student Distribution-MBA)
4) Range:
The range of a data set is the difference between the largest and smallest data
values.
It is the simplest measure of variability.
It is very sensitive to the smallest and largest data values.
5) The coefficient of variation (CV) is a measure of relative variability. It is the ratio of the
standard deviation to the mean (average).
Coefficient of Variation = (Standard Deviation / Mean) * 100.
6. Standard Deviation
The standard deviation of a data set is the positive square root of the variance.
It is measured in the same units as the data, making it more easily comparable, than the variance, to the
mean.
If the data set is a sample, the standard deviation is denoted s.
If the data set is a population, the standard deviation is denoted s (sigma
Business Research Methods, Unit: 5
8
PREPARED BY: Dr. Shriram S. Dawkhar, SIBAR, Pune. (For Student Distribution-MBA)
Non-Grouped Data
Non-grouped data is just a list of values. The standard deviation is given by the formula:
s means 'standard deviation'.
Business Research Methods, Unit: 5
9
PREPARED BY: Dr. Shriram S. Dawkhar, SIBAR, Pune. (For Student Distribution-MBA)
Criteria for Hypothesis testing: Very important
Hypothesis Testing (Old question paper problems)
Rules for Decision Making: (2 approaches)
A)1st
Approach: If Calculated (Observed) value & or
Critical (table) value is used.
Rules for Decision Making:
1)If Calculated Value (observed) < Critical (table) Value
……………….Then Accept Null hypothesis.
2)If Calculated Value (observed) > Critical (table) Value
………………. Then Reject the null hypothesis.
B) 2nd
Approach: Rules if Probability Value (p-value) Approach is
used:
Reject null hypothesis if the probability value (p-value) is less than significance level.
If… p-value < Significance level ……..Reject the null hypothesis
If…p-value > Significance level ……..Accept the null hypothesis
Business Research Methods, Unit: 5
10
PREPARED BY: Dr. Shriram S. Dawkhar, SIBAR, Pune. (For Student Distribution-MBA)
Solution:
Null Hypothesis (H0): Magazine choice is independent of level of income.
Alternate Hypothesis (Ha or H1) = Magazine choice is dependent of level of income.
Now in above example,
Calculated Value (observed) < Critical Value
i.e. 3.956 < 5.99
Hence Null hypothesis is accepted. Hence we can say that Magazine choice is
independent of level of income.
Rules for Decision Making:
1)If Calculated Value (observed) < Critical (table) Value
……………….Then Accept Null hypothesis.
2)If Calculated Value (observed) > Critical (table) Value
………………. Then Reject the null hypothesis.
Business Research Methods, Unit: 5
11
PREPARED BY: Dr. Shriram S. Dawkhar, SIBAR, Pune. (For Student Distribution-MBA)
Solution:
Null hypothesis: The mean salary of the students is 45000
Alternate hypothesis: The mean salary of the students is not 45000
Rules for Decision Making:
1) If Calculated Value (observed) < Critical (table) Value
……………….Then Accept Null hypothesis.
2) If Calculated Value (observed) > Critical (table) Value
………………. Then Reject the null hypothesis.
Now in above example,
Calculated Value (observed) < Critical (table) Value
i.e. 0.83 < 2.131
Hence Null hypothesis is accepted. Thus, we can say that the mean salary of the
students is 45000.
Business Research Methods, Unit: 5
12
PREPARED BY: Dr. Shriram S. Dawkhar, SIBAR, Pune. (For Student Distribution-MBA)
Solution:
Null Hypothesis: The die was fair.
Alternate hypothesis: The die was not fair.
Level of Significance 5% i.e. .5 (given)
Degrees of freedom = n-1 = 6-1 = 5………………total 6 possible observations/outcomes. i.e. faces: 1,2,3,4,5,6
Rules for Decision Making:
1) If Calculated Value (observed) < Critical (table) Value
……………….Then Accept Null hypothesis.
2) If Calculated Value (observed) > Critical (table) Value
………………. Then Reject the null hypothesis.
Now in above example,
Calculated Value (observed) > Critical (table) Value
i.e. 11.40 > 11.07
Hence Null hypothesis is rejected. Hence alternate hypothesis can be accepted. Thus we
can say that the die was not fair.
Business Research Methods, Unit: 5
13
PREPARED BY: Dr. Shriram S. Dawkhar, SIBAR, Pune. (For Student Distribution-MBA)
Solution:
Null Hypothesis: The mean height of the students is 171.17.
Alternate hypothesis: The mean height of the students is not 171.17.
Rules for Decision Making:
1) If Calculated Value (observed) < Critical (table) Value
……………….Then Accept Null hypothesis.
2) If Calculated Value (observed) > Critical (table) Value
………………. Then Reject the null hypothesis.
Now in above example,
Calculated Value (observed) < Critical (table) Value
i.e. 1.27 < 1.96
Hence Null hypothesis is accepted. Hence we can say that the mean height of the students is
171.17.
Business Research Methods, Unit: 5
14
PREPARED BY: Dr. Shriram S. Dawkhar, SIBAR, Pune. (For Student Distribution-MBA)
Type I (Alpha: α) & Type II (Beta: β) error in hypothesis testing:
• Type I errors happen when we reject a true null hypothesis
• Type II errors happen when we fail to reject a false null hypothesis.
• Type I Error: The first kind of error that is possible involves the rejection of a null hypothesis that
is actually true. This kind of error is called a type I error and is sometimes called an error of the first
kind.
• Type II Error: The other kind of error that is possible occurs when we do not reject a null
hypothesis that is false. This sort of error is called a type II error and is also referred to as an error of
the second kind.
Example:
• Type I error - Concluding that the new drug is better than the standard (HA) when in fact it is no
better (H0). Ineffective drug is deemed better.
• Type II error - Failing to conclude that the new drug is better (HA) when in fact it is. Effective drug is
deemed to be no better.
Business Research Methods, Unit: 5
15
PREPARED BY: Dr. Shriram S. Dawkhar, SIBAR, Pune. (For Student Distribution-MBA)
Correlation
◼ Correlation: The degree of relationship between the variables under consideration is
measure through the correlation analysis.
◼ The measure of correlation called the correlation coefficient.
◼ The degree of relationship is expressed by coefficient which range from correlation ( -1 ≤ r ≥ +1)
◼ The direction of change is indicated by a sign.
◼ The correlation analysis enable us to have an idea about the degree & direction of the relationship
between the two variables under study.
◼ Correlation is a statistical tool that helps to measure and analyze the degree of relationship between
two variables.
◼ Correlation analysis deals with the association between two or more variables.
1) Positive and Negative Correlation:
◼ Positive Correlation: The correlation is said to be positive correlation if the values of two variables
changing with same direction.
Ex. Pub./Ad. Exp. & sales, Height & weight.
◼ Negative Correlation: The correlation is said to be negative correlation when the values of variables
change with opposite direction.
Ex. Price & qty. demanded.
2) Simple and Multiple Correlation
◼ Simple correlation: Under simple correlation problem there are only two variables are studied.
Types of
Coorelation
1) Positive and Negative
Correlation
3) Linear and Non-
linear Correlation
2) Simple and Multiple
Correlation
Business Research Methods, Unit: 5
16
PREPARED BY: Dr. Shriram S. Dawkhar, SIBAR, Pune. (For Student Distribution-MBA)
◼ Multiple Correlation: Under Multiple Correlation three or more than three variables are studied.
Ex. Qd = f ( P,PC, PS, t, y )
◼ Partial correlation: analysis recognizes more than two variables but considers only two variables
keeping the other constant.
◼ Total correlation: is based on all the relevant variables, which is normally not feasible.
3) Linear and Non-linear Correlation
◼ Linear correlation: Correlation is said to be linear when the amount of change in one variable tends
to bear a constant ratio to the amount of change in the other. The graph of the variables having a
linear relationship will form a straight line.
Ex X = 1, 2, 3, 4, 5, 6, 7, 8,
Y = 5, 7, 9, 11, 13, 15, 17, 19,
Y = 3 + 2x
◼ Non Linear correlation: The correlation would be non linear if the amount of change in one
variable does not bear a constant ratio to the amount of change in the other variable.
1) Scatter Diagram:
Scatter Diagram is a graph of observed plotted points where each points represents the
values of X & Y as a coordinate. It portrays the relationship between these two variables
graphically
2) Karl Pearson’s Coefficient of Correlation (r)
Methods of
Studying
Correlation
1) Scatter Diagram Method
3) Spearman’s Rank
Correlation Coefficient
2) Karl Pearson’s Coefficient
of Correlation (r)
Business Research Methods, Unit: 5
17
PREPARED BY: Dr. Shriram S. Dawkhar, SIBAR, Pune. (For Student Distribution-MBA)
Karl Pearson’s Coefficient of Correlation denoted by- ‘r’ The coefficient of correlation ‘r’
measure the degree of linear relationship between two variables say x & y
◼ Karl Pearson’s Coefficient of Correlation denoted by- r -1 ≤ r ≥ +1
◼ Degree of Correlation is expressed by a value of Coefficient
◼ Direction of change is Indicated by sign ( - ve) or ( + ve)
3) Spearman’s Rank Coefficient of Correlation ρ (rho):
When statistical series in which the variables under study are not capable of quantitative
measurement but can be arranged in serial order, in such situation pearson’s correlation
coefficient can not be used in such case Spearman Rank correlation can be used.
ρ (rho) = 1- (6 ∑D2 ) / N (N2 – 1)
Business Research Methods, Unit: 5
18
PREPARED BY: Dr. Shriram S. Dawkhar, SIBAR, Pune. (For Student Distribution-MBA)
Interpretation of Correlation:
Business Research Methods, Unit: 5
19
PREPARED BY: Dr. Shriram S. Dawkhar, SIBAR, Pune. (For Student Distribution-MBA)
Data analysis:
• Data analysis: involves entering data into computer files, inspecting data for errors
(data cleaning), running tabulations (frequencies), and conducting various statistical
tests
– Before analyzing data there are a few preliminary tasks to be completed. These
tasks include editing, coding, classification and tabulation.
i) Editing:
Business Research Methods, Unit: 5
20
PREPARED BY: Dr. Shriram S. Dawkhar, SIBAR, Pune. (For Student Distribution-MBA)
Editing is the procedure that improves the quality of the data for coding. Here
researcher look for inconsistencies, incompleteness of data and such data is
discarded for lack or utility for interpretation and analysis
• “ The process of checking the completeness, consistency & legibility of data ready for
coding & transfer to storage”
• “The process of checking and adjusting responses in the completed questionnaires for
omissions, legibility, and consistency and readying them for coding and storage.”
Purpose of editing
• Editing purpose is to guarantee that the data is :
• 1) Accurate
• 2) Consistent with intent of the question & other information in the survey.
• 3) Complete
• 4) arranged to simplify coding & tabulation
Types of Editing:
1. Field Editing
– Preliminary editing by a field supervisor on the same day as the interview to
catch technical omissions, check legibility of handwriting, and clarify responses
that are logically or conceptually inconsistent.
2. In-house Editing
– Editing performed by a central office staff; often dome more rigorously than
field editing
ii) Coding:
– Coding involves assigning suitable codes or symbols to categories of responses
so as to aid further human or computer analysis.
• The process of identifying and classifying each answer with a numerical score or other
character symbol
– The numerical score or symbol is called a code, and serves as a rule for
interpreting, classifying, and recording data
– Identifying responses with codes is necessary if data is to be processed by
computer
Business Research Methods, Unit: 5
21
PREPARED BY: Dr. Shriram S. Dawkhar, SIBAR, Pune. (For Student Distribution-MBA)
Example: Male =1, Female =2 & Transgender = 3
iii) Classification:
Next stage is classification where data having common
Characteristic are placed in one class.
– Classification according to attributes:
It can be.
• - Descriptive e.g. literacy, gender etc. or
• - Numerical e.g. weight, height, income etc.
• Classification according to class intervals
• – Data relating to income, production, age, weight etc. come under
this category.
iv) Tabulation:
Here classified data are put in the form of tables.
**** For details about correlation types, graphical presentations, dot plots & other details please check complete
PPT on above link:
https://www.slideshare.net/shriramd/shriram-correlation
For any query write to: ssdawkhar@gmail.com
Thank You.

More Related Content

What's hot

Recruitment & selection process practiced by a multinational organisation a c...
Recruitment & selection process practiced by a multinational organisation a c...Recruitment & selection process practiced by a multinational organisation a c...
Recruitment & selection process practiced by a multinational organisation a c...Nikita Palkar
 
MBA Report on Recruitment and Selection procedure
MBA Report on Recruitment and Selection procedure MBA Report on Recruitment and Selection procedure
MBA Report on Recruitment and Selection procedure samra khan
 
Business Research Methods Unit 2
Business Research Methods Unit 2Business Research Methods Unit 2
Business Research Methods Unit 2Amit Sarkar
 
Project on recruitment and selection process
Project on recruitment and selection processProject on recruitment and selection process
Project on recruitment and selection processankit kumar
 
mba (hr) summer training report
mba (hr) summer training reportmba (hr) summer training report
mba (hr) summer training reportRenu Dahiya
 
project report on hr operations and talent management
project report on hr operations and talent managementproject report on hr operations and talent management
project report on hr operations and talent managementpriyamvada14
 
Project report on_importance_of_recruitment_and_selection_process
Project report on_importance_of_recruitment_and_selection_processProject report on_importance_of_recruitment_and_selection_process
Project report on_importance_of_recruitment_and_selection_processdishasalian12
 
Questionnaire on work life balance for working parents
Questionnaire on work life balance for working parentsQuestionnaire on work life balance for working parents
Questionnaire on work life balance for working parentsSheetal Jain
 
Chp13 - Research Methods for Business By Authors Uma Sekaran and Roger Bougie
Chp13  - Research Methods for Business By Authors Uma Sekaran and Roger BougieChp13  - Research Methods for Business By Authors Uma Sekaran and Roger Bougie
Chp13 - Research Methods for Business By Authors Uma Sekaran and Roger BougieHassan Usman
 
Application of Research in Business
Application of Research in BusinessApplication of Research in Business
Application of Research in BusinessMuhammad Asif Khan
 
Recruitment and selection in talent management
Recruitment and selection in talent managementRecruitment and selection in talent management
Recruitment and selection in talent managementSeta Wicaksana
 
Employee engagement report
Employee engagement reportEmployee engagement report
Employee engagement reportSripRiya Iduri
 
Honda mba project
Honda mba project Honda mba project
Honda mba project John Ap
 
The sampling design process
The sampling design processThe sampling design process
The sampling design processKritika Jain
 

What's hot (20)

Recruitment & selection process practiced by a multinational organisation a c...
Recruitment & selection process practiced by a multinational organisation a c...Recruitment & selection process practiced by a multinational organisation a c...
Recruitment & selection process practiced by a multinational organisation a c...
 
MBA Report on Recruitment and Selection procedure
MBA Report on Recruitment and Selection procedure MBA Report on Recruitment and Selection procedure
MBA Report on Recruitment and Selection procedure
 
Types of Research -Business Research Methods
Types of Research -Business Research MethodsTypes of Research -Business Research Methods
Types of Research -Business Research Methods
 
Business Research Methods Unit 2
Business Research Methods Unit 2Business Research Methods Unit 2
Business Research Methods Unit 2
 
Project on recruitment and selection process
Project on recruitment and selection processProject on recruitment and selection process
Project on recruitment and selection process
 
MBA Notes Research Methodology
MBA Notes Research MethodologyMBA Notes Research Methodology
MBA Notes Research Methodology
 
mba (hr) summer training report
mba (hr) summer training reportmba (hr) summer training report
mba (hr) summer training report
 
project report on hr operations and talent management
project report on hr operations and talent managementproject report on hr operations and talent management
project report on hr operations and talent management
 
Project report on_importance_of_recruitment_and_selection_process
Project report on_importance_of_recruitment_and_selection_processProject report on_importance_of_recruitment_and_selection_process
Project report on_importance_of_recruitment_and_selection_process
 
Questionnaire on work life balance for working parents
Questionnaire on work life balance for working parentsQuestionnaire on work life balance for working parents
Questionnaire on work life balance for working parents
 
Chp13 - Research Methods for Business By Authors Uma Sekaran and Roger Bougie
Chp13  - Research Methods for Business By Authors Uma Sekaran and Roger BougieChp13  - Research Methods for Business By Authors Uma Sekaran and Roger Bougie
Chp13 - Research Methods for Business By Authors Uma Sekaran and Roger Bougie
 
The Business Research Method
The Business Research MethodThe Business Research Method
The Business Research Method
 
Application of Research in Business
Application of Research in BusinessApplication of Research in Business
Application of Research in Business
 
Recruitment and selection in talent management
Recruitment and selection in talent managementRecruitment and selection in talent management
Recruitment and selection in talent management
 
Ppt 1-introduction-brm
Ppt 1-introduction-brmPpt 1-introduction-brm
Ppt 1-introduction-brm
 
Employee engagement report
Employee engagement reportEmployee engagement report
Employee engagement report
 
Cross sectional design
Cross sectional designCross sectional design
Cross sectional design
 
Honda mba project
Honda mba project Honda mba project
Honda mba project
 
EMPLOYEE ENGAGEMENT PROJECT
EMPLOYEE ENGAGEMENT PROJECTEMPLOYEE ENGAGEMENT PROJECT
EMPLOYEE ENGAGEMENT PROJECT
 
The sampling design process
The sampling design processThe sampling design process
The sampling design process
 

Similar to Brm unit.5 data.analysis_interpretation_shriram.dawkhar.1

Executive Program Practical Connection Assignment - 100 poin
Executive Program Practical Connection Assignment - 100 poinExecutive Program Practical Connection Assignment - 100 poin
Executive Program Practical Connection Assignment - 100 poinBetseyCalderon89
 
A Beginner’s Guide to Factor Analysis: Focusing on Exploratory Factor Analysis
A Beginner’s Guide to Factor Analysis:  Focusing on Exploratory Factor Analysis A Beginner’s Guide to Factor Analysis:  Focusing on Exploratory Factor Analysis
A Beginner’s Guide to Factor Analysis: Focusing on Exploratory Factor Analysis Engr Mirza S Hasan
 
Systematic reviews: Why, How, So what?
Systematic reviews: Why, How, So what?Systematic reviews: Why, How, So what?
Systematic reviews: Why, How, So what?David Johns
 
Statistical ProcessesCan descriptive statistical processes b.docx
Statistical ProcessesCan descriptive statistical processes b.docxStatistical ProcessesCan descriptive statistical processes b.docx
Statistical ProcessesCan descriptive statistical processes b.docxdarwinming1
 
Assignment 2 RA Annotated BibliographyIn your final paper for .docx
Assignment 2 RA Annotated BibliographyIn your final paper for .docxAssignment 2 RA Annotated BibliographyIn your final paper for .docx
Assignment 2 RA Annotated BibliographyIn your final paper for .docxjosephinepaterson7611
 
6-Inferential-Statistics.pptx
6-Inferential-Statistics.pptx6-Inferential-Statistics.pptx
6-Inferential-Statistics.pptxsordillasecondsem
 
Mb0050 research methodology
Mb0050   research methodologyMb0050   research methodology
Mb0050 research methodologysmumbahelp
 
Between Black and White Population1. Comparing annual percent .docx
Between Black and White Population1. Comparing annual percent .docxBetween Black and White Population1. Comparing annual percent .docx
Between Black and White Population1. Comparing annual percent .docxjasoninnes20
 
Computing Descriptive Statistics © 2014 Argos.docx
 Computing Descriptive Statistics     © 2014 Argos.docx Computing Descriptive Statistics     © 2014 Argos.docx
Computing Descriptive Statistics © 2014 Argos.docxaryan532920
 
Computing Descriptive Statistics © 2014 Argos.docx
Computing Descriptive Statistics     © 2014 Argos.docxComputing Descriptive Statistics     © 2014 Argos.docx
Computing Descriptive Statistics © 2014 Argos.docxAASTHA76
 
Mb0050 research methodology
Mb0050   research methodologyMb0050   research methodology
Mb0050 research methodologysmumbahelp
 
Sampling
SamplingSampling
Samplingal amin
 
Statistics pres 3.31.2014
Statistics pres 3.31.2014Statistics pres 3.31.2014
Statistics pres 3.31.2014tjcarter
 
Hypothesis testing
Hypothesis testingHypothesis testing
Hypothesis testingSohail Patel
 
Sample size
Sample sizeSample size
Sample sizezubis
 
Bio-Statistics in Bio-Medical research
Bio-Statistics in Bio-Medical researchBio-Statistics in Bio-Medical research
Bio-Statistics in Bio-Medical researchShinjan Patra
 
Chapter 19Basic Quantitative Data AnalysisData Cleaning.docx
Chapter 19Basic Quantitative Data AnalysisData Cleaning.docxChapter 19Basic Quantitative Data AnalysisData Cleaning.docx
Chapter 19Basic Quantitative Data AnalysisData Cleaning.docxketurahhazelhurst
 

Similar to Brm unit.5 data.analysis_interpretation_shriram.dawkhar.1 (20)

Executive Program Practical Connection Assignment - 100 poin
Executive Program Practical Connection Assignment - 100 poinExecutive Program Practical Connection Assignment - 100 poin
Executive Program Practical Connection Assignment - 100 poin
 
A Beginner’s Guide to Factor Analysis: Focusing on Exploratory Factor Analysis
A Beginner’s Guide to Factor Analysis:  Focusing on Exploratory Factor Analysis A Beginner’s Guide to Factor Analysis:  Focusing on Exploratory Factor Analysis
A Beginner’s Guide to Factor Analysis: Focusing on Exploratory Factor Analysis
 
Systematic reviews: Why, How, So what?
Systematic reviews: Why, How, So what?Systematic reviews: Why, How, So what?
Systematic reviews: Why, How, So what?
 
Research Hypothesis
Research HypothesisResearch Hypothesis
Research Hypothesis
 
Statistical ProcessesCan descriptive statistical processes b.docx
Statistical ProcessesCan descriptive statistical processes b.docxStatistical ProcessesCan descriptive statistical processes b.docx
Statistical ProcessesCan descriptive statistical processes b.docx
 
Assignment 2 RA Annotated BibliographyIn your final paper for .docx
Assignment 2 RA Annotated BibliographyIn your final paper for .docxAssignment 2 RA Annotated BibliographyIn your final paper for .docx
Assignment 2 RA Annotated BibliographyIn your final paper for .docx
 
6-Inferential-Statistics.pptx
6-Inferential-Statistics.pptx6-Inferential-Statistics.pptx
6-Inferential-Statistics.pptx
 
Mb0050 research methodology
Mb0050   research methodologyMb0050   research methodology
Mb0050 research methodology
 
Between Black and White Population1. Comparing annual percent .docx
Between Black and White Population1. Comparing annual percent .docxBetween Black and White Population1. Comparing annual percent .docx
Between Black and White Population1. Comparing annual percent .docx
 
Computing Descriptive Statistics © 2014 Argos.docx
 Computing Descriptive Statistics     © 2014 Argos.docx Computing Descriptive Statistics     © 2014 Argos.docx
Computing Descriptive Statistics © 2014 Argos.docx
 
Computing Descriptive Statistics © 2014 Argos.docx
Computing Descriptive Statistics     © 2014 Argos.docxComputing Descriptive Statistics     © 2014 Argos.docx
Computing Descriptive Statistics © 2014 Argos.docx
 
Mb0050 research methodology
Mb0050   research methodologyMb0050   research methodology
Mb0050 research methodology
 
Methodology
MethodologyMethodology
Methodology
 
Sampling
SamplingSampling
Sampling
 
Statistics pres 3.31.2014
Statistics pres 3.31.2014Statistics pres 3.31.2014
Statistics pres 3.31.2014
 
Hypothesis testing
Hypothesis testingHypothesis testing
Hypothesis testing
 
Sample size
Sample sizeSample size
Sample size
 
Bio-Statistics in Bio-Medical research
Bio-Statistics in Bio-Medical researchBio-Statistics in Bio-Medical research
Bio-Statistics in Bio-Medical research
 
Chapter 19Basic Quantitative Data AnalysisData Cleaning.docx
Chapter 19Basic Quantitative Data AnalysisData Cleaning.docxChapter 19Basic Quantitative Data AnalysisData Cleaning.docx
Chapter 19Basic Quantitative Data AnalysisData Cleaning.docx
 
Research Procedure
Research ProcedureResearch Procedure
Research Procedure
 

More from Dr. Shriram Dawkhar, Sinhgad Institutes (9)

Research methods nicholas walliman
Research methods nicholas wallimanResearch methods nicholas walliman
Research methods nicholas walliman
 
Qualitative Research Methods
Qualitative Research MethodsQualitative Research Methods
Qualitative Research Methods
 
Qualitative research methods for student
Qualitative research methods for studentQualitative research methods for student
Qualitative research methods for student
 
Shriram correlation
Shriram correlationShriram correlation
Shriram correlation
 
Shriram edpm chapter-3
Shriram edpm chapter-3Shriram edpm chapter-3
Shriram edpm chapter-3
 
Sampling brm chap-4
Sampling brm chap-4Sampling brm chap-4
Sampling brm chap-4
 
Qualitative and quantitative research
Qualitative and quantitative researchQualitative and quantitative research
Qualitative and quantitative research
 
Research design brm-chap-2..
Research design brm-chap-2..Research design brm-chap-2..
Research design brm-chap-2..
 
Theories of entrepreneurship_shriram.dawkhar
Theories of entrepreneurship_shriram.dawkharTheories of entrepreneurship_shriram.dawkhar
Theories of entrepreneurship_shriram.dawkhar
 

Recently uploaded

0183760ssssssssssssssssssssssssssss00101011 (27).pdf
0183760ssssssssssssssssssssssssssss00101011 (27).pdf0183760ssssssssssssssssssssssssssss00101011 (27).pdf
0183760ssssssssssssssssssssssssssss00101011 (27).pdfRenandantas16
 
GD Birla and his contribution in management
GD Birla and his contribution in managementGD Birla and his contribution in management
GD Birla and his contribution in managementchhavia330
 
Lowrate Call Girls In Laxmi Nagar Delhi ❤️8860477959 Escorts 100% Genuine Ser...
Lowrate Call Girls In Laxmi Nagar Delhi ❤️8860477959 Escorts 100% Genuine Ser...Lowrate Call Girls In Laxmi Nagar Delhi ❤️8860477959 Escorts 100% Genuine Ser...
Lowrate Call Girls In Laxmi Nagar Delhi ❤️8860477959 Escorts 100% Genuine Ser...lizamodels9
 
Call Girls Miyapur 7001305949 all area service COD available Any Time
Call Girls Miyapur 7001305949 all area service COD available Any TimeCall Girls Miyapur 7001305949 all area service COD available Any Time
Call Girls Miyapur 7001305949 all area service COD available Any Timedelhimodelshub1
 
BEST Call Girls In Old Faridabad ✨ 9773824855 ✨ Escorts Service In Delhi Ncr,
BEST Call Girls In Old Faridabad ✨ 9773824855 ✨ Escorts Service In Delhi Ncr,BEST Call Girls In Old Faridabad ✨ 9773824855 ✨ Escorts Service In Delhi Ncr,
BEST Call Girls In Old Faridabad ✨ 9773824855 ✨ Escorts Service In Delhi Ncr,noida100girls
 
Cash Payment 9602870969 Escort Service in Udaipur Call Girls
Cash Payment 9602870969 Escort Service in Udaipur Call GirlsCash Payment 9602870969 Escort Service in Udaipur Call Girls
Cash Payment 9602870969 Escort Service in Udaipur Call GirlsApsara Of India
 
Lucknow 💋 Escorts in Lucknow - 450+ Call Girl Cash Payment 8923113531 Neha Th...
Lucknow 💋 Escorts in Lucknow - 450+ Call Girl Cash Payment 8923113531 Neha Th...Lucknow 💋 Escorts in Lucknow - 450+ Call Girl Cash Payment 8923113531 Neha Th...
Lucknow 💋 Escorts in Lucknow - 450+ Call Girl Cash Payment 8923113531 Neha Th...anilsa9823
 
Lowrate Call Girls In Sector 18 Noida ❤️8860477959 Escorts 100% Genuine Servi...
Lowrate Call Girls In Sector 18 Noida ❤️8860477959 Escorts 100% Genuine Servi...Lowrate Call Girls In Sector 18 Noida ❤️8860477959 Escorts 100% Genuine Servi...
Lowrate Call Girls In Sector 18 Noida ❤️8860477959 Escorts 100% Genuine Servi...lizamodels9
 
Grateful 7 speech thanking everyone that has helped.pdf
Grateful 7 speech thanking everyone that has helped.pdfGrateful 7 speech thanking everyone that has helped.pdf
Grateful 7 speech thanking everyone that has helped.pdfPaul Menig
 
Pitch Deck Teardown: NOQX's $200k Pre-seed deck
Pitch Deck Teardown: NOQX's $200k Pre-seed deckPitch Deck Teardown: NOQX's $200k Pre-seed deck
Pitch Deck Teardown: NOQX's $200k Pre-seed deckHajeJanKamps
 
Catalogue ONG NUOC PPR DE NHAT .pdf
Catalogue ONG NUOC PPR DE NHAT      .pdfCatalogue ONG NUOC PPR DE NHAT      .pdf
Catalogue ONG NUOC PPR DE NHAT .pdfOrient Homes
 
Call Girls In Radisson Blu Hotel New Delhi Paschim Vihar ❤️8860477959 Escorts...
Call Girls In Radisson Blu Hotel New Delhi Paschim Vihar ❤️8860477959 Escorts...Call Girls In Radisson Blu Hotel New Delhi Paschim Vihar ❤️8860477959 Escorts...
Call Girls In Radisson Blu Hotel New Delhi Paschim Vihar ❤️8860477959 Escorts...lizamodels9
 
Call Girls in Gomti Nagar - 7388211116 - With room Service
Call Girls in Gomti Nagar - 7388211116  - With room ServiceCall Girls in Gomti Nagar - 7388211116  - With room Service
Call Girls in Gomti Nagar - 7388211116 - With room Servicediscovermytutordmt
 
Lean: From Theory to Practice — One City’s (and Library’s) Lean Story… Abridged
Lean: From Theory to Practice — One City’s (and Library’s) Lean Story… AbridgedLean: From Theory to Practice — One City’s (and Library’s) Lean Story… Abridged
Lean: From Theory to Practice — One City’s (and Library’s) Lean Story… AbridgedKaiNexus
 
The CMO Survey - Highlights and Insights Report - Spring 2024
The CMO Survey - Highlights and Insights Report - Spring 2024The CMO Survey - Highlights and Insights Report - Spring 2024
The CMO Survey - Highlights and Insights Report - Spring 2024christinemoorman
 
Marketing Management Business Plan_My Sweet Creations
Marketing Management Business Plan_My Sweet CreationsMarketing Management Business Plan_My Sweet Creations
Marketing Management Business Plan_My Sweet Creationsnakalysalcedo61
 
M.C Lodges -- Guest House in Jhang.
M.C Lodges --  Guest House in Jhang.M.C Lodges --  Guest House in Jhang.
M.C Lodges -- Guest House in Jhang.Aaiza Hassan
 
(8264348440) 🔝 Call Girls In Keshav Puram 🔝 Delhi NCR
(8264348440) 🔝 Call Girls In Keshav Puram 🔝 Delhi NCR(8264348440) 🔝 Call Girls In Keshav Puram 🔝 Delhi NCR
(8264348440) 🔝 Call Girls In Keshav Puram 🔝 Delhi NCRsoniya singh
 

Recently uploaded (20)

0183760ssssssssssssssssssssssssssss00101011 (27).pdf
0183760ssssssssssssssssssssssssssss00101011 (27).pdf0183760ssssssssssssssssssssssssssss00101011 (27).pdf
0183760ssssssssssssssssssssssssssss00101011 (27).pdf
 
GD Birla and his contribution in management
GD Birla and his contribution in managementGD Birla and his contribution in management
GD Birla and his contribution in management
 
Best Practices for Implementing an External Recruiting Partnership
Best Practices for Implementing an External Recruiting PartnershipBest Practices for Implementing an External Recruiting Partnership
Best Practices for Implementing an External Recruiting Partnership
 
Lowrate Call Girls In Laxmi Nagar Delhi ❤️8860477959 Escorts 100% Genuine Ser...
Lowrate Call Girls In Laxmi Nagar Delhi ❤️8860477959 Escorts 100% Genuine Ser...Lowrate Call Girls In Laxmi Nagar Delhi ❤️8860477959 Escorts 100% Genuine Ser...
Lowrate Call Girls In Laxmi Nagar Delhi ❤️8860477959 Escorts 100% Genuine Ser...
 
Call Girls Miyapur 7001305949 all area service COD available Any Time
Call Girls Miyapur 7001305949 all area service COD available Any TimeCall Girls Miyapur 7001305949 all area service COD available Any Time
Call Girls Miyapur 7001305949 all area service COD available Any Time
 
BEST Call Girls In Old Faridabad ✨ 9773824855 ✨ Escorts Service In Delhi Ncr,
BEST Call Girls In Old Faridabad ✨ 9773824855 ✨ Escorts Service In Delhi Ncr,BEST Call Girls In Old Faridabad ✨ 9773824855 ✨ Escorts Service In Delhi Ncr,
BEST Call Girls In Old Faridabad ✨ 9773824855 ✨ Escorts Service In Delhi Ncr,
 
Cash Payment 9602870969 Escort Service in Udaipur Call Girls
Cash Payment 9602870969 Escort Service in Udaipur Call GirlsCash Payment 9602870969 Escort Service in Udaipur Call Girls
Cash Payment 9602870969 Escort Service in Udaipur Call Girls
 
Lucknow 💋 Escorts in Lucknow - 450+ Call Girl Cash Payment 8923113531 Neha Th...
Lucknow 💋 Escorts in Lucknow - 450+ Call Girl Cash Payment 8923113531 Neha Th...Lucknow 💋 Escorts in Lucknow - 450+ Call Girl Cash Payment 8923113531 Neha Th...
Lucknow 💋 Escorts in Lucknow - 450+ Call Girl Cash Payment 8923113531 Neha Th...
 
Lowrate Call Girls In Sector 18 Noida ❤️8860477959 Escorts 100% Genuine Servi...
Lowrate Call Girls In Sector 18 Noida ❤️8860477959 Escorts 100% Genuine Servi...Lowrate Call Girls In Sector 18 Noida ❤️8860477959 Escorts 100% Genuine Servi...
Lowrate Call Girls In Sector 18 Noida ❤️8860477959 Escorts 100% Genuine Servi...
 
Grateful 7 speech thanking everyone that has helped.pdf
Grateful 7 speech thanking everyone that has helped.pdfGrateful 7 speech thanking everyone that has helped.pdf
Grateful 7 speech thanking everyone that has helped.pdf
 
Pitch Deck Teardown: NOQX's $200k Pre-seed deck
Pitch Deck Teardown: NOQX's $200k Pre-seed deckPitch Deck Teardown: NOQX's $200k Pre-seed deck
Pitch Deck Teardown: NOQX's $200k Pre-seed deck
 
KestrelPro Flyer Japan IT Week 2024 (English)
KestrelPro Flyer Japan IT Week 2024 (English)KestrelPro Flyer Japan IT Week 2024 (English)
KestrelPro Flyer Japan IT Week 2024 (English)
 
Catalogue ONG NUOC PPR DE NHAT .pdf
Catalogue ONG NUOC PPR DE NHAT      .pdfCatalogue ONG NUOC PPR DE NHAT      .pdf
Catalogue ONG NUOC PPR DE NHAT .pdf
 
Call Girls In Radisson Blu Hotel New Delhi Paschim Vihar ❤️8860477959 Escorts...
Call Girls In Radisson Blu Hotel New Delhi Paschim Vihar ❤️8860477959 Escorts...Call Girls In Radisson Blu Hotel New Delhi Paschim Vihar ❤️8860477959 Escorts...
Call Girls In Radisson Blu Hotel New Delhi Paschim Vihar ❤️8860477959 Escorts...
 
Call Girls in Gomti Nagar - 7388211116 - With room Service
Call Girls in Gomti Nagar - 7388211116  - With room ServiceCall Girls in Gomti Nagar - 7388211116  - With room Service
Call Girls in Gomti Nagar - 7388211116 - With room Service
 
Lean: From Theory to Practice — One City’s (and Library’s) Lean Story… Abridged
Lean: From Theory to Practice — One City’s (and Library’s) Lean Story… AbridgedLean: From Theory to Practice — One City’s (and Library’s) Lean Story… Abridged
Lean: From Theory to Practice — One City’s (and Library’s) Lean Story… Abridged
 
The CMO Survey - Highlights and Insights Report - Spring 2024
The CMO Survey - Highlights and Insights Report - Spring 2024The CMO Survey - Highlights and Insights Report - Spring 2024
The CMO Survey - Highlights and Insights Report - Spring 2024
 
Marketing Management Business Plan_My Sweet Creations
Marketing Management Business Plan_My Sweet CreationsMarketing Management Business Plan_My Sweet Creations
Marketing Management Business Plan_My Sweet Creations
 
M.C Lodges -- Guest House in Jhang.
M.C Lodges --  Guest House in Jhang.M.C Lodges --  Guest House in Jhang.
M.C Lodges -- Guest House in Jhang.
 
(8264348440) 🔝 Call Girls In Keshav Puram 🔝 Delhi NCR
(8264348440) 🔝 Call Girls In Keshav Puram 🔝 Delhi NCR(8264348440) 🔝 Call Girls In Keshav Puram 🔝 Delhi NCR
(8264348440) 🔝 Call Girls In Keshav Puram 🔝 Delhi NCR
 

Brm unit.5 data.analysis_interpretation_shriram.dawkhar.1

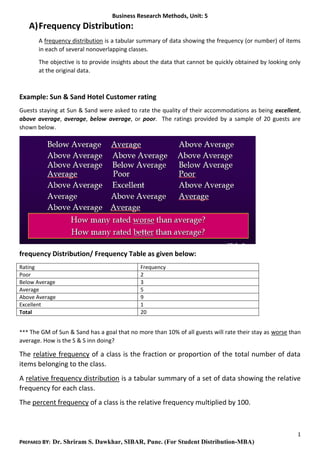
  • 1. Business Research Methods, Unit: 5 1 PREPARED BY: Dr. Shriram S. Dawkhar, SIBAR, Pune. (For Student Distribution-MBA) A)Frequency Distribution: A frequency distribution is a tabular summary of data showing the frequency (or number) of items in each of several nonoverlapping classes. The objective is to provide insights about the data that cannot be quickly obtained by looking only at the original data. Example: Sun & Sand Hotel Customer rating Guests staying at Sun & Sand were asked to rate the quality of their accommodations as being excellent, above average, average, below average, or poor. The ratings provided by a sample of 20 guests are shown below. frequency Distribution/ Frequency Table as given below: Rating Frequency Poor 2 Below Average 3 Average 5 Above Average 9 Excellent 1 Total 20 *** The GM of Sun & Sand has a goal that no more than 10% of all guests will rate their stay as worse than average. How is the S & S inn doing? The relative frequency of a class is the fraction or proportion of the total number of data items belonging to the class. A relative frequency distribution is a tabular summary of a set of data showing the relative frequency for each class. The percent frequency of a class is the relative frequency multiplied by 100.
  • 2. Business Research Methods, Unit: 5 2 PREPARED BY: Dr. Shriram S. Dawkhar, SIBAR, Pune. (For Student Distribution-MBA) A percent frequency distribution is a tabular summary of a set of data showing the percent frequency for each class. Pie Chart: • The pie chart is a commonly used graphical device for presenting relative frequency distributions for qualitative data. • First draw a circle; then use the relative frequencies to subdivide the circle into sectors that correspond to the relative frequency for each class. • Since there are 360 degrees in a circle, a class with a relative frequency of .25 would consume .25(360) = 90 degrees of the circle. • Or simply 25X3.6= 90 or 10X3.6 = 36 • ( Angel = X/total *360 please check solved example in the class )
  • 3. Business Research Methods, Unit: 5 3 PREPARED BY: Dr. Shriram S. Dawkhar, SIBAR, Pune. (For Student Distribution-MBA)
  • 4. Business Research Methods, Unit: 5 4 PREPARED BY: Dr. Shriram S. Dawkhar, SIBAR, Pune. (For Student Distribution-MBA) Types of statistical measures Measures of central tendency Mean / average / arithmetic mean Median Mode Measures of dispersion Range Quartile deviation or semi-quartile range Mean absolute deviation Standard deviation Problem: Mean, Mode & Median: 1) Given below 31 students height data, Calculate mean, mode, median and Range.
  • 5. Business Research Methods, Unit: 5 5 PREPARED BY: Dr. Shriram S. Dawkhar, SIBAR, Pune. (For Student Distribution-MBA) Problem :2) Apartment Rents: 1) Mean: The mean of a data set is the average of all the data values. If the data are from a sample, the mean is denoted by x x n i=  If the data are from a population, the mean is denoted by  (mu). 2) Median The median of a data set is the value in the middle when the data items are arranged in ascending order. If there is an odd number of items, the median is the value of the middle item. If there is an even number of items, the median is the average of the values for the middle two items.
  • 6. Business Research Methods, Unit: 5 6 PREPARED BY: Dr. Shriram S. Dawkhar, SIBAR, Pune. (For Student Distribution-MBA) 3) Mode: The mode of a data set is the value that occurs with greatest frequency.
  • 7. Business Research Methods, Unit: 5 7 PREPARED BY: Dr. Shriram S. Dawkhar, SIBAR, Pune. (For Student Distribution-MBA) 4) Range: The range of a data set is the difference between the largest and smallest data values. It is the simplest measure of variability. It is very sensitive to the smallest and largest data values. 5) The coefficient of variation (CV) is a measure of relative variability. It is the ratio of the standard deviation to the mean (average). Coefficient of Variation = (Standard Deviation / Mean) * 100. 6. Standard Deviation The standard deviation of a data set is the positive square root of the variance. It is measured in the same units as the data, making it more easily comparable, than the variance, to the mean. If the data set is a sample, the standard deviation is denoted s. If the data set is a population, the standard deviation is denoted s (sigma
  • 8. Business Research Methods, Unit: 5 8 PREPARED BY: Dr. Shriram S. Dawkhar, SIBAR, Pune. (For Student Distribution-MBA) Non-Grouped Data Non-grouped data is just a list of values. The standard deviation is given by the formula: s means 'standard deviation'.
  • 9. Business Research Methods, Unit: 5 9 PREPARED BY: Dr. Shriram S. Dawkhar, SIBAR, Pune. (For Student Distribution-MBA) Criteria for Hypothesis testing: Very important Hypothesis Testing (Old question paper problems) Rules for Decision Making: (2 approaches) A)1st Approach: If Calculated (Observed) value & or Critical (table) value is used. Rules for Decision Making: 1)If Calculated Value (observed) < Critical (table) Value ……………….Then Accept Null hypothesis. 2)If Calculated Value (observed) > Critical (table) Value ………………. Then Reject the null hypothesis. B) 2nd Approach: Rules if Probability Value (p-value) Approach is used: Reject null hypothesis if the probability value (p-value) is less than significance level. If… p-value < Significance level ……..Reject the null hypothesis If…p-value > Significance level ……..Accept the null hypothesis
  • 10. Business Research Methods, Unit: 5 10 PREPARED BY: Dr. Shriram S. Dawkhar, SIBAR, Pune. (For Student Distribution-MBA) Solution: Null Hypothesis (H0): Magazine choice is independent of level of income. Alternate Hypothesis (Ha or H1) = Magazine choice is dependent of level of income. Now in above example, Calculated Value (observed) < Critical Value i.e. 3.956 < 5.99 Hence Null hypothesis is accepted. Hence we can say that Magazine choice is independent of level of income. Rules for Decision Making: 1)If Calculated Value (observed) < Critical (table) Value ……………….Then Accept Null hypothesis. 2)If Calculated Value (observed) > Critical (table) Value ………………. Then Reject the null hypothesis.
  • 11. Business Research Methods, Unit: 5 11 PREPARED BY: Dr. Shriram S. Dawkhar, SIBAR, Pune. (For Student Distribution-MBA) Solution: Null hypothesis: The mean salary of the students is 45000 Alternate hypothesis: The mean salary of the students is not 45000 Rules for Decision Making: 1) If Calculated Value (observed) < Critical (table) Value ……………….Then Accept Null hypothesis. 2) If Calculated Value (observed) > Critical (table) Value ………………. Then Reject the null hypothesis. Now in above example, Calculated Value (observed) < Critical (table) Value i.e. 0.83 < 2.131 Hence Null hypothesis is accepted. Thus, we can say that the mean salary of the students is 45000.
  • 12. Business Research Methods, Unit: 5 12 PREPARED BY: Dr. Shriram S. Dawkhar, SIBAR, Pune. (For Student Distribution-MBA) Solution: Null Hypothesis: The die was fair. Alternate hypothesis: The die was not fair. Level of Significance 5% i.e. .5 (given) Degrees of freedom = n-1 = 6-1 = 5………………total 6 possible observations/outcomes. i.e. faces: 1,2,3,4,5,6 Rules for Decision Making: 1) If Calculated Value (observed) < Critical (table) Value ……………….Then Accept Null hypothesis. 2) If Calculated Value (observed) > Critical (table) Value ………………. Then Reject the null hypothesis. Now in above example, Calculated Value (observed) > Critical (table) Value i.e. 11.40 > 11.07 Hence Null hypothesis is rejected. Hence alternate hypothesis can be accepted. Thus we can say that the die was not fair.
  • 13. Business Research Methods, Unit: 5 13 PREPARED BY: Dr. Shriram S. Dawkhar, SIBAR, Pune. (For Student Distribution-MBA) Solution: Null Hypothesis: The mean height of the students is 171.17. Alternate hypothesis: The mean height of the students is not 171.17. Rules for Decision Making: 1) If Calculated Value (observed) < Critical (table) Value ……………….Then Accept Null hypothesis. 2) If Calculated Value (observed) > Critical (table) Value ………………. Then Reject the null hypothesis. Now in above example, Calculated Value (observed) < Critical (table) Value i.e. 1.27 < 1.96 Hence Null hypothesis is accepted. Hence we can say that the mean height of the students is 171.17.
  • 14. Business Research Methods, Unit: 5 14 PREPARED BY: Dr. Shriram S. Dawkhar, SIBAR, Pune. (For Student Distribution-MBA) Type I (Alpha: α) & Type II (Beta: β) error in hypothesis testing: • Type I errors happen when we reject a true null hypothesis • Type II errors happen when we fail to reject a false null hypothesis. • Type I Error: The first kind of error that is possible involves the rejection of a null hypothesis that is actually true. This kind of error is called a type I error and is sometimes called an error of the first kind. • Type II Error: The other kind of error that is possible occurs when we do not reject a null hypothesis that is false. This sort of error is called a type II error and is also referred to as an error of the second kind. Example: • Type I error - Concluding that the new drug is better than the standard (HA) when in fact it is no better (H0). Ineffective drug is deemed better. • Type II error - Failing to conclude that the new drug is better (HA) when in fact it is. Effective drug is deemed to be no better.
  • 15. Business Research Methods, Unit: 5 15 PREPARED BY: Dr. Shriram S. Dawkhar, SIBAR, Pune. (For Student Distribution-MBA) Correlation ◼ Correlation: The degree of relationship between the variables under consideration is measure through the correlation analysis. ◼ The measure of correlation called the correlation coefficient. ◼ The degree of relationship is expressed by coefficient which range from correlation ( -1 ≤ r ≥ +1) ◼ The direction of change is indicated by a sign. ◼ The correlation analysis enable us to have an idea about the degree & direction of the relationship between the two variables under study. ◼ Correlation is a statistical tool that helps to measure and analyze the degree of relationship between two variables. ◼ Correlation analysis deals with the association between two or more variables. 1) Positive and Negative Correlation: ◼ Positive Correlation: The correlation is said to be positive correlation if the values of two variables changing with same direction. Ex. Pub./Ad. Exp. & sales, Height & weight. ◼ Negative Correlation: The correlation is said to be negative correlation when the values of variables change with opposite direction. Ex. Price & qty. demanded. 2) Simple and Multiple Correlation ◼ Simple correlation: Under simple correlation problem there are only two variables are studied. Types of Coorelation 1) Positive and Negative Correlation 3) Linear and Non- linear Correlation 2) Simple and Multiple Correlation
  • 16. Business Research Methods, Unit: 5 16 PREPARED BY: Dr. Shriram S. Dawkhar, SIBAR, Pune. (For Student Distribution-MBA) ◼ Multiple Correlation: Under Multiple Correlation three or more than three variables are studied. Ex. Qd = f ( P,PC, PS, t, y ) ◼ Partial correlation: analysis recognizes more than two variables but considers only two variables keeping the other constant. ◼ Total correlation: is based on all the relevant variables, which is normally not feasible. 3) Linear and Non-linear Correlation ◼ Linear correlation: Correlation is said to be linear when the amount of change in one variable tends to bear a constant ratio to the amount of change in the other. The graph of the variables having a linear relationship will form a straight line. Ex X = 1, 2, 3, 4, 5, 6, 7, 8, Y = 5, 7, 9, 11, 13, 15, 17, 19, Y = 3 + 2x ◼ Non Linear correlation: The correlation would be non linear if the amount of change in one variable does not bear a constant ratio to the amount of change in the other variable. 1) Scatter Diagram: Scatter Diagram is a graph of observed plotted points where each points represents the values of X & Y as a coordinate. It portrays the relationship between these two variables graphically 2) Karl Pearson’s Coefficient of Correlation (r) Methods of Studying Correlation 1) Scatter Diagram Method 3) Spearman’s Rank Correlation Coefficient 2) Karl Pearson’s Coefficient of Correlation (r)
  • 17. Business Research Methods, Unit: 5 17 PREPARED BY: Dr. Shriram S. Dawkhar, SIBAR, Pune. (For Student Distribution-MBA) Karl Pearson’s Coefficient of Correlation denoted by- ‘r’ The coefficient of correlation ‘r’ measure the degree of linear relationship between two variables say x & y ◼ Karl Pearson’s Coefficient of Correlation denoted by- r -1 ≤ r ≥ +1 ◼ Degree of Correlation is expressed by a value of Coefficient ◼ Direction of change is Indicated by sign ( - ve) or ( + ve) 3) Spearman’s Rank Coefficient of Correlation ρ (rho): When statistical series in which the variables under study are not capable of quantitative measurement but can be arranged in serial order, in such situation pearson’s correlation coefficient can not be used in such case Spearman Rank correlation can be used. ρ (rho) = 1- (6 ∑D2 ) / N (N2 – 1)
  • 18. Business Research Methods, Unit: 5 18 PREPARED BY: Dr. Shriram S. Dawkhar, SIBAR, Pune. (For Student Distribution-MBA) Interpretation of Correlation:
  • 19. Business Research Methods, Unit: 5 19 PREPARED BY: Dr. Shriram S. Dawkhar, SIBAR, Pune. (For Student Distribution-MBA) Data analysis: • Data analysis: involves entering data into computer files, inspecting data for errors (data cleaning), running tabulations (frequencies), and conducting various statistical tests – Before analyzing data there are a few preliminary tasks to be completed. These tasks include editing, coding, classification and tabulation. i) Editing:
  • 20. Business Research Methods, Unit: 5 20 PREPARED BY: Dr. Shriram S. Dawkhar, SIBAR, Pune. (For Student Distribution-MBA) Editing is the procedure that improves the quality of the data for coding. Here researcher look for inconsistencies, incompleteness of data and such data is discarded for lack or utility for interpretation and analysis • “ The process of checking the completeness, consistency & legibility of data ready for coding & transfer to storage” • “The process of checking and adjusting responses in the completed questionnaires for omissions, legibility, and consistency and readying them for coding and storage.” Purpose of editing • Editing purpose is to guarantee that the data is : • 1) Accurate • 2) Consistent with intent of the question & other information in the survey. • 3) Complete • 4) arranged to simplify coding & tabulation Types of Editing: 1. Field Editing – Preliminary editing by a field supervisor on the same day as the interview to catch technical omissions, check legibility of handwriting, and clarify responses that are logically or conceptually inconsistent. 2. In-house Editing – Editing performed by a central office staff; often dome more rigorously than field editing ii) Coding: – Coding involves assigning suitable codes or symbols to categories of responses so as to aid further human or computer analysis. • The process of identifying and classifying each answer with a numerical score or other character symbol – The numerical score or symbol is called a code, and serves as a rule for interpreting, classifying, and recording data – Identifying responses with codes is necessary if data is to be processed by computer
  • 21. Business Research Methods, Unit: 5 21 PREPARED BY: Dr. Shriram S. Dawkhar, SIBAR, Pune. (For Student Distribution-MBA) Example: Male =1, Female =2 & Transgender = 3 iii) Classification: Next stage is classification where data having common Characteristic are placed in one class. – Classification according to attributes: It can be. • - Descriptive e.g. literacy, gender etc. or • - Numerical e.g. weight, height, income etc. • Classification according to class intervals • – Data relating to income, production, age, weight etc. come under this category. iv) Tabulation: Here classified data are put in the form of tables. **** For details about correlation types, graphical presentations, dot plots & other details please check complete PPT on above link: https://www.slideshare.net/shriramd/shriram-correlation For any query write to: ssdawkhar@gmail.com Thank You.