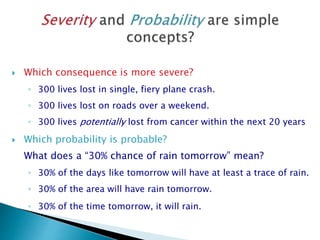
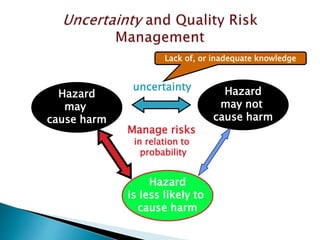
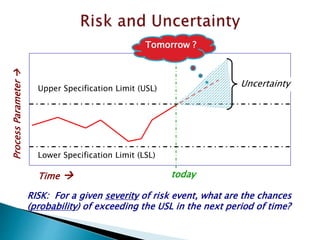
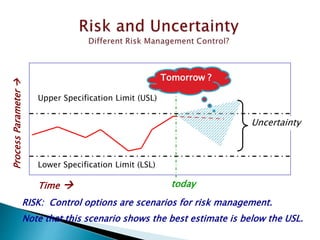
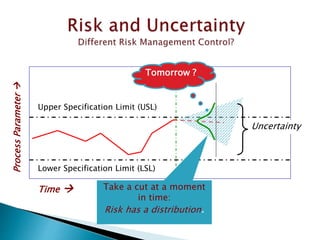
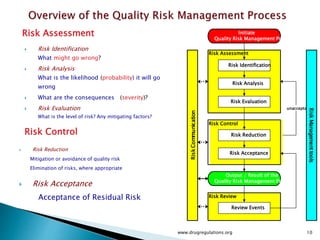
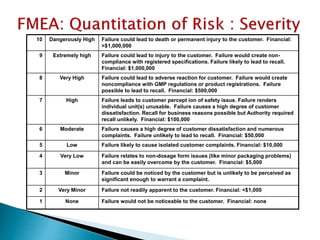
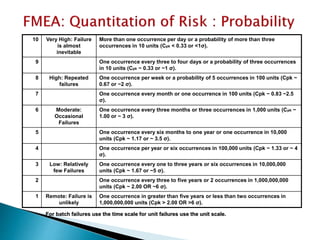
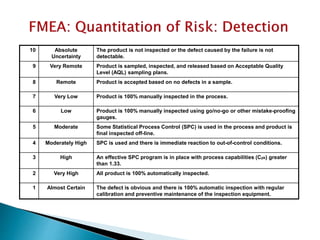
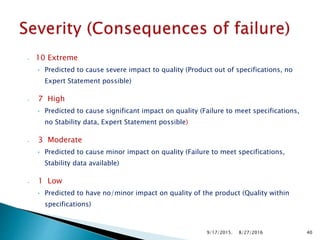
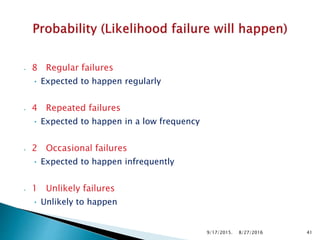
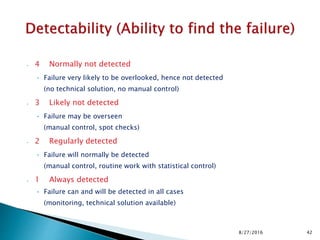
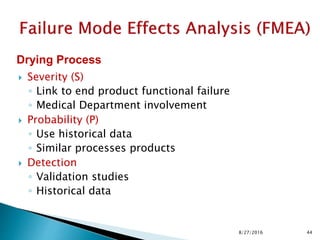
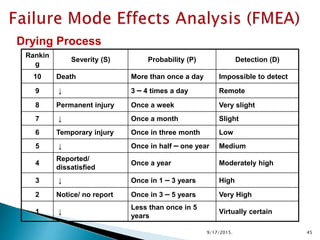
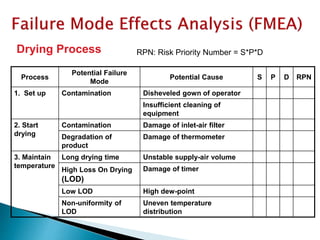
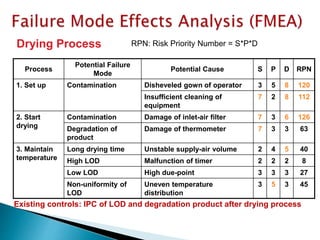
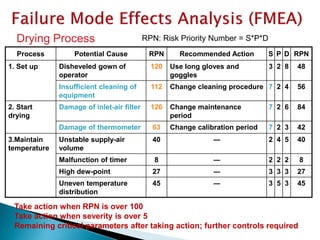
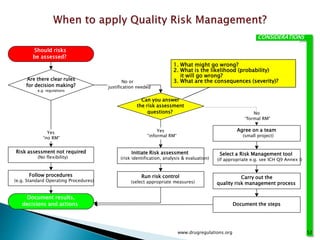
2. This presentation will cover
1. Overview of Quality Risk Management
Process & Tools
2. FMEA Overview
3. Calculation of RPN
4. Case Stud
◦ Drying Process
www.drugregulations.org 2
3. Risk
◦ Combination of
◦ Probability of occurrence of harm and
◦ Severity of that harm.
4. Any circumstances which can cause an
adverse health effect.
◦ Research , Pre-clinical , Clinical
◦ Production
◦ Control
◦ Distribution
5. Which consequence is more severe?
◦ 300 lives lost in single, fiery plane crash.
◦ 300 lives lost on roads over a weekend.
◦ 300 lives potentially lost from cancer within the next 20 years
Which probability is probable?
What does a “30% chance of rain tomorrow” mean?
◦ 30% of the days like tomorrow will have at least a trace of rain.
◦ 30% of the area will have rain tomorrow.
◦ 30% of the time tomorrow, it will rain.
7. Time
ProcessParameter
Lower Specification Limit (LSL)
Upper Specification Limit (USL)
today
Uncertainty
RISK: For a given severity of risk event, what are the chances
(probability) of exceeding the USL in the next period of time?
Tomorrow ?
8. Time
ProcessParameter
Lower Specification Limit (LSL)
Upper Specification Limit (USL)
today
Uncertainty
RISK: Control options are scenarios for risk management.
Note that this scenario shows the best estimate is below the USL.
Tomorrow ?
10. Risk Identification
What might go wrong?
Risk Analysis
What is the likelihood (probability) it will go
wrong
What are the consequences (severity)?
Risk Evaluation
What is the level of risk? Any mitigating factors?
Risk Assessment
www.drugregulations.org 10
Risk Review
RiskCommunication
Risk Assessment
Risk Evaluation
unacceptable
Risk Control
Risk Analysis
Risk Reduction
Risk Identification
Review Events
Risk Acceptance
Initiate
Quality Risk Management Process
Output / Result of the
Quality Risk Management Process
RiskManagementtools
Risk Reduction
Mitigation or avoidance of quality risk
Elimination of risks, where appropriate
Risk Control
Risk Acceptance
Acceptance of Residual Risk
11. System Risk (facility & people)
◦ e.g. interfaces, operators risk, environment,
components such as equipment, IT, design elements
System Risk (organisation)
◦ e.g. Quality systems, controls, measurements,
documentation, regulatory compliance
Process Risk
◦ e.g. process operations and quality parameters
Product Risk (safety & efficacy)
◦ e.g. quality attributes:
measured data according to specifications
12. The evaluation of
the risk to quality
should be based on
scientific knowledge
and ultimately link
to the protection
of the patient
The level of effort,
formality and
documentation
of the quality risk
management process
should be
commensurate with the
level of risk
ICH Q9
13.
14. Supporting statistical tools
◦ Acceptance Control Charts (see ISO 7966)
◦ Control Charts (for example)
Control Charts with Arithmetic Average and
Warning Limits (see ISO 7873)
Cumulative Sum Charts; “CuSum” (see ISO 7871)
Shewhart Control Charts (see ISO 8258)
Weighted Moving Average
◦ Pareto Charts
◦ Process Capability Analysis
◦ Histograms
◦ Design of Experiments (DOE)
◦ Use others that you are familiar with….
www.drugregulations.org 14
16. Systematic Method for Identification and
Prevention of
Product & Process Problems before they occur
Focused on Preventing Defects
Ideally conducted in Product & Process Design
Stage
Conducting on existing products & processes
yields substantial results.
168/27/2016
Drug Regulations : Online Resource for Latest Information
17. First formal FEMA was conducted in Aerospace Industry in
1960’s
Became key tool for improving safety of chemical
processes
Safety FMEA today is a key tool to prevent safety accidents
& incidents
Engineers have always used FMEA to identify potential
failures of product & processes
Automotive Industry used FMEA for Quality Improvement
178/27/2016
Drug Regulations : Online Resource for Latest Information
18. Essential to have documented Data and Information
about Product & Process
Otherwise it becomes a guessing game based on
opinions.
FMEA will then focus on wrong failure modes
FMEA should be based on facts : on DATA
188/27/2016
Drug Regulations : Online Resource for Latest Information
19. To look for all different ways in which a product or
process can fail
Failures are not limited to products
Failures can occur when the user makes a mistake
These failures should also be included in FMEA
198/27/2016
Drug Regulations : Online Resource for Latest Information
20. Ways in which a product or process can fail are called
FAILURE MODES
Each FAILURE MODE has a potential effect
Some effects are more likely to occur than others –
each failure mode has a probability
Each FAILURE MODE has relative RISK associated with
it.
208/27/2016
Drug Regulations : Online Resource for Latest Information
21. FMEA process is way to identify the failures, effects,
and risks within a process or product and then
eliminate or reduce them.
218/27/2016
Drug Regulations : Online Resource for Latest Information
22. Process Step : Pre-mixing
Failure Mode : Mixing time
Effect : Not meet specifications of content uniformity
Risk Reduction: IPC measure of content uniformity
Comments: Effect on efficacy
228/27/2016
Drug Regulations : Online Resource for Latest Information
23. Process Step : Pre-mixing granulation
Failure Mode : speed of adding water
Effect : Not meet specifications of dissolution and
degradation
Risk Reduction: Use of dosing pump
Comments: Appropriate granulation
238/27/2016
Drug Regulations : Online Resource for Latest Information
24. Process Step : Pre-mixing granulation
Failure Mode : Manner of adding water
Effect : Not meet specifications of dissolution and
degradation
Risk Reduction: Install a spray nozzle
Comments: Appropriate granulation
248/27/2016
Drug Regulations : Online Resource for Latest Information
25. Process Step : Granulation
Failure Mode : Kneading Time
Effect : Not meet dissolution specification
Risk Reduction: Reduce Personal fluctuations
Comments: Operator knowledge , power
consumption, difficult to automate
258/27/2016
Drug Regulations : Online Resource for Latest Information
26. Process Step : Granulation
Failure Mode : Power consumption
Effect : Not meet dissolution specification
Risk Reduction: Try to get optimum kneading time
Comments: Depends on material properties
268/27/2016
Drug Regulations : Online Resource for Latest Information
27. Process Step : Granulation
Failure Mode : Quality of excipients
Effect : All parameters may need re-evaluation
Risk Reduction: Internal specifications for physical
parameters
Comments: Supplier qualification
278/27/2016
Drug Regulations : Online Resource for Latest Information
28. Process Step : Granulation drying
Failure Mode : Water Content
Effect : Not meet degradation specification
Risk Reduction: On line NIR , IPC measurements,
Comments: Indirect , Time consuming
288/27/2016
Drug Regulations : Online Resource for Latest Information
29. The relative risk of a failure and its effects is
determined by three factors
Severity: The consequences of the failure should it
occur
Occurrence: The probability or the frequency of the
failure occurring
Detection : The probability of the failure being
detected before the impact of the effect is realized.
298/27/2016
Drug Regulations : Online Resource for Latest Information
30. Each Potential Failure Mode is rated in each of the
three factors on a scale ranging from 1 to 10 , low to
high.
Risk Priority Number( RPN) is determined by
multiplying the ranking of the three factors ( severity
X occurrence X detection )
The RPN is determined for each potential failure and
each effect.
308/27/2016
Drug Regulations : Online Resource for Latest Information
31. The RPN is used to rank the need for corrective action
to eliminate or reduce the potential failure modes.
Failure modes with highest RPN should be attended
first
Special attention should be given when the severity
ranking is high : 9 or 10
RPN will range from 1 to 1000 for each failure mode.
318/27/2016
Drug Regulations : Online Resource for Latest Information
32. Once corrective action is taken , a new RPN is
determined by re-evaluating the severity , occurrence
and detection.
The new RPN is called “ Resulting RPN”
Improvements and corrective actions must continue
until the “ Resulting RPN is at an acceptable level for
all potential failure modes.
328/27/2016
Drug Regulations : Online Resource for Latest Information
34. Potential Areas of Use(s)
Prioritize risks
Monitor the effectiveness of risk control activities
Equipment and facilities
Analyse a manufacturing process to identify high-risk
steps or critical parameters
RNP: Risk Priority Number
348/27/2016
Drug Regulations : Online Resource for Latest Information
35. 1. Review the Process or Product
2. Brainstorm potential failure modes
3. List Potential effects of each failure mode
4. Assign a Severity Ranking for each failure mode
5. Assign Occurrence Ranking for each failure mode
6. Assign detection ranking for each failure mode or effect
7. Calculate the RPN for each effect
8. Prioritize the Failure Modes for Action
9. Take action to eliminate or reduce high risk failure modes
10. Calculate the RPN again as the failure modes are reduced or
eliminated.
358/27/2016
Drug Regulations : Online Resource for Latest Information
37. 10 Dangerously High Failure could lead to death or permanent injury to the customer. Financial:
>$1,000,000
9 Extremely high Failure could lead to injury to the customer. Failure would create non-
compliance with registered specifications. Failure likely to lead to recall.
Financial: $1,000,000
8 Very High Failure could lead to adverse reaction for customer. Failure would create
noncompliance with GMP regulations or product registrations. Failure
possible to lead to recall. Financial: $500,000
7 High Failure leads to customer percept ion of safety issue. Failure renders
individual unit(s) unusable. Failure causes a high degree of customer
dissatisfaction. Recall for business reasons possible but Authority required
recall unlikely. Financial: $100,000
6 Moderate Failure causes a high degree of customer dissatisfaction and numerous
complaints. Failure unlikely to lead to recall. Financial: $50,000
5 Low Failure likely to cause isolated customer complaints. Financial: $10,000
4 Very Low Failure relates to non-dosage form issues (like minor packaging problems)
and can be easily overcome by the customer. Financial: $5,000
3 Minor Failure could be noticed by the customer but is unlikely to be perceived as
significant enough to warrant a complaint.
2 Very Minor Failure not readily apparent to the customer. Financial: <$1,000
1 None Failure would not be noticeable to the customer. Financial: none
38. 10 Very High: Failure
is almost
inevitable
More than one occurrence per day or a probability of more than three
occurrences in 10 units (Cpk < 0.33 or <1σ).
9 One occurrence every three to four days or a probability of three occurrences
in 10 units (Cpk ~ 0.33 or ~1 σ).
8 High: Repeated
failures
One occurrence per week or a probability of 5 occurrences in 100 units (Cpk ~
0.67 or ~2 σ).
7 One occurrence every month or one occurrence in 100 units (Cpk ~ 0.83 ~2.5
σ).
6 Moderate:
Occasional
Failures
One occurrence every three months or three occurrences in 1,000 units (Cpk ~
1.00 or ~ 3 σ).
5 One occurrence every six months to one year or one occurrence in 10,000
units (Cpk ~ 1.17 or ~ 3.5 σ).
4 One occurrence per year or six occurrences in 100,000 units (Cpk ~ 1.33 or ~ 4
σ).
3 Low: Relatively
few Failures
One occurrence every one to three years or six occurrences in 10,000,000
units (Cpk ~ 1.67 or ~5 σ).
2 One occurrence every three to five years or 2 occurrences in 1,000,000,000
units (Cpk ~ 2.00 OR ~6 σ).
1 Remote: Failure is
unlikely
One occurrence in greater than five years or less than two occurrences in
1,000,000,000 units (Cpk > 2.00 OR >6 σ).
For batch failures use the time scale for unit failures use the unit scale.
39. 10 Absolute
Uncertainty
The product is not inspected or the defect caused by the failure is not
detectable.
9 Very Remote Product is sampled, inspected, and released based on Acceptable Quality
Level (AQL) sampling plans.
8 Remote Product is accepted based on no defects in a sample.
7 Very Low Product is 100% manually inspected in the process.
6 Low Product is 100% manually inspected using go/no-go or other mistake-proofing
gauges.
5 Moderate Some Statistical Process Control (SPC) is used in the process and product is
final inspected off-line.
4 Moderately High SPC is used and there is immediate reaction to out-of-control conditions.
3 High An effective SPC program is in place with process capabilities (Cpk) greater
than 1.33.
2 Very High All product is 100% automatically inspected.
1 Almost Certain The defect is obvious and there is 100% automatic inspection with regular
calibration and preventive maintenance of the inspection equipment.
40. • 10 Extreme
• Predicted to cause severe impact to quality (Product out of specifications, no
Expert Statement possible)
• 7 High
• Predicted to cause significant impact on quality (Failure to meet specifications,
no Stability data, Expert Statement possible)
• 3 Moderate
• Predicted to cause minor impact on quality (Failure to meet specifications,
Stability data available)
• 1 Low
• Predicted to have no/minor impact on quality of the product (Quality within
specifications)
9/17/2015. 408/27/2016
41. • 8 Regular failures
• Expected to happen regularly
• 4 Repeated failures
• Expected to happen in a low frequency
• 2 Occasional failures
• Expected to happen infrequently
• 1 Unlikely failures
• Unlikely to happen
9/17/2015. 418/27/2016
42. • 4 Normally not detected
• Failure very likely to be overlooked, hence not detected
(no technical solution, no manual control)
• 3 Likely not detected
• Failure may be overseen
(manual control, spot checks)
• 2 Regularly detected
• Failure will normally be detected
(manual control, routine work with statistical control)
• 1 Always detected
• Failure can and will be detected in all cases
(monitoring, technical solution available)
428/27/2016
44. Severity (S)
◦ Link to end product functional failure
◦ Medical Department involvement
Probability (P)
◦ Use historical data
◦ Similar processes products
Detection
◦ Validation studies
◦ Historical data
Drying Process
448/27/2016
45. Rankin
g
Severity (S) Probability (P) Detection (D)
10 Death More than once a day Impossible to detect
9 ↓ 3 – 4 times a day Remote
8 Permanent injury Once a week Very slight
7 ↓ Once a month Slight
6 Temporary injury Once in three month Low
5 ↓ Once in half – one year Medium
4
Reported/
dissatisfied
Once a year Moderately high
3 ↓ Once in 1 – 3 years High
2 Notice/ no report Once in 3 – 5 years Very High
1 ↓
Less than once in 5
years
Virtually certain
Drying Process
9/17/2015. 45
46. Process
Potential Failure
Mode
Potential Cause S P D RPN
1. Set up Contamination Disheveled gown of operator
Insufficient cleaning of
equipment
2. Start
drying
Contamination Damage of inlet-air filter
Degradation of
product
Damage of thermometer
3. Maintain
temperature
Long drying time Unstable supply-air volume
High Loss On Drying
(LOD)
Damage of timer
Low LOD High dew-point
Non-uniformity of
LOD
Uneven temperature
distribution
Drying Process RPN: Risk Priority Number = S*P*D
47. Existing controls: IPC of LOD and degradation product after drying process
Drying Process
Process
Potential Failure
Mode
Potential Cause S P D RPN
1. Set up Contamination Disheveled gown of operator 3 5 8 120
Insufficient cleaning of
equipment
7 2 8 112
2. Start
drying
Contamination Damage of inlet-air filter 7 3 6 126
Degradation of
product
Damage of thermometer 7 3 3 63
3. Maintain
temperature
Long drying time Unstable supply-air volume 2 4 5 40
High LOD Malfunction of timer 2 2 2 8
Low LOD High due-point 3 3 3 27
Non-uniformity of
LOD
Uneven temperature
distribution
3 5 3 45
RPN: Risk Priority Number = S*P*D
48. Take action when RPN is over 100
Take action when severity is over 5
Remaining critical parameters after taking action; further controls required
Drying Process
Process Potential Cause RPN Recommended Action S P D RPN
1. Set up Disheveled gown of
operator
120 Use long gloves and
goggles
3 2 8 48
Insufficient cleaning of
equipment
112 Change cleaning procedure 7 2 4 56
2. Start
drying
Damage of inlet-air filter 126 Change maintenance
period
7 2 6 84
Damage of thermometer 63 Change calibration period 7 2 3 42
3.Maintain
temperature
Unstable supply-air
volume
40 ― 2 4 5 40
Malfunction of timer 8 ― 2 2 2 8
High dew-point 27 ― 3 3 3 27
Uneven temperature
distribution
45 ― 3 5 3 45
RPN: Risk Priority Number = S*P*D
49. Should risks
be assessed?
Are there clear rules
for decision making?
e.g. regulations
Yes
“no RM“
Risk assessment not required
(No flexibility)
Follow procedures
(e.g. Standard Operating Procedures)
Document results,
decisions and actions
CONSIDERATIONS
www.drugregulations.org 49
50. §211.25 Personnel qualifications. ( a)
◦ Each person engaged in the manufacture, processing, packing, or
holding of a drug product shall have education, training, …………..
◦ Training in cGMP shall be conducted by qualified individuals on a
continuing basis and with sufficient frequency ……………..
§211.160 General requirements.
◦ Any deviation from the written specifications, standards, sampling
plans, test procedures, or other laboratory control mechanisms
shall be recorded and justified.
9/17/2015. 508/27/2016
51. §211.192 Production record review.
◦ Any unexplained discrepancy … shall be thoroughly investigated,
….......
◦ The investigation shall extend to other batches …...........
§211.46 Ventilation, air filtration, air heating and cooling.
◦ (d) Air-handling systems for the manufacture, processing, and
packing of penicillin shall be completely separate from those for
other drug products for human use.
9/17/2015. 518/27/2016
52. Should risks
be assessed?
Are there clear rules
for decision making?
e.g. regulations
Yes
“no RM“
Risk assessment not required
(No flexibility)
Follow procedures
(e.g. Standard Operating Procedures)
Document results,
decisions and actions
CONSIDERATIONS
1. What might go wrong?
2. What is the likelihood (probability)
it will go wrong?
3. What are the consequences (severity)?No or
justification needed
Can you answer
the risk assessment
questions?
Yes
“informal RM“
Initiate Risk assessment
(risk identification, analysis & evaluation)
Run risk control
(select appropriate measures)
Agree on a team
(small project)
Select a Risk Management tool
(if appropriate e.g. see ICH Q9 Annex I)
No
“formal RM“
Carry out the
quality risk management process
Document the steps
www.drugregulations.org 52