Download as PDF, PPTX


![Highest level:
What to alarm on?
Domain Specific Language (DSL)
Where a sub-expression:
<sub_expression>
::= <function> '(' <metric> [',' period] ')' <operator> threshold_value ['times' periods]
Example:
<expression>
::= <subexpression> [(and | or) <subexpression>]*
avg(disk.space_used_perc{hostname=compute_node_1}) >= 99
and
count(log.error{hostname=compute_node_1,component=kafka},deterministic) >= 1
function
min
max
sum
avg
count
last](https://image.slidesharecdn.com/foss-omegapresentation-april2018-180423133143/85/Monitor-everything-from-physical-hardware-to-application-functionality-21-320.jpg)
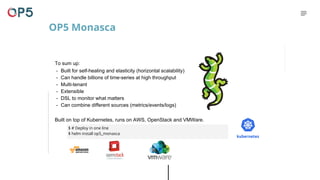

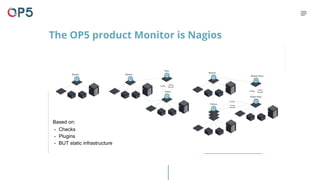
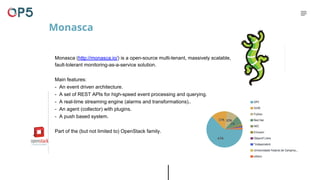
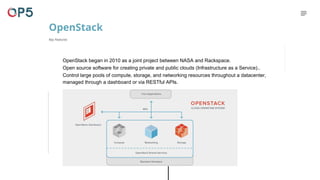
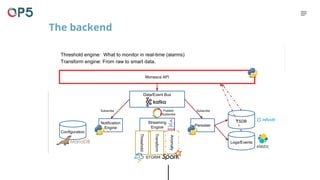
Op5 is a Swedish company specializing in IT monitoring solutions based on open-source technology, specifically Nagios, enabling easy implementation and scalability for clients. Their products, including the Monasca monitoring stack, cater to complex IT environments and can handle billions of time-series data at high throughput. Op5 has expanded its services internationally, enhancing monitoring for businesses in over 60 countries.


