
Recommended
Recommended
More Related Content
What's hot
What's hot (20)
Similar to Overview of how GRACE satellites measure mass changes
Similar to Overview of how GRACE satellites measure mass changes (20)
More from SERC at Carleton College
More from SERC at Carleton College (20)
Overview of how GRACE satellites measure mass changes
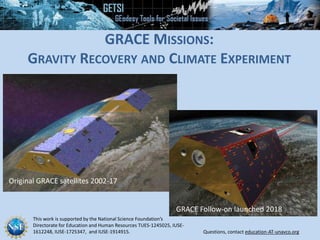
- 1. This work is supported by the National Science Foundation’s Directorate for Education and Human Resources TUES-1245025, IUSE- 1612248, IUSE-1725347, and IUSE-1914915. Questions, contact education-AT-unavco.org Original GRACE satellites 2002-17 GRACE Follow-on launched 2018 GRACE MISSIONS: GRAVITY RECOVERY AND CLIMATE EXPERIMENT
- 2. GRACE MISSION: GRAVITY RECOVERY AND CLIMATE EXPERIMENT • “GRACE consists of two identical spacecraft that fly about 220 kilometers apart in a polar orbit 500 kilometers (310 miles) above Earth. GRACE maps Earth's gravity field by making accurate measurements of the distance between the two satellites, using GPS and a microwave ranging system. It is providing scientists from all over the world with an efficient and cost-effective way to map Earth's gravity field with unprecedented accuracy. • “The gravity variations studied by GRACE include: changes due to surface and deep currents in the ocean; runoff and ground water storage on land masses; exchanges between ice sheets or glaciers and the ocean; …”
- 3. GRACE SATELLITES SENSING GRAVITY CHANGES
- 4. EXAMPLE OF DISTANCE & TOPOGRAPHY RELATIONSHIP
- 5. GRACE DATA CHARACTERISTICS: • 2–6 month latency • Monthly data (some months missing) • Coarse spatial resolution (~100s km) GRACE original mission ran 2002–2017 (5-year expected duration was far outlived, although by late 2016 GRACE was under modified operations to prolong battery life) GRACE Follow-on mission launched May 2018, initially had some issues with onboard equipment, but data flow was expected in 2019.
- 6. Animation of the change available from https://svs.gsfc.nasa.gov/30880
- 7. Animation of the change available from https://svs.gsfc.nasa.gov/30879
- 8. EXAMPLE OF GRACE GROUNDWATER DATA
- 9. GRACE APRIL 2015 ANOMALY FROM 2002 TO 2015 AVERAGE
Editor's Notes
- http://photojournal.jpl.nasa.gov/jpegMod/PIA04235_modest.jpg (public domain) https://gracefo.jpl.nasa.gov/resources/71/grace-fo-mission-brochure/
- From: http://www.nasa.gov/mission_pages/Grace/overview/index.html#.VWcUAmRViko
- https://gracefo.jpl.nasa.gov/resources/71/grace-fo-mission-brochure/ The distance between the satellites provides a way to measure the changing gravity field.
- OPTIONAL https://gracefo.jpl.nasa.gov/news/138/first-laser-light-for-grace-follow-on/ “Along the satellites' ground track (top), the inter-spacecraft distance between them changes as the mass distribution underneath (i.e., from mountains, etc.) varies. The small changes measured by the Laser Ranging Interferometer (middle) agree well with topographic features along the orbit (bottom).” This may be more information that you wish to get into with students but in reality there is a somewhat complex relationship between the distance between the satellites and the underlying topography/gravity with oscillations that need to be converted into a gravity value.
- Note: this color scale runs from -4 to 0.5 meters instead of -3 to 1 meters in Antarctica
- OPTIONAL – if you are interested in showing students that GRACE can also be used to look at groundwater changes, not just ice A decade of GRACE data shows the overall changes in aquifers across the USA. This image gives a sense of the cell size that limits GRACE resolution. Image from: https://earthobservatory.nasa.gov/IOTD/view.php?id=82266 NASA site also includes a related article which instructors could use to bring in more aspects of specific societal challenges from groundwater loss.
- The gravity variations measured by GRACE can be used to determine water storage on land. By comparing current data to an average over time, scientists can generate an anomaly map to see where terrestrial water storage has decreased or increased. This map, created using GRACE data, shows the global terrestrial water storage anomaly in April 2015, relative to the 2002–2015 mean. Rust-colored areas show areas where water has decreased, and areas in blue are where water levels have increased. Note the significant decreases in water storage across most of California are related to groundwater, while decreases along the Alaska coastline are due to glacier melt. https://gracefo.jpl.nasa.gov/resources/71/grace-fo-mission-brochure/