Download to read offline
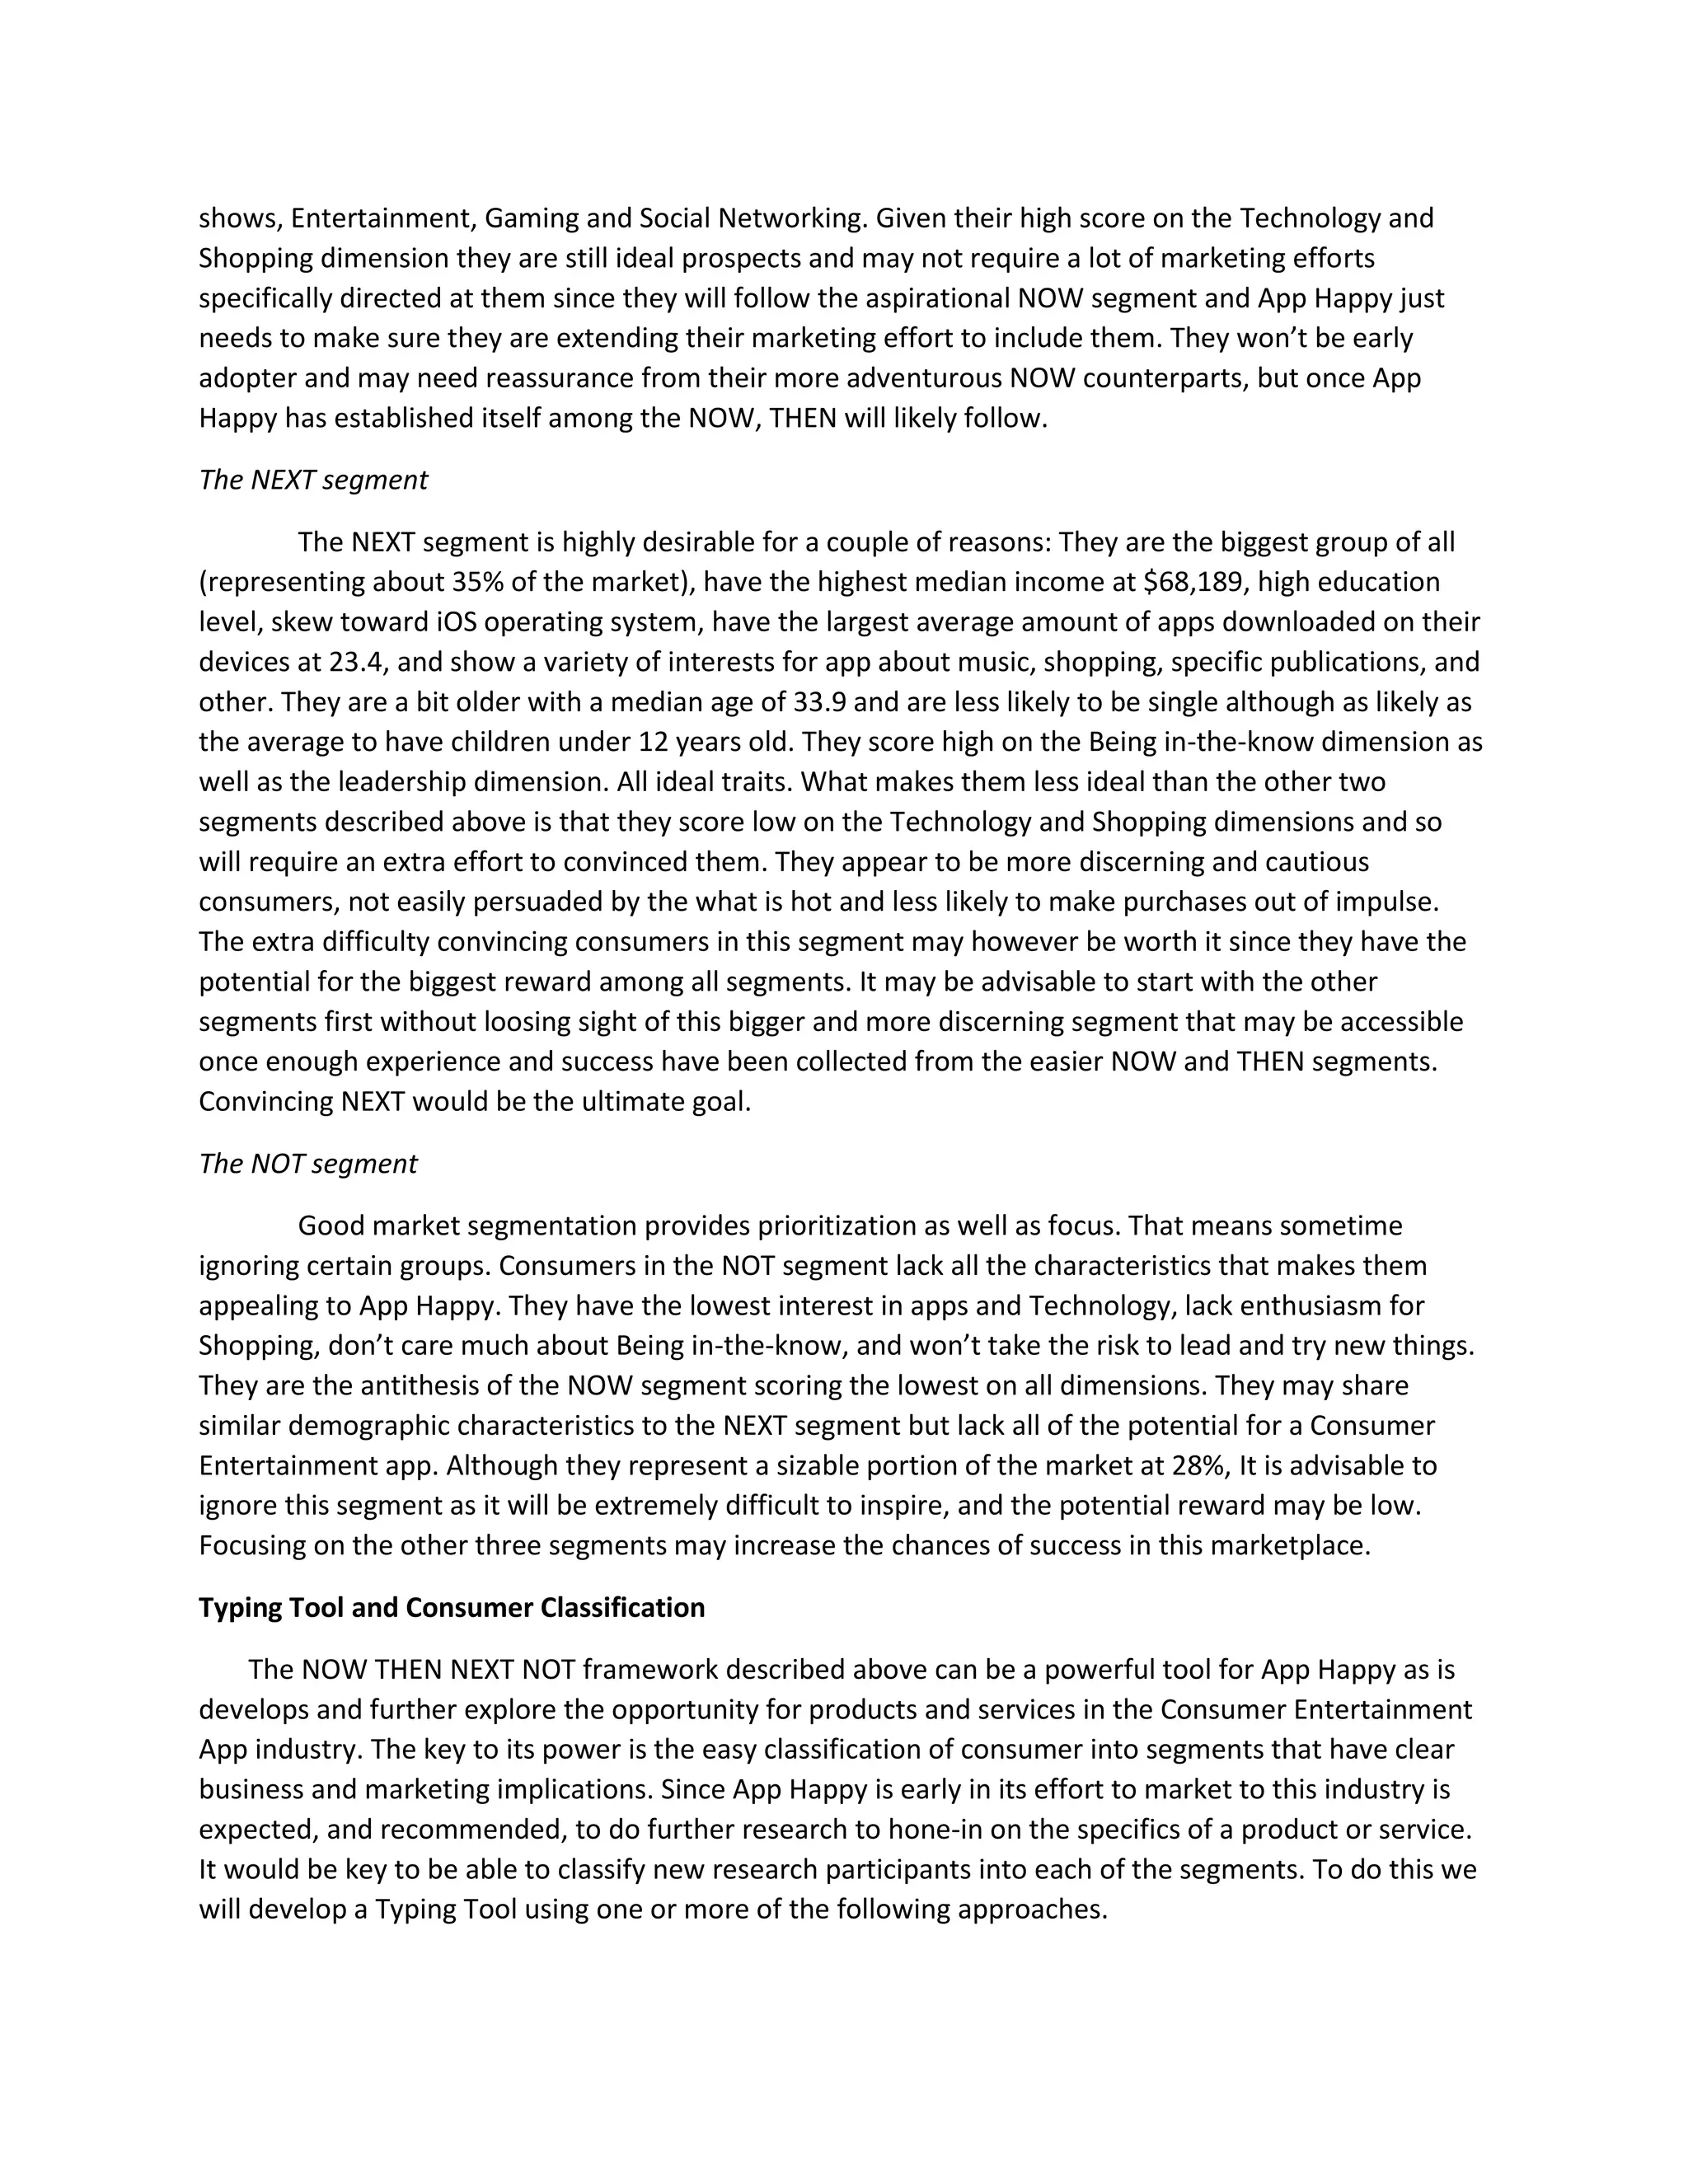
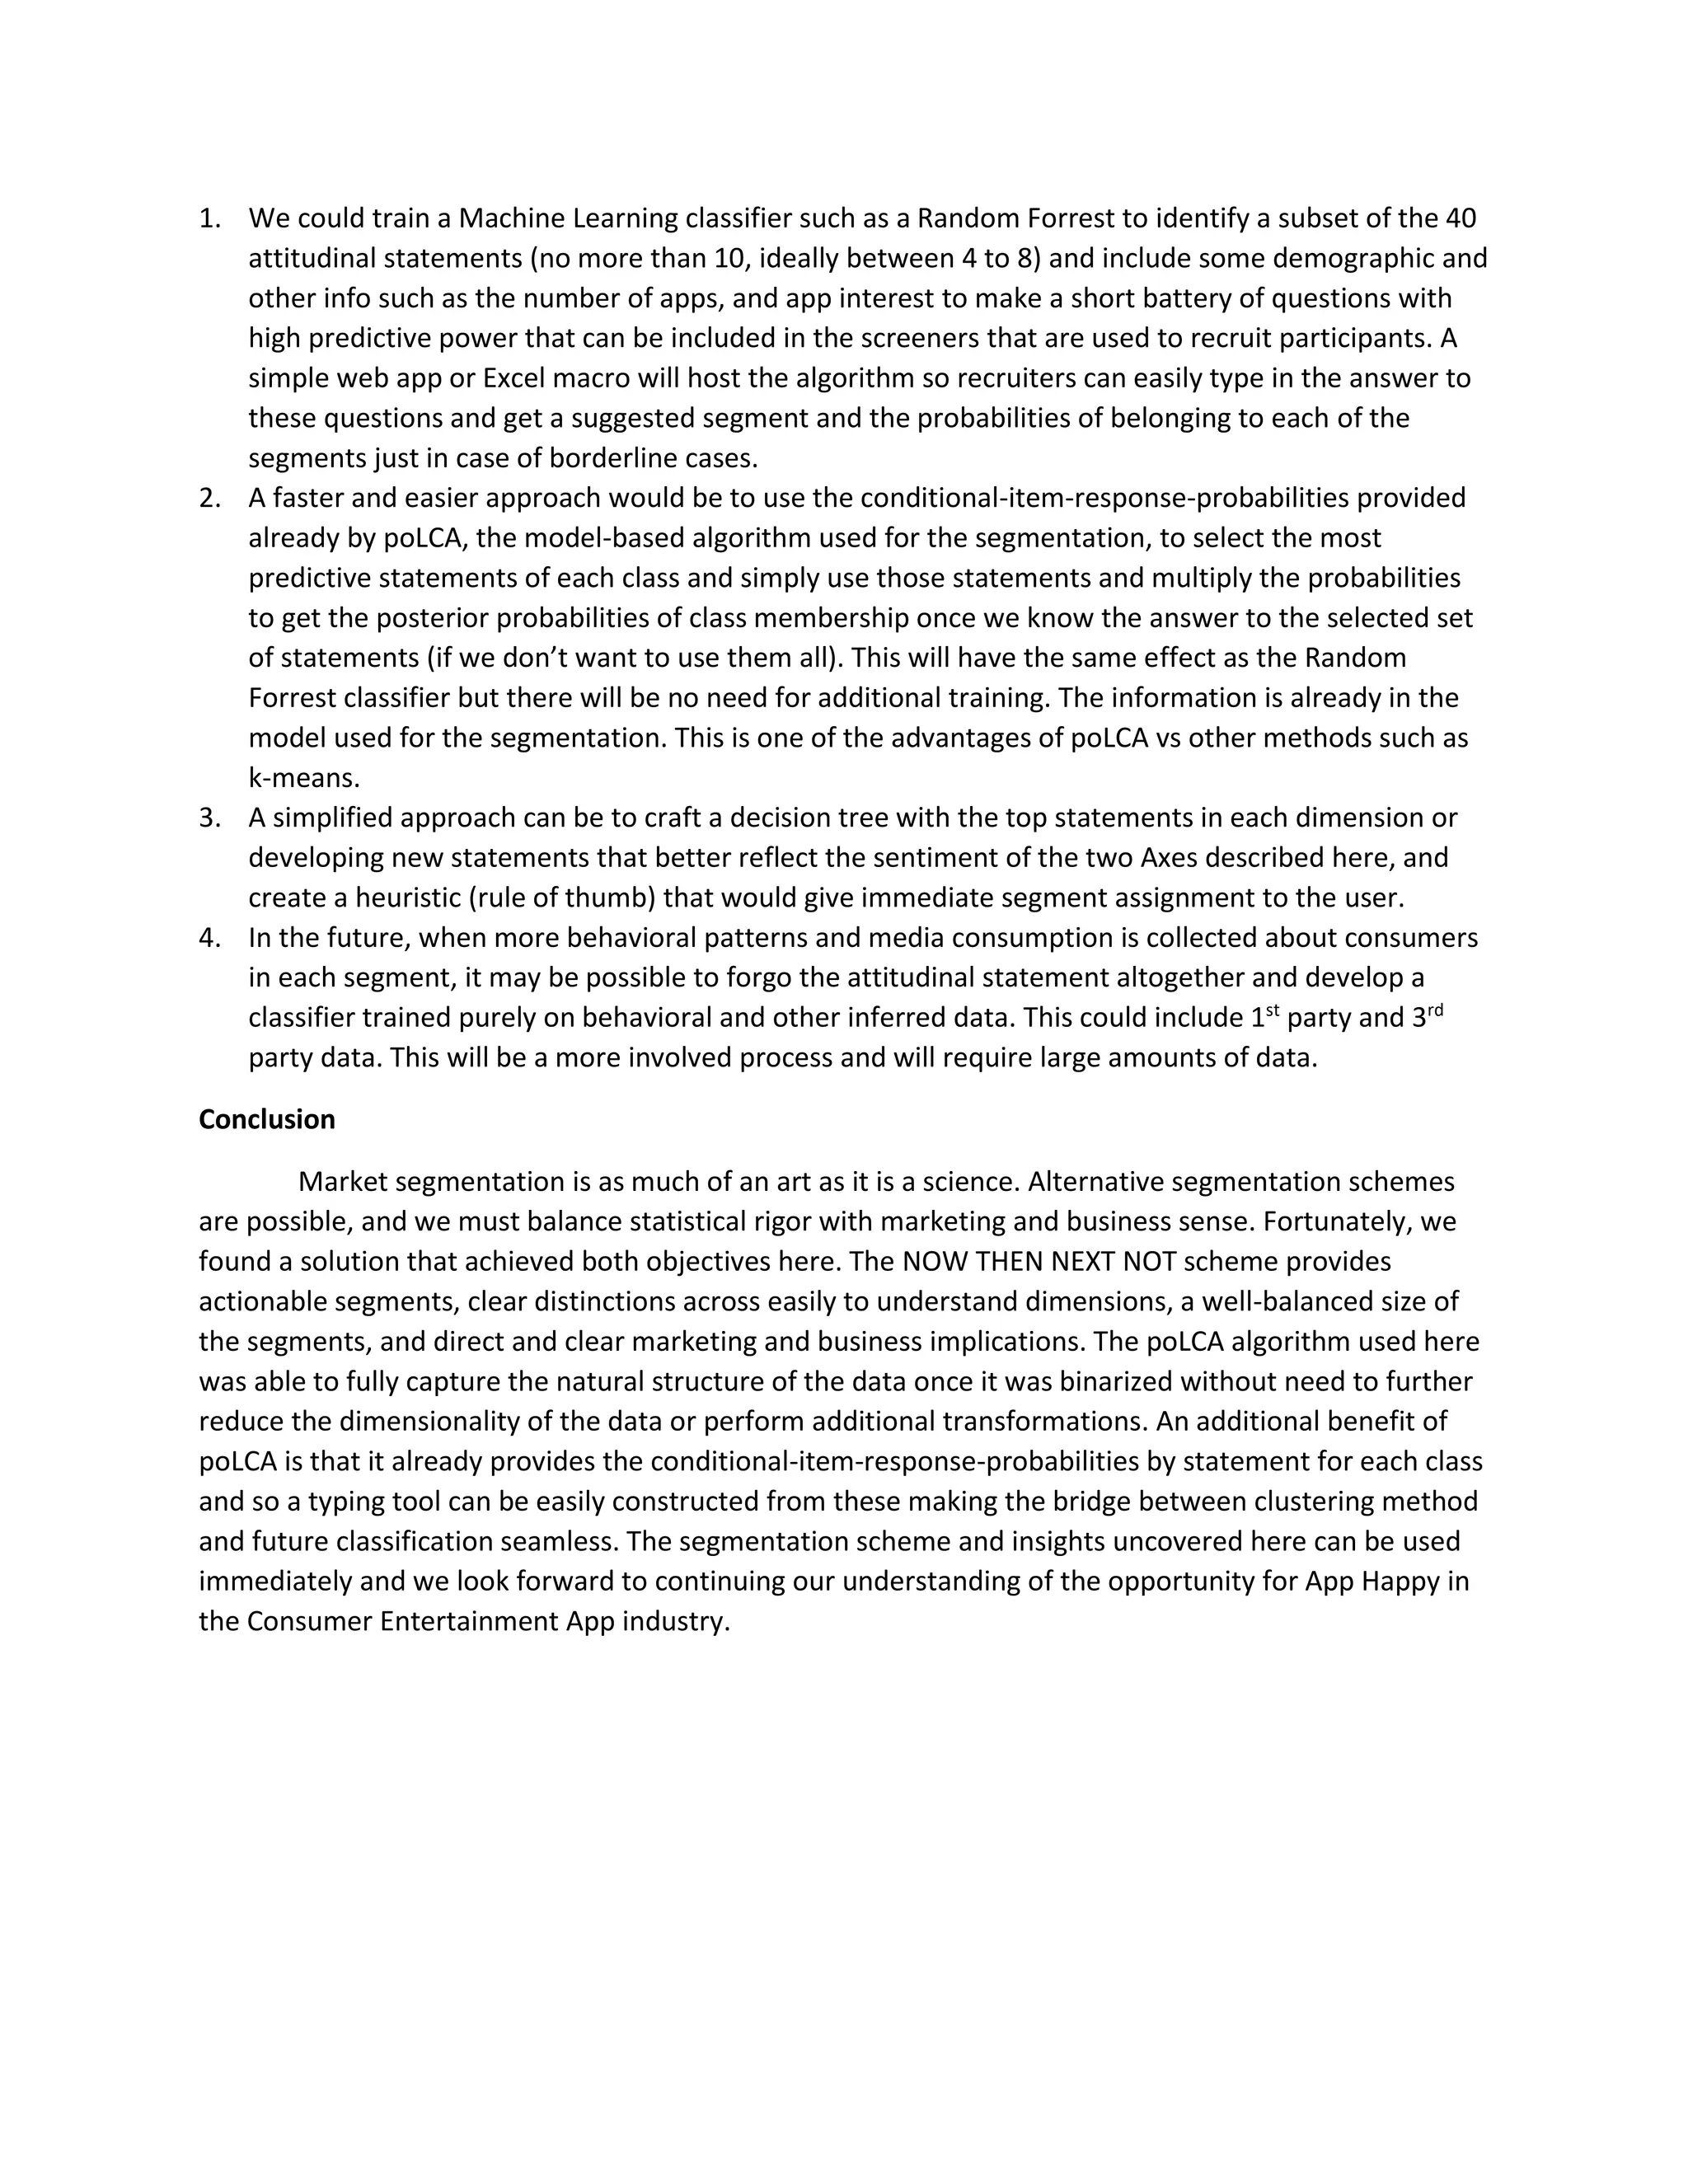

The report outlines a market segmentation analysis for 'App Happy', focusing on consumer attitudes towards technology and shopping based on survey data from 1,800 respondents. Four distinct market segments—Now, Then, Next, and Not—were identified, with actionable insights on their preferences and likelihood to engage with App Happy products. The analysis employed Bayesian statistics and highlighted the importance of focusing on the most desirable segments to maximize marketing effectiveness.


![J[a175]0418300420 1500-maketing report rev](https://cdn.slidesharecdn.com/ss_thumbnails/ja1750418300420-1500-maketingreportrev-190420173040-thumbnail.jpg?width=640&height=640&fit=bounds)


![[DSC Europe 25] Vid Stimac - Policy Parsimony: Between Oversimplifying and Ov...](https://cdn.slidesharecdn.com/ss_thumbnails/eqlepagzqp2rhg3gbluh-dsc-stimac-251120-251205090438-059e7f54-thumbnail.jpg?width=640&height=640&fit=bounds)
![[DSC Europe 25] Jim Sterne - Adopting Generative AI Capabilities Into the Ent...](https://cdn.slidesharecdn.com/ss_thumbnails/sxhpofuorcagxsaulkmt-3-251204082258-7e66bc48-thumbnail.jpg?width=640&height=640&fit=bounds)


![[DSC Europe 25] Petar Zivanov - AI meets documents From chatbots to AI-powere...](https://cdn.slidesharecdn.com/ss_thumbnails/xer2bb6nrdc8pdpev0pc-8-251204082258-7c2fa4a1-thumbnail.jpg?width=640&height=640&fit=bounds)


![[DSC Europe 25] Dragana Ilic - AI for Big Data in Astronomy.pptx](https://cdn.slidesharecdn.com/ss_thumbnails/8palya86qaatvjhva1ms-2-dragana-ilic-ai-ilic-251208151906-652b819c-thumbnail.jpg?width=640&height=640&fit=bounds)