

Recommended
More Related Content
What's hot
What's hot (19)
Similar to Chanakya
Similar to Chanakya (20)
Recently uploaded
Recently uploaded (20)
Chanakya
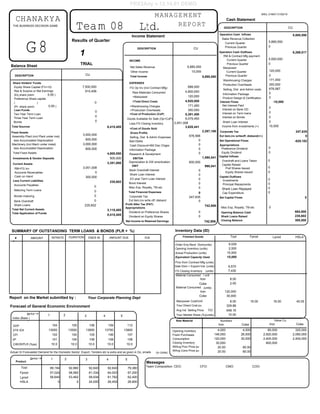
- 1. # AMOUNT INTRATE DURATION ENDS IN AMOUNT DUE SUMMARY OF OUTSTANDING TERM LOANS & BONDS (PLR + %) EQI Team Composition: CEO: CFO: CMO: COO: 8 1 Team 08 Ltd. DESCRIPTION Sales Revenue Collection Current Quarter Previous Quarter Operation Cash Outflows RM & Contract Mfg payment Current Quarter Previous Quarter Manpower Current Quarter Previous Quarter Warehousing Charges Production Overheads Selling, Dist and Admin costs Information Package Product Design & Certification Income from Investments (+) Interest on Bank OD Interest on Term loans Interest on Bonds Principal Repayments Corporate Tax Pref Shares Issued Equity Shares Issued Opening Balance Cash Shark Loans Raised Closing Balance Cap Expenditure 5,885,550 0 5,000,000 0 120,000 0 171,450 676,567 0 300,000 10,000 0 0 0 247,635 0 0 0 0 0 0 0 235,602 300,000 0 Investments 0 Shark Loan Interest 0 0 Ext item,inv writeoff, disband(+/-) 0 DESCRIPTION INCOME Net Sales Revenue Other Income Total Income FG Op Inv (incl Contract Mfg) Raw Materials Consumed +Manpower +Warehousing Charges +Production Overheads Goods Available for Sale (Op+CoP) =Total Direct Costs Depreciation & GW amortization =Cost of Production (CoP) Less FG Closing Inventory =Cost of Goods Sold Gross Profits Selling, Dist & Admin Expenses Bank Overdraft Interest Shark Loan Interest 2/3 year Term Loan Interest Bond Interest Total Financial Expenses Ext item,Inv write off, disband Corporate Tax Dividend on Preference Shares Dividend on Equity Shares Net Income to Retained Earnings 5,885,550 10,000 688,000 4,800,000 120,000 4,920,000 171,450 300,000 5,391,450 6,079,450 2,451,008 3,628,441 2,267,108 676,566 0 0 0 0 0 0 0 247,635 0 0 742,906 Research & Develpment 5,895,550 Bad Debts 0 Cash Discount+Bill Disc Chges 0 Information Package 0 Cash Statement Income Statement DESCRIPTION Share Holders' Funds Equity Share Capital (FV=10) Res & Surplus or Ret Earnings (Eq share prem: Preference Share capital ( (Pr. share prem: Loan Funds Two Year Term Loan Three Year Term Loan Bonds Total Sources Fixed Assets Assembly Plant (incl Plant under inst) less Accumulated Depreciation Machinery (incl Mach under instal) less Accumulated Depreciation Total Fixed Assets Investments & Vendor Deposits Current Assets RM+FG Inv Accounts Receivables Cash on Hand Less Current Liabilities Accounts Payables Total Net Current Assets Total Application of Funds Maturing Term Loans Bank Overdraft Shark Loans 500,000 0 3,051,008 300,000 3,351,008 3,000,000 600,000 3,000,000 600,000 4,800,000 8,415,405 0 0 235,602 0 235,602 0 0 0 0 7,500,000 915,406 Bonds maturing 0 8,415,405 3,115,405 Balance Sheet Messages Results of Quarter THE BUSINESS DECISION GAME MANAGEMENT REPORT 0.00 ) 0.00 ) EXPENSES Appropriations Interest Flows Appropriations Preference Dividend Equity Dividend Capital Raised Finished Goods Opening Inventory (units) Actual Production (units) Material Consumed Avg Ind Selling Price FG Closing Inventory Order Enq Recd Dom(units) Your Direct Cost pu Material Consumed Manpower Cost/Unit / unit 9,029 2,000 15,000 9,570 7,430 8.00 8.00 16.00 16.00 40.00 329.88 648.16 2.00 120,000 30,000 Your Market Share (%)(units) 10.00 (units) Inventory Data (ID) Raw Material Opening Inventory Fresh Purchases Consumption Closing Inventory WtAvg Proc Price pu WAvg Cons Price pu 4,000 4,000 146,000 26,000 120,000 30,000 30,000 20.00 80.00 80,000 320,000 2,920,000 2,080,000 2,400,000 2,400,000 600,000 Forecast of General Economic Environment Index (Base ) 104 106 109 13000 13500 13650 13750 102 104 105 106 101 104 106 108 10.0 10.0 10.0 10.0 99,194 92,880 92,640 92,640 Qrtr-> 1 2 3 4 5 112 13800 107 108 10.0 79,380 GDP STK IDX CPI IIP CIBOR/PLR (%pa) Report on the Market submitted by : Product Qrtr-> 1 2 3 4 5 Actual Or Forecasted Demand for the Domestic Sector; Export, Tenders etc is extra and as given in Gz, emails 57,024 58,560 61,334 64,003 67,200 56,640 53,462 58,934 61,762 62,400 0 0 24,000 26,400 28,800 Your Corporate Planning Dept ) Sale Dom + Export+Var Misc Exp, Royalty, TM etc 0 Misc Exp, Royalty, TM etc 0 Net Interest Paid -10,000 Capital Inflows Overdraft and Loans Taken Capital Outflows Operation Cash Inflows Net Operational Flows 5,885,550 6,268,017 -620,102 Net Capital Flows 0 Profit After Tax (PAT) 742,906 Shark Loan Repayed Tool Fprod Lprod HSLA Tool Fprod Lprod HSLA Iron Coke Numbers Iron Coke Value Cu. G Iron Coke Iron Coke MSIL-31MAY 31/05/19 (in Units) TRIAL (units) (units) CHANAKYA CU CU CU CU Proc from Contract Mfg (units) 20.00 80.00 1,590,541 EBIT 990,541 600,000 15,000Equivalent Capacity Used EBITDA 684,500 105 FRX2Any v.12.14.01 DEMO
- 2. Plant Capacity (for next qtr) Machine Capacity (for next qtr) Average Manpower Cost Net Income Margin 15000 15000 8.00 0.10 0.1430 1.1688 17.40 0.1025 0.1025 Team 00 Team 01 Team 02 Team 03 15000 15000 8.00 0.07 0.1329 0.7894 13.29 0.0716 0.0716 15000 15000 8.00 0.09 0.1384 1.0577 16.19 0.0937 0.0937 15000 15000 8.00 0.09 0.1042 0.7331 12.67 0.0669 0.0669 20.23 32.08 Days Sales Outstanding Winning Criterion Prod Dev /Sales S & D & Info Pack Cost/Sales 0.11 0.14 0.11 0.12 0.42 0.43 0.60 0.42 0.10 0.06 0.09 0.09 29,612 50,000 20,000 1Issued at the end of Quarter No: Industry Wide Inventory Levels (Information Package # 9 - Price Cu.25,000) Equity Share Price on Stk Exc Market Share Data (Information Package # 8 - Price Cu.125,000) Efficiency and Activity Ratios ((Information Package # 7 - Price Cu.40,000) 600 700 624 585 Sales/Total Assets 0.72 0.54 0.68 0.64 Current Ratio 1.00 1.00 1.00 1.00 1.05 1.06 1.06 0.86 0.00 Company Name 15000 15000 13.26 Team 04 8.00 0.1316 0.7869 0.0714 0.0714 1.00 31.32 0.14 0.50 0.54 0.07 0.07 698 1.06 8 15000 15000 8.16 Team 05 8.00 0.0728 0.3163 0.0300 0.0300 1.00 74.94 0.63 0.41 0.05 0.04 790 1.06 Team 06 Team 07 15000 15000 17.87 15000 15000 17.13 8.00 0.1381 1.2125 0.1060 0.1060 1.00 8.00 0.1275 1.1444 0.1006 0.1006 1.00 4.87 0.10 0.48 0.77 0.10 0.47 0.79 0.11 0.11 580 1.06 0.11 0.12 560 1.02 Sector Update Market Share (Rs Sales) Avg Price / Unit Sale/Ord Enq Avg Price / Unit Sale/Ord Enq Fprod Avg Price / Unit Sale/Ord Enq Lprod Avg Price / Unit Sale/Ord Enq HSLA Tool Fprod Lprod HSLA Iron Coke MSIL-31MAY 31/05/19Team No: G Tool Key Performance Data (Information Package # 6 - Price Cu.50,000) 0.18 Team 08 15000 15000 15.47 Team 09 15000 15000 14.18 8.00 0.1260 14.22 0.9905 0.0883 0.0859 1.00 8.00 0.1385 0.8718 0.0785 0.0785 1.00 60.79 0.11 0.81 0.68 13.16 0.13 0.41 0.57 0.10 0.10 615 1.06 0.08 0.07 683 1.06 Mkt Share % units Mkt Share % units Price Quotation CUMPAT(000 00) ( ) TRIAL Debt to Equity Ratio Collection in Curr Qtr/Sales Return on Investment Return on Equity Earnings Per Share Material Cost/Sales Financial Cost/Sales FG Inventory Holding Days Asset List (no Charge) Machine # Capacity (units) Remaining Life (qtrs) 1 15000 8" " Team 10 15000 15000 7.27 8.00 0.0559 7.02 0.2345 0.0224 0.0213 1.00 140.02 0.18 1.02 0.38 0.05 0.04 800 1.06 10.491 7.645 9.657 7.222 7.626 4.097 10.818 10.308 8.977 8.263 3.166 Contract Sales (no charge) Tool Qty Awarded Fprod Lprod HSLA Price Quotation Qty Awarded Price Quotation Qty Awarded Price Quotation Qty Awarded Plant # Capacity (units) Remaining Life (qtrs) 1 15000 8 Plant Capacity thru Productivity Gains Machine Capacity thru Productivity Gains Team 11 15000 15000 9.95 5.336 0.0687 0.4815 0.0450 0.0450 1.00 8.00 0.12 0.46 0.65 0.10 543 0.76 0.09 2 7 4 9 8 Winner11 3 5 6 12 10 Ranking FRX2Any v.12.14.01 DEMO