2. Delivered by Publishing Technology to: Sankar Basu
IP: 116.193.141.16 On: Thu, 19 Dec 2013 19:57:45
Copyright: American Scientific Publishers
COMMUNICATION
Basu and Bhattacharyya polDNAmelt: Local Melting Within Polymeric DNA—An Improved Method and Its Applications
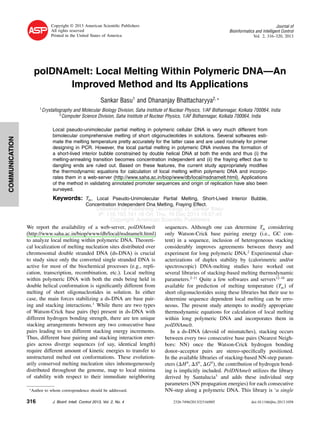
Fig. 1. Pictorial representation of the model: ‘local pseudo-unimolecular melting in natural nucleic acid polymers.’ (A) Concentration independent
two-state local melting within polymeric DNA. (B) Concentration dependent template-primer melting-annealing transition during PCR and other similar
molecular biology experiments.
set of unified parameters’ applicable for both oligomeric
and polymeric melting and had fairly good agreements with
several previous experimental sets.2 4 5 8 10–12
In this study, internal sequences, focused by a virtual
window in turn, are essentially non-fragmented patches
of a contiguous stretch of ds-DNA (Fig. 1(A)). Precisely,
all window sequences (including those at 5 and 3 ends)
are internal (irrespective of its size) within a polymer
i.e., the (whole) input sequence is treated as either cir-
cular or flanked by ds-DNA at either end. Having open
ended termini at either end, linear single strands are pro-
duced from comprehensive melting of oligomeric duplexes
(Fig. 1(B)) whereas local melting within a nucleic acid
polymer yields a ‘short-lived interior bubble’ since the
melting domain is constrained at both ends.17 18
It follows
that, when two linear complementary single strands anneal
to form an oligomeric duplex, they need to overcome an
initiation penalty barrier due to unstacked dangling ends
whereas in case of annealing of the locally melted inte-
rior bubble within a polymer, there is no such entropic
barrier to overcome. Thus, initiation penalties were disre-
garded all throughout, in polDNAmelt. Again, the net free
energy change ( G0
37 of annealing for melted out self-
complementary sequences into ds-duplex is corrected with
a sequence independent entropic (C2) symmetry-penalty
term ( G0
37(sym) = +0 43 kcal·mol−1
.3
Tertiary interactions are a weaker second order effect in
case of polymeric DNA and to an excellent approximation
they could be neglected.19
That is to say, a partially melted
polymeric DNA should prefer a pseudo-unimolecular ds-
duplex which is thermodynamically more stable than
any alternative unimolecular secondary structures with
unstacked and unpaired bases at or near each internal loop.
Moreover, since the melting domain is clamped from either
ends, any possible alternative secondary structure (e.g.,
hairpins, cruciforms etc.) will only be kinetically trapped
at or near a local minima which will eventually dissolve
while annealing upon thermodynamic equilibration. In this
view, dynamic programming algorithms for secondary
structure prediction in DNA (UNAFold20
, OMP21
etc.) also
neglect kinetically trapped (local minima) structures and
assume that structures are populated according to an equi-
librium Boltzmann distribution.19
This essentially leads to
a two-state approximation of the melting-annealing transi-
tion. In case of oligomers, there would always be compe-
tition among strands to anneal to the same complementary
sequence (Fig. 1(B)) giving rise to a concentration depen-
dent two-state Tm.22
Tm =
H0
S0 +R·ln CT /x
(1)
where CT is the total strand concentration, H0
and S0
are the transition enthalpy and transition entropy respec-
tively and x = 4 for non-self complementary and x = 1 for
self complementary associations.
However, in case of partial melting within a poly-
mer, an internal sequence can either remain in its locally
melted (LM) or duplex (D) conformation at equilib-
rium (Fig. 1(A)). The concentration dependence is there-
fore extraneous. Consequently, following principles of
two-state pseudo-unimolecular equilibrium, Tm should be
concentration independent.
LM ⇔ D Keq =
D
LM
At T = Tm, i.e., at half denaturation,
LM = D
therefore, Keq = 1
=⇒ H0
−T S0
= −R·T · ln 1 = 0
Thus Tm =
H0
S0
(2)
Annealing accompanies compaction resulting in sub-
stantial decrease in the molecular volume of a ds-DNA.
Thus ds-DNA has a greater negative-charge density
than ss-DNA, and hence, upon denaturation, releases
J. Bioinf. Intell. Control 2, 316–320, 2013 317
3. Delivered by Publishing Technology to: Sankar Basu
IP: 116.193.141.16 On: Thu, 19 Dec 2013 19:57:45
Copyright: American Scientific Publishers
COMMUNICATION
polDNAmelt: Local Melting Within Polymeric DNA—An Improved Method and Its Applications Basu and Bhattacharyya
thermodynamically bound counterions. The equilibrium
thermodynamic parameters ( H0
, S0
, G0
derived by
Santalucia,3
however, apply only to nucleic acids dissolved
in 1 (M) NaCl at pH 7.0.4
Therefore, in attempt to imitate
an apparent in-vivo environment, where the monovalent
counterion (Mon+
concentration is much less (∼0.05 →
0 165 (M)) and also divalent Mg+2
is present at differ-
ent concentrations among cells (∼ 0 005 → 0 03 (M)),
these parameters were salt corrected according to the latest
literature.23–25
To test whether the method could actually discrimi-
nate between oligomeric and local polymeric DNA melt-
ing, a 20 bp small genomic sequence from the E.coli
sakai strain was chosen which resides at the centre of the
experimentally validated 232 bp long origin of replication
O15726
and Tm was calculated twice,
(i) when the sequence was implanted at the center of the
232 bp long origin, undergoing local melting and
(ii) when taken in isolation (oligomer).
Different DNA concentrations starting from cellular levels
to regular experimental values were fed.
Genomic DNA is highly concentrated in-vivo (of the
order of 1 (M)) which is about 103
to 1012
fold higher
in comparison to what is normally used in in-vitro exper-
imental assays with oligomeric DNA (e.g., PCR). Also,
oligomeric melting should have fraying effect (due to dan-
gling ends) unlike local polymeric melting. Thus, initiation
penalties were taken into account for the former. Tm of the
local unimolecular melting event in the polymer, (calcu-
lated by Eq. (3)) was only slightly higher than that of the
concentration dependent melting of the oligomer (Eq. (2))
at highly concentrated near cellular level (CT ∼ 1–4 (M))
where the concentration term (ln CT /4 ) contributed only
marginally to the denominator compared to the entropic
term, S0
(in cal/mol/K). On the other hand, at gradually
decreased concentrations (10−3
to 10−12
(M)), the concen-
tration term being more and more pronounced resulted in
markedly decreased Tm values (Table I).
The method could also be used to predict melting origins
in annotated sequences. Both plasmids and genomic DNA
were tested. The window size was taken to be 20 bp since
Table I. Table of comparison between the concentration dependent melting of a 20 bp long test oligomer (sense strand sequence: 5 -
AGGATCATTAACTGTGAATT-3 ) and its concentration independent melting (first row in the table, in bold) when considered to be an internal sequence,
embedded at the centre of the following 232 bp long, experimentally characterized origin of replication O157 from the E coli sakai strain.
Type of H0
×1000 S0
Salt corrected S0
at Tm ( C) = H0
/ S0
+
melting event CT (M) Ln (CT /4) (cal/mol) (cal/mol/K) 0.165 (M) [Mon+
] S0
+ln CT /4) ln CT /4 −273 15)
Local polymeric Not applicable Not applicable −150.9 −426.6 −440.524 Not applicable 69.39
Oligomeric 1.0 −1 39 −146 3 −418 2 −432 34 −433 73 64 15
Oligomeric 2.0 −0 693 −146 3 −418 2 −432 34 −433 03 64 7
Oligomeric 3.0 −0 29 −146 3 −418 2 −432 34 −432 63 65 01
Oligomeric 4.0 0 −146 3 −418 2 −432 34 −432 34 65 24
Oligomeric 10−3
−8 295 −146 3 −418 2 −432 34 −440 64 58 87
Oligomeric 10−6
−15 21 −146 3 −418 2 −432 34 −447 55 53 74
Oligomeric 10−9
−22 11 −146 3 −418 2 −432 34 −454 45 48 71
Oligomeric 10−12
−29 02 −146 3 −418 2 −432 34 −463 36 42 58
Fig. 2. Tm plot for PLPR0006. The annotated promoter (bp position
−200 to 0, central bp position: −100) was detected at a single local
minima (central bp position: −100) at the larger 100 bp scan window
(plotted in blue) and the same region was detected to span across 3 local
minima at the smaller 20 bp scan window (plotted in black).
such a length is preferred as the binding motif of melting
associated DNA binding proteins.27
Notably, the ‘two-state
approximation’ should work better for smaller sequences.
Both, origins of replication, and promoter elements were
tested for the presence of local minima of stability. Pro-
moter (and their flanking sequences) were collected from
a plant promoter database.28
For example, the candidate
promoter, tagged ‘PLPR0006 AC: AF190297 OS’ of
Arabidopsis thaliana, gene TT1 picked up from bp posi-
tion −200 to +51 (transcription start site: +1) was
appended with its 1000 bp upstream and downstream
sequences, which were mapped by local alignment of the
query sequence against the non-redundant whole Arabidop-
sis genome using NCBI-BLAST.29
Calculations were per-
formed for both the default 20 bp and also the larger
100 bp window lengths. As expected, the promoter element
(represented by the central bp position: −100) mapped to a
single local minima for the larger (100 bp) window length
and the same region (bp position: −200 to 0) was found to
traverse across two local minima (centered at bp position
−100 and at −160) at the smaller (20 bp) window length
(Fig. 2). Thus, by gradually shortening the scan window,
318 J. Bioinf. Intell. Control 2, 316–320, 2013
4. Delivered by Publishing Technology to: Sankar Basu
IP: 116.193.141.16 On: Thu, 19 Dec 2013 19:57:45
Copyright: American Scientific Publishers
COMMUNICATION
Basu and Bhattacharyya polDNAmelt: Local Melting Within Polymeric DNA—An Improved Method and Its Applications
Fig. 3. Tm plot for pGPS5. The annotated origin of replication was detected (bp position 369–678, central bp position: 524) to map to the global
minima at the suggested 309 bp scan window (plotted in blue) which was found to be split into two highly unstable patches (central bp position: 450,
490) at the smaller 20 bp scan window (plotted in black).
it is possible to pinpoint to the actual low melting patches
which may serve for the plausible melting nucleation site(s)
within a fairly long annotated melting origin.
Commercially available plasmid sequences (Cloning
Vectors) with well-characterized origins of replication
were also considered for sample calculations.30
Origins
were found to map to one or more local minima of sta-
bility in most cases, flanked by relatively stable stretches
at either end. They were also detected at the ‘global min-
ima’ however, somewhat less frequently. Such a case was
in the plasmid pGPS5, the 309 bp long annotated origin
(bp position 369–678) mapped to the global minima of
stability (central bp position: 524) against the suggested,
large (309 bp) scan window (Fig. 3) and when further sub-
scanned with the smaller default 20 bp window, two highly
unstable local patches (central bp position: 450, 490) were
detected at near-upstream to the center of the annotated
origin separated by a rather stable sequence in between
(centered at bp position: 470).
PolDNAmelt was developed in Perl (version 5.8.8) using
its Common Gateway Interface (cgi). The user interface
has been set to an array consisting of the compulsory
input argument, 5 → 3 sense strand sequence and several
other optional arguments namely the choice of thermody-
namic parameters (Santalucia3
or Breasler5
), window size
(in bp), overlap size (in bp), solution temperature (in C)
and counterion concentrations of [Na+
], [K+
], [NH+
4 ] and
[Mg+2
] (in mols · lit−1
. Defaults have been set for all
optional arguments (choice of thermodynamic parameters:
Santalucia,3
window size: 20 bp, overlap size: zero, solu-
tion temperature: 37 C, [Na+
]: 0.015 (M), [K+
]: 0.15 (M),
[NH+
4 ]: 0 adding up to a total monovalent counterion con-
centration [Mon+
] of 0.165 (M) and [Mg+2
]: 0.01 (M))
in order to produce a suggested output if the sequence
alone is submitted. It is to be noted that [Mon+
] should be
between 0.05 and 1.1 (M) (since in this range H0
does
not require a salt correction3
) or else the value is force-
fully readjusted to the nearest cutoff. The ‘Overlap’ feature
is provided in order to average out the discrete Tm data
and also to take care of every possible consecutive stretch
individually as potential local minima.
References and Notes
1. P. Yakovchuk, E. Protozanova, and D. Frank-Kamenetskii, Base-
stacking and base-pairing contributions into thermal stability of the
DNA double helix. Nucleic Acids Res. 34, 564 (2006).
2. A. V. Vologodskii, B. R. Amirikyan, Y. L. Lyubchenko, and M. D.
Frank-Kamenetskii, Allowance for heterogeneous stacking in the
DNA helix-coil transition theory. J. Biomol. Struct. Dyn. 2, 131
(1984).
3. J. Santalucia, Jr, A unified view of polymer, dumbbell, and oligonu-
cleotide DNA nearest-neighbor thermodynamics. Proc. Natl. Acid.
Sci., USA 95, 1460 (1998).
4. H. T. Allawi and J. Santalucia, Jr, Thermodynamics and NMR of
internal G-T mismatches in DNA. Biochemistry 36, 10581 (1997).
5. K. J. Breslauer, R. Frank, H. Blocker, and L. A. Marky, Predicting
DNA duplex stability from the base sequence. Proc. Natl. Acid. Sci.,
USA 83, 3746 (1986).
6. S. G. Delcourt and R. D. Blake, Stacking energies in DNA. J. Biol.
Chem 266, 15160 (1991).
7. M. J. Doktycz, R. F. Goldstein, T. M. Paner, F. J. Gallo, and A. S.
Benight, Studies of DNA dumbbells I: Melting curves of 17 DNA
dumbbells with different duplex stem sequences linked by T4 end-
loops evaluation of the nearest-neighbor stacking interactions in
DNA. Biopolymers 32, 849 (1992).
8. O. Gotoh and Y. Tagashira, Locations of frequently opening regions
on natural DNAs and their relation to functional loci. Biopolymers
20, 1033 (1981).
9. H. Kuhn and D. Frank-Kametskii, Labeling of unique sequences in
double-stranded DNA at sites of vicinal nicks generated by nicking
endonucleases. Nucleic Acids Res. 36, e40 (2008).
J. Bioinf. Intell. Control 2, 316–320, 2013 319
5. Delivered by Publishing Technology to: Sankar Basu
IP: 116.193.141.16 On: Thu, 19 Dec 2013 19:57:45
Copyright: American Scientific Publishers
COMMUNICATION
polDNAmelt: Local Melting Within Polymeric DNA—An Improved Method and Its Applications Basu and Bhattacharyya
10. J. Santalucia, Jr, H. T. Allawi, and P. A. Seneviratne, Improved
nearest-neighbor parameters for predicting DNA duplex stability.
Biochemistry 35, 3555 (1996).
11. N. Sugimoto, S. Nakano, M. Yoneyama, and K. Honda, Improved
thermodynamic parameters and helix initiation factor to predict sta-
bility of DNA duplexes. Nucleic Acids Res. 24, 4501 (1996).
12. R. D. Blake, J. W. Bizzaro, J. D. Blake, G. R. Day, S. G. Delcourt,
J. Knowles, K. A. Marx, and J. Santalucia, Jr, Statistical mechanical
simulation of polymeric DNA melting with MELTSIM. Bioinformat-
ics 15, 370 (1999).
13. N. R. Markham and M. Zuker, DINAMelt web server for nucleic
acid melting prediction. Nucleic Acids Res. 33, W577 (2005).
14. Primer3: http://frodo.wi.mit.edu/primer3.
15. CLC Bio: http://www.clcbio.com/index.php?id = 493.
16. PREMIER Biosoft: http://www.premierbiosoft.com/crm/jsp/com/pbi/
crm/clientside/ProductList.jsp.
17. R. Owczarzy, P. M. Vallone, R. F. Goldstein, and A. S. Benight,
Studies of DNA dumbbells VII: Evaluation of the next nearest-
neighbor sequence-dependent interactions in duplex DNA. Biopoly-
mers 52, 29 (1999).
18. N. Sugimoto, R. Kierzek, and D. H. Turner, Sequence dependence
for the energetics of dangling ends and terminal mismatches in
ribonucleic acid. Biochemistry 26, 4554 (1987).
19. J. SantaLucia, Jr and D. Hicks, The thermodynamics of DNA struc-
tural motifs. Annu. Rev. Biophys. Biomol. Struct 33, 415 (2004).
20. UNA Fold: http://mfold.rna.albany.edu/.
21. OMP: http://www.dnasoftware.com/VisualOMP/tabid/108/Default.
aspx.
22. L. A. Marky and K. J. Breslauer, Calculating thermodynamic data
for transitions of any molecularity from equilibrium melting curves.
Biopolymers 26, 1601 (1987).
23. R. Owczarzy, B. G. Moreira, Y. You, M. A. Behlke, and J. A. Walder,
Predicting stability of DNA duplexes in solutions containing mag-
nesium and monovalent cations. Biochemistry 47, 5336 (2008).
24. J. G. Wetmur and J. Fresco, DNA Probes: Applications of the prin-
ciples of nucleic acid hybridization. Crit. Rev. BioChem. Mol. Bio.
26, 227 (1991).
25. J. Marmur and P. Doty, Determination of the base composition of
deoxyribonucleic acid from its thermal denaturation temperature.
J. Mol. Biol. 5, 109 (1962).
26. NCBI: http://www.ncbi.nlm.nih.gov/sites/entrez?Db = genome&
Cmd = ShowDetailView&TermToSearch = 169.
27. S. Jones, P. van Heyningen, H. M. Berman, and J. M. Thornton,
Protein-DNA interactions: A structural analysis. J. Mol. Biol. 287,
877 (1999).
28. Bioinformatics Web Server: http://mendel.cs.rhul.ac.uk/mendel.php?
topic = plantprom.
29. BLAST: http://blast.ncbi.nlm.nih.gov/Blast.cgi.
30. New England Biolabs: http://www.neb.com/nebecomm/tech_
reference/restriction_enzymes/dna_sequences_maps.asp.
Received: 10 August 2013. Accepted: 3 September 2013.
320 J. Bioinf. Intell. Control 2, 316–320, 2013