Me 8
•Download as DOCX, PDF•
0 likes•344 views

The break-even analysis determines the volume of sales at which revenues and costs are equal, known as the break-even point. The break-even point can be calculated in terms of either physical units or money value of sales. It is the level of sales where total revenues equal total costs, resulting in no profit or loss. The margin of safety is the amount of sales over the break-even point, indicating how much sales can decrease before the firm loses money. Break-even analysis is useful for profit planning, capacity expansion decisions, and determining whether to make or buy a product.

Recommended
More Related Content
What's hot
What's hot (18)
Viewers also liked
Viewers also liked (10)
Similar to Me 8
Similar to Me 8 (20)
More from Sagar Kothurwar
Me 8
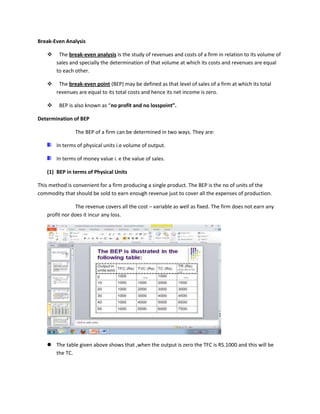
- 1. Break-Even Analysis The break-even analysis is the study of revenues and costs of a firm in relation to its volume of sales and specially the determination of that volume at which its costs and revenues are equal to each other. The break-even point (BEP) may be defined as that level of sales of a firm at which its total revenues are equal to its total costs and hence its net income is zero. BEP is also known as “no profit and no losspoint”. Determination of BEP The BEP of a firm can be determined in two ways. They are: In terms of physical units i.e volume of output. In terms of money value i. e the value of sales. (1) BEP in terms of Physical Units This method is convenient for a firm producing a single product. The BEP is the no of units of the commodity that should be sold to earn enough revenue just to cover all the expenses of production. The revenue covers all the cost – variable as well as fixed. The firm does not earn any profit nor does it incur any loss. The table given above shows that ,when the output is zero the TFC is RS.1000 and this will be the TC.
- 2. When the output is 10 units, the TC consisting of TFC is Rs.1000 and TVC is Rs.1000,is totally Rs.2000. The TR is Rs.1500,since the price is Rs.150/- unit the firm incurs a loss of Rs.500 at this point. When the output is 20 units, the TC is Rs.3000 and the TR is also Rs.3000 and hence TR = TC. At this level the firm is working at a point where there is no profit and no loss. This is called the BEP. From this level of output the firm starts earning profit. Alternative method to find out BEP in terms of Physical units There is another method of finding out BEP in terms of physical units of output. This is by means of formula. We adopt AR and AVC instead of TR and TC. The BEP is that level of output at which the price of the product (AR) covers the AC. The price should be sufficient to cover not only the AVC but also some portion of AC. The excess of selling price over AVC goes towards meeting some portion of the FC. The excess is called contribution margin.
- 3. BEP = TFC Contribution margin per unit Where contribution margin = selling price – average variable cost CM = SP – AVC Therefore , BEP = TFC SP – AVC Example: Suppose the TFC of a firm is Rs.10000 per annum. The variable cost per unit i.e. AVC is Rs.6 and the selling price is Rs.10 per unit. Find the BEP in terms of physical units. BEP = 10000 = 2500 units 10 – 6 Thus the company would not make any profit or loss when the output is 2500 units. Verification: Total revenue = 2500 x 10 = Rs.25000 TVC = 2500 x 6 = 15000 TFC = +10000 TC = 25000 So TC = TR. Hence BEP = 2500 units. BEP in terms of Money Value Or Sales Value If a firm is producing many products the BEP has to be approached only in terms of money value of goods sold or total sales revenue. Here also total contribution margin (SP-AVC) would be equal to the TFC. But the contribution margin is expressed as a ratio to sales. This ratio is also known as “profit – volume ratio” or P/V ratio. Contribution ratio = TR –TVC / TR BEP = TFC / CR Ex 1: Total sales = Rs. 3000
- 4. TVC = Rs. 2000 Fixed cost = Rs.1000 CR = 3000 – 2000 / 3000 = 1/3 Now to find out BEP, BEP = TFC = 1000 = Rs. 3000 CR 1/3 TR = Rs. 3000 TFC = Rs. 1000 3000 = TR TVC = RS. 2000 In this way TR of Rs. 3000 = TC of Rs. 3000. Therefore no profit or no loss. EX:2 Given: Total Sales Revenue : Rs 10,000 Total Variable Costs : Rs 6,000 Total Variable Costs : Rs 3,000 Find BEP BEP = TFC/Contribution Ratio(CR) where, CR= TR-TVC/TRCR = 10,000-6,000/10,000 = 2/5 BEP = 3000/2/5 3000*5/2 = 15000/2 = 7500 VERIFY : FOR 10000 TVC Rs 6000 FOR 7500 6000/10000*7500 TVC = 4500 TR =7500 TC= TFC 3000 + TVC 4500 = 7500 HENCE, TR=TC Margin Of Safety (or) Safety Margin That amount of sales which is over and above the break-even sales value is known as margin of safety. Safety Margin = Total sales – sales at BEP MS = TS – BES
- 5. Or MS = NP CR The margin of safety indicates the extent to which the sales may fall before the firm suffer loss. Larger the margin of safety, safer the firm. Illustrations TS = Rs.20,000 BES = 15,000 MS = TS — BES = 20,000 – 15,000 = 5,000 Margin of safety can also be expressed as % of total sales. MS = margin of safety x 100 total sales = 5,000 x 100 20,000 = 25% To find out MS: Total sales = 1,50,000 Variable cost = 75,000 Fixed cost = 50,000 CR = TR – TVC =1,50,000 – 75,000 = 1 TR 1,50,000 2 BES = TFC = 50,000 = 1,00,000 CR ½ MS = TR – BES =1,50,000 – 1,00,000
- 6. = Rs. 50,000 Break–Even Point as a % of Full Capacity The term full capacity means maximum possible volume that can be produced with the firm’s existing capital equipment and operating policies and practices. This is also expressed as % of full capacity. For ex, if the full capacity is 10,000 units and BEP is 4000 units then the BEP can be expressed as 40% of full capacity. Assumptions of Break Even Analysis The quantity produced and sold are equal. The FC remains constant at different levels of output. The VC goes on increasing by a fixed amount. The price per unit remains constant and does not change. The TR goes on increasing proportionately to the output. Managerial Uses of Break-Even Analysis Microscopic View Profit Target Contribution Margin per unit = SP –VC per unit 1= 4-3 Target sales volume = FC + Target profit / Contribution margin per unit = 300 + 200 /1 = 500 units To determine the value of sales to maintain the profit level Safety Margin To expand the production capacity Profit Projections Make or Buy decisions
- 7. Illustration:Given Selling Price : Rs. 10/- each TFC & AVC is Rs 12000 &Rs 4. Should a firm make or buy? BEP = 12000/10 – 4 = 12000/6 = 2000 components If the firms requirements is less than 2000 then it is profitable to buy than to manufacture them