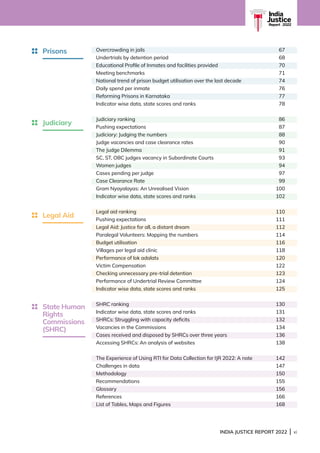
The document provides an overview of the India Justice Report 2022, which ranks states on their capacity to deliver justice across four pillars - police, judiciary, prisons, and legal aid. It assesses each state's structural and financial capacity based on quantitative measurements of budgets, human resources, infrastructure, workload, and diversity over a five-year period. By comparing data trends, it evaluates states' efforts to improve justice delivery and address needs. The report brings together previously siloed data in one place to provide an easy but comprehensive tool for policymakers, and pinpoints specific areas for reform. Its findings are important for governments, civil society, and businesses to inform recommendations for participatory dialogues and consensus-based reforms.
![vi | INDIA JUSTICE REPORT 2022
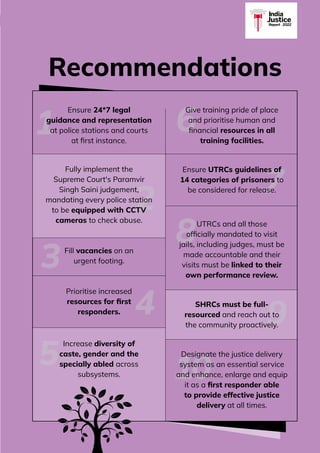
Foreword
I
t is my honour to write this foreword to the 3rd edition
of the India Justice Report. The IJR, as it has come to
be known, is an eagerly awaited assessment of the
capacity of Indian states to deliver justice. It is brought
to us by a collective of dedicated researchers, advocates,
and specialists committed to improving the justice
delivery system. It serves as a valuable resource for active
citizens, the media and most importantly for government
agencies tasked with the onerous responsibility of
delivering justice effectively to all.
By deconstructing the data on budgets, infrastructure,
human resources, workload and by measuring changes
across time in each sub-system in each state and
bringing it all together in one place, the IJR provides us
an important tool for evaluating the delivery of justice
holistically.
In recent times, technology has helped in putting out
more data into the public domain and the report’s
periodic ranking of states’ performance and progress
relies entirely on the government’s own data. This self-
imposed restriction lends authenticity to the report even
as it holds up a mirror to justice delivery mechanisms.
Yet, even while it evidences the value of data as an
objective foundation for analysis it unconsciously brings
out many imperfections that plague analysis based on
government data alone.
One of the attributes of the report is that it consciously
abjures making judgments about performance or even
about why chronic frailties and easy to repair elements
remain unaddressed over decades. It lets the time series
data—such as the slow pace of inclusion of women and
traditionally discriminated segments of society to find a
place within the system—speak for itself. But the truth of
its finding compels early measures to repair.
This third edition of the India Justice Report (IJR) comes
at a time when the need for justice—both in the sense
of accessible dispute resolution and fostering equity and
equality in society—is outpacing the capacity to deliver it
to the satisfaction of our people.
I would like to urge all agencies involved in the justice
system to take heed of the IJR’s findings and insights.
Report like this are a testament to our democratic ways
of participatory functioning and must be welcomed as
contributions of active citizens to their own governance.
[Uday Umesh Lalit]
14 February 2023](https://image.slidesharecdn.com/ijr-2022-full-report-230406040535-672df3b1/85/INDIA-JUSTICE-REPORT-2022-6-320.jpg)


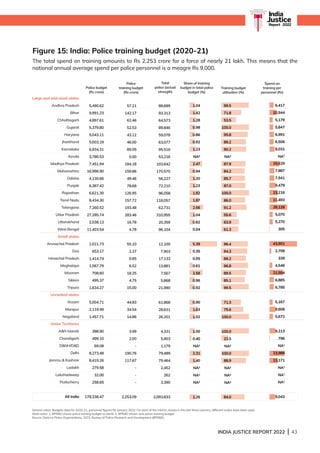
![INDIA JUSTICE REPORT 2022 | 37
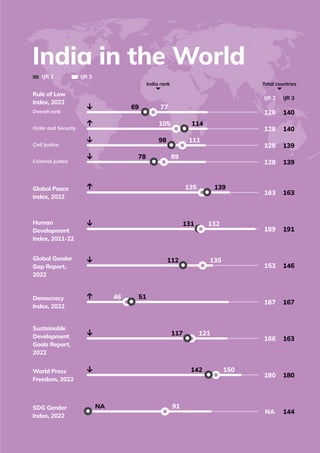
India
Justice
Report | 2022
19 Andhra Pradesh, Uttar Pradesh, Telangana, Madhya Pradesh, Karnataka, Haryana, Gujarat, Sikkim, Tamil Nadu, Himachal Pradesh, Chhattisgarh.
20 From January 2020 to January 2022.
21 PRS legislative research, Police Reforms in India. Available at: https://prsindia.org/policy/analytical-reports/police-reforms-india
22
Janaagraha centre for citizenship and democracy, Manpower Requirement Study, Bangalore City Police, 2014. Available at: https://www.janaagraha.org/files/publications/Manpower-
Requirements-Study-March-2014.pdf
23 Bureau of Police Research Development, Data on Police Organisation, National Requirement of Manpower for 8-hour Shifts in Police Stations; August 2014.
24
Police-per-lakh-of-population ratio (PPR) against the total actual police strength (Civil + DAR + Special Armed + IRB), Data on police organisation, 2022, p. 76.
25 Diversity covers Scheduled Castes, Scheduled Tribes, Other Backward Classes and women.
26 The BPRD data on reservations calculates data for six ranks: ASP/Dy. SP/Asst. Commandant, Inspector/Reserve Inspector, S.I/Reserve Sub-Inspector (RSI),ASI/ARSI, Head Constable, Constable.
27
Office of the Registrar General and Census Commissioner of India, Ministry of Home Affairs, Census of India, 2011. Available at: https://censusindia.gov.in/census.website/data/census-tables
28
NALSA v. Union of India, 2014, ‘[T]he Supreme Court granted legal recognition to transgender and other gender non-conforming persons in. It directed union and state governments to
allow transgender persons to access reservations in public education and employment.’ Available at: https://scobserver-production.s3.amazonaws.com/uploads/case_document/document_
upload/1286/NALSA_v_UoI_WPC_400_2012.pdf
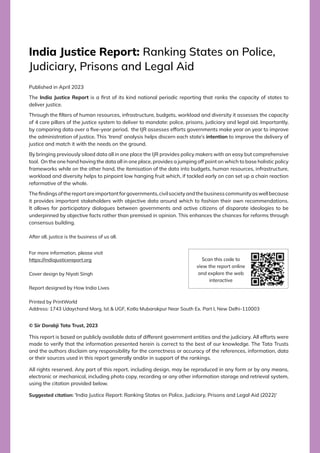
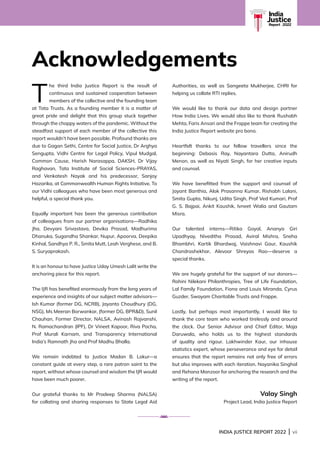
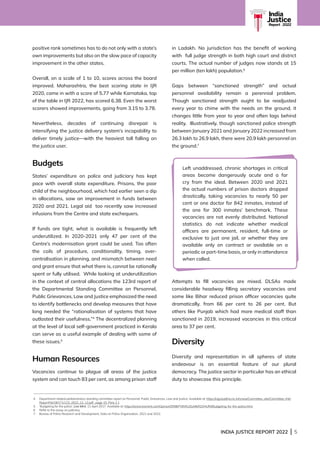
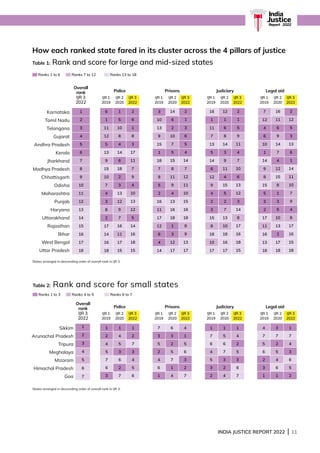
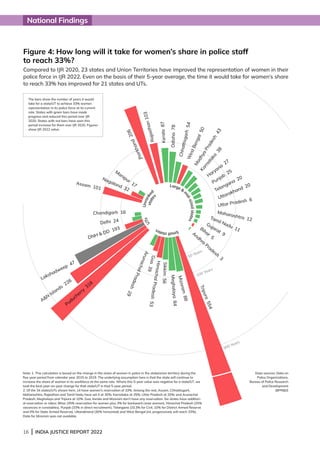
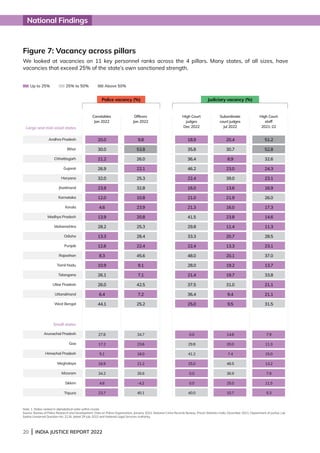
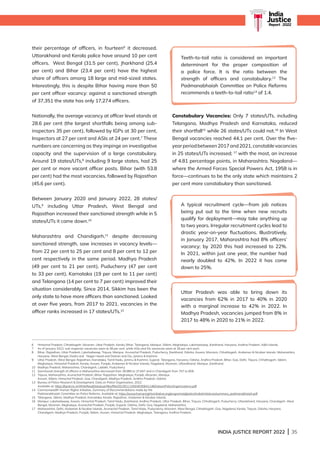
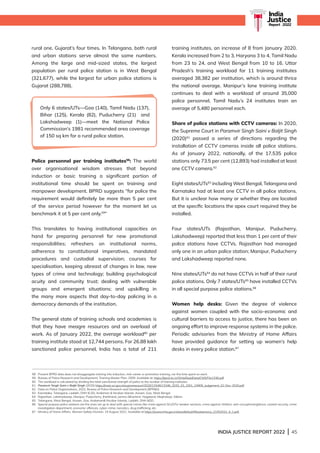
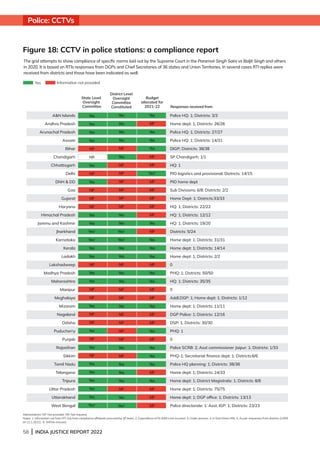
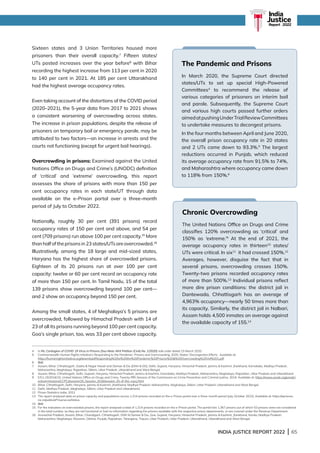
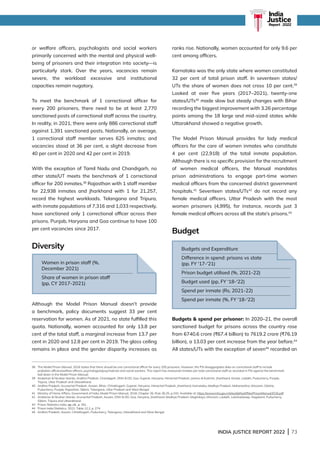
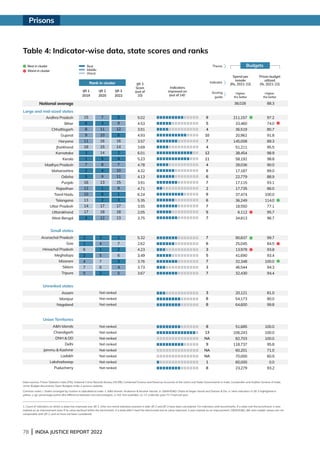
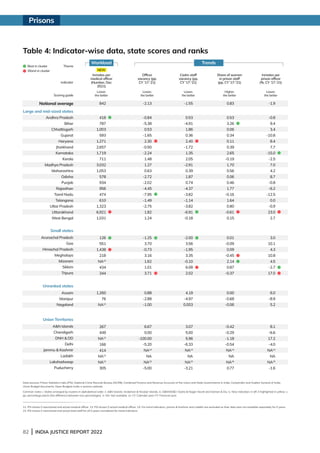
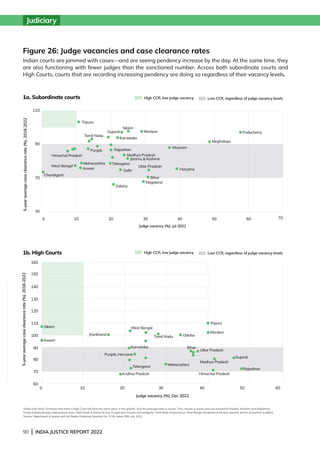
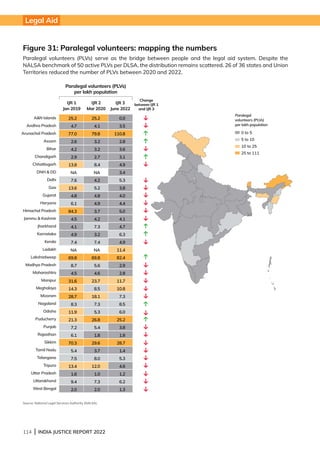
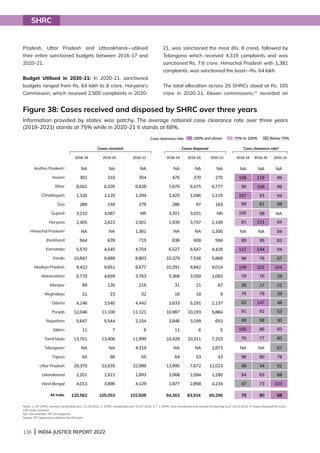
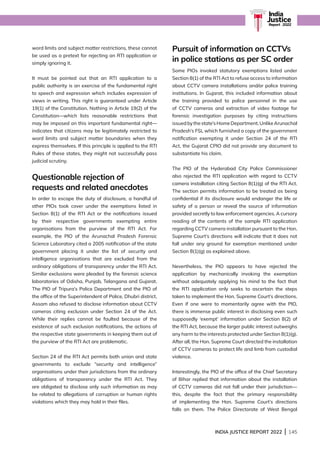
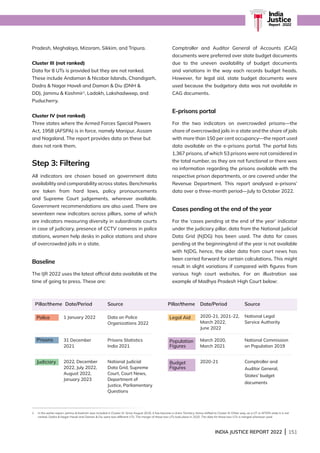
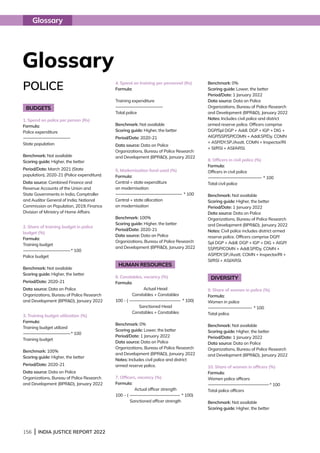
Population/civil police: As of January 2022, there was
one police person available (with civil and district armed
police taken together) to serve 831 people nationwide.
This is a slight improvement from 858 in January 2020.
In 11 states and UTs,19
including Andhra Pradesh and
Uttar Pradesh, the police-to-population ratio decreased
(see box on ‘Other’ to understand this reduction). Punjab
with one for every 500 people has the best ratio while
Bihar’s ratio—worsening by 146—brought the ratio to
one police personnel for every 1,695 people.
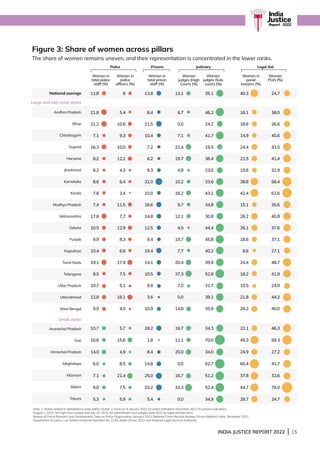
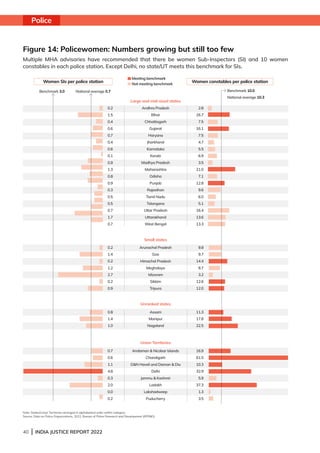
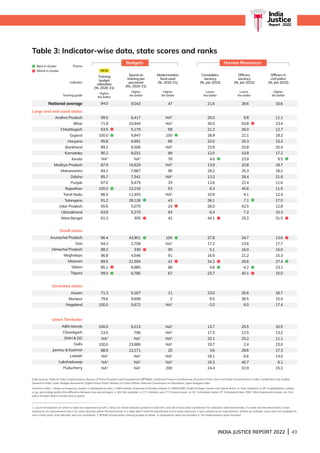
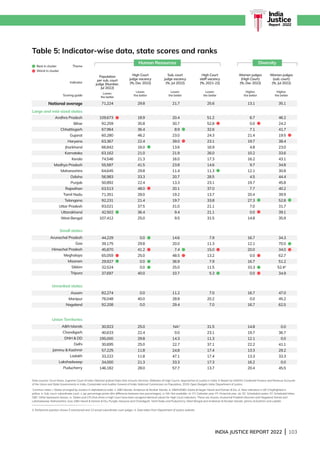
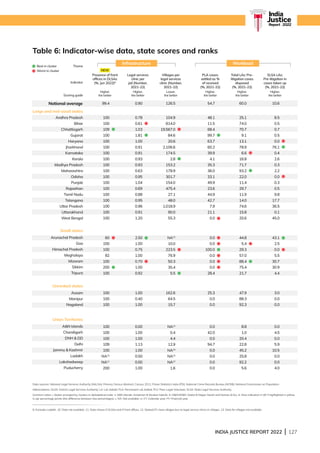
Diversity25
Scheduled Castes, Scheduled Tribes and Other
Backward Classes Reservations26
: Constitutional
equality mandates all states to reserve caste quotas.
The aspiration behind the standard is to repair the gulf in
representation of consistently underrepresented groups
in all spheres—with governments leading the way.
As of January 2022, Scheduled Castes make up 15.99
per cent27
of the total working police strength (against
16 per cent share in population), Scheduled Tribes
11.77 per cent, Other Backward Classes 30.79 per cent
and women 11.75 per cent. Data on representation
of various religious groups remains unavailable since
2014. Following the Supreme Court’s directions,28
police departments have started recruiting transgender
persons, but detailed state-wise data is not yet publicly
available.
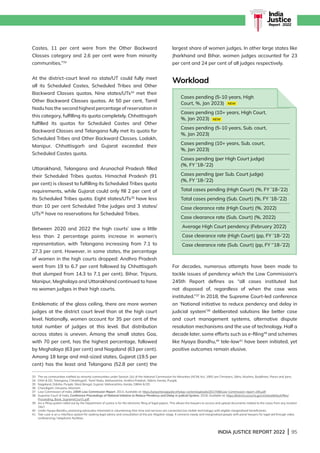
SC officers, actual to reserved ratio
(%, Jan 2022)
SC constables, actual to reserved ratio
(%, Jan 2022)
ST officers, actual to reserved ratio
(%, Jan 2022)
ST constables, actual to reserved ratio
(%, Jan 2022)
OBC officers, actual to reserved ratio
(%, Jan 2022)
OBC constables, actual to reserved ratio
(%, Jan 2022)
Share of women in police (%, Jan 2022)
Share of women in officers (%, Jan 2022)
Women in total police (pp, CY'17-'21)
Women officers in total officers (pp, CY'17-'21)
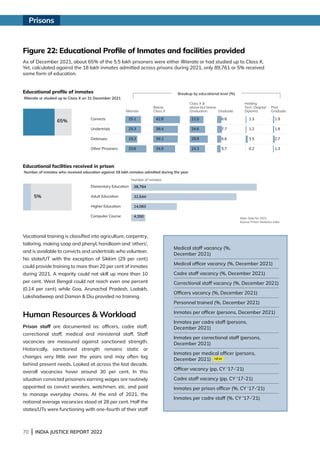
Sanctioned strength
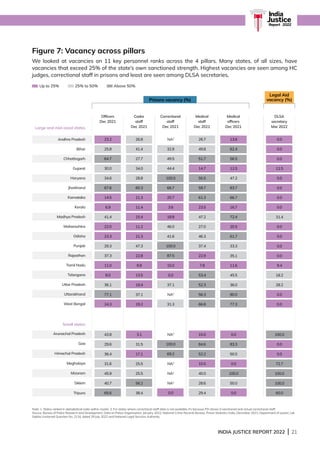
The vexed question of vacancies dogs the
justice system. A reduction in sanctioned
strength can appear to reduce vacancy levels.
Illustratively, over two years20
Kerala reduced
the sanctioned strength of civil police by 239
personnel. Consequently, vacancies appear
to have reduced (from 10% to 8.8%) but
‘workload’ (population-to-police ratio) has
increased (from 773 persons to 776 persons).
Administrations periodically revise
the sanctioned strength, however the
‘ideal’ remains uncertain. The suggested
international standard is 222 per lakh
population.21
Official and civil society studies
at the state and city level have attempted to
set down criteria for determining optimum
human resource requirements that suggest
increases ranging from 457% to 621% over
present strength.22
A 2014 Bureau of Police
Research Development study based on
three shift policing calculated that 61% more
personnel were required.23
From 1982 Kerala
has set a norm of 1SI:1 ASI: 5HC: 25 PC as
the minimum strength of a police station,
but an increase in police stations coupled
with financial constraints pose a challenge
to maintaining this norm make keeping to the
norm a challenge. India—the second most
populous nation in the world—has 152.8
police persons per lakh population.24](https://image.slidesharecdn.com/ijr-2022-full-report-230406040535-672df3b1/85/INDIA-JUSTICE-REPORT-2022-49-320.jpg)


![INDIA JUSTICE REPORT 2022 | 115
India
Justice
Report | 2022
15
Arunachal Pradesh, Bihar, Goa, Haryana, Himachal Pradesh, Jharkhand, Karnataka, Lakshadweep, Madhya Pradesh, Punjab, Rajasthan, Tamil Nadu, Tripura, West Bengal.
16 NALSA’s Paralegal Volunteer Scheme. Available at:
https://nalsa.gov.in/acts-rules/preventive-strategic-legal-services-schemes/scheme-for-para-legal-volunteers
17
Andaman Nicobar Islands, Andhra Pradesh, Assam, Chhattisgarh, Goa, Gujarat, Haryana, Jharkhand, Kerala, Madhya Pradesh, Maharashtra, Manipur, Mizoram, Punjab, Sikkim, Tamil Nadu,
Telangana, Tripura, Uttarakhand and West Bengal.
18
Figures for Andaman Nicobar Islands, Kerala and Lakshadweep as of January 2019.
19
This figure is from the India Justice Report, 2020 and does not include data from Kerala, West Bengal, Andaman Nicobar Islands (not ranked), Lakshadweep (not ranked) as the report repeated
figures from March 2017 due to unavailability of data from these states.
20 Ibid.
21 National Legal Services Authority v. Union of India [Writ Petition (Civil) No. 400 of 2012].
22
Andaman Nicobar Islands, Arunachal Pradesh, DNH DD, Delhi, Goa, Haryana, Jharkhand, Lakshadweep, Ladakh, Meghalaya, Mizoram, Nagaland, Puducherry, Rajasthan, Sikkim, Tripura and
Uttarakhand.
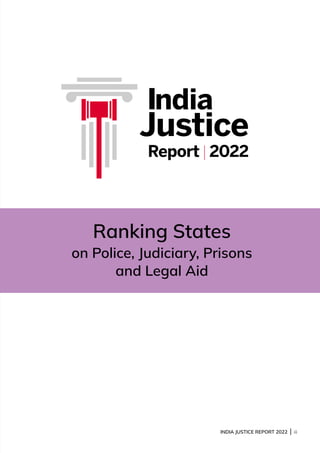
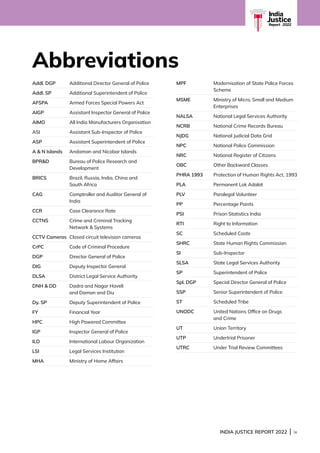
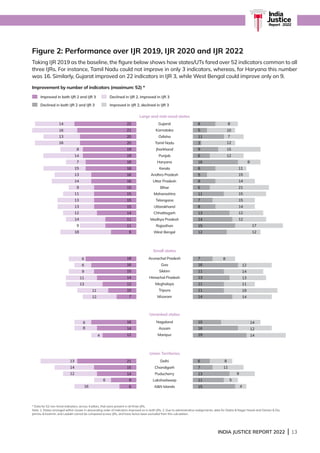
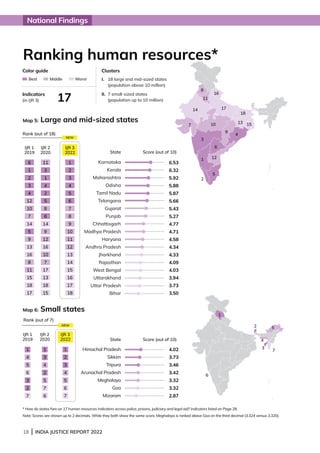
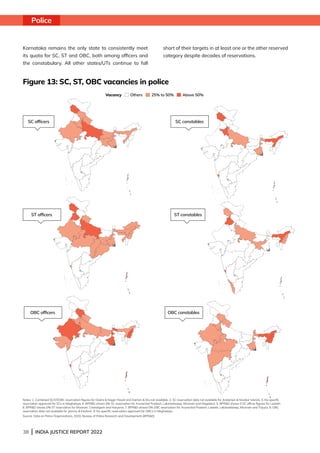
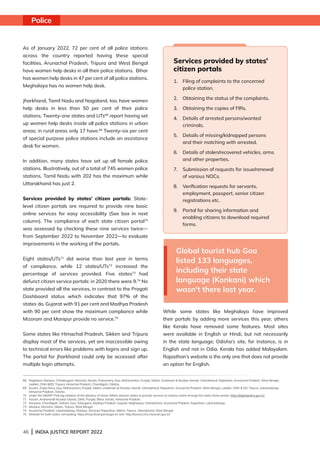
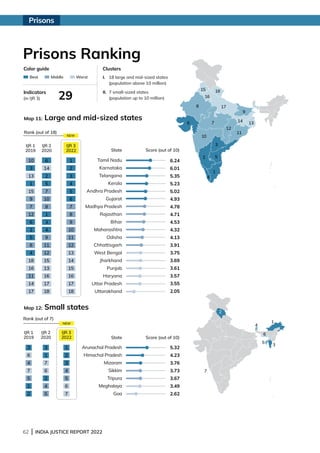
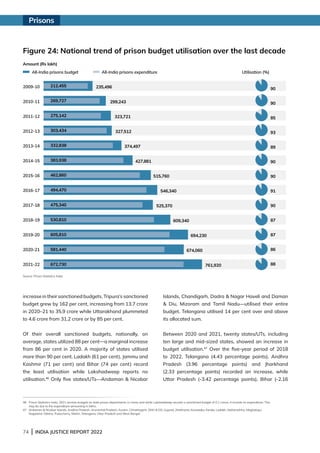
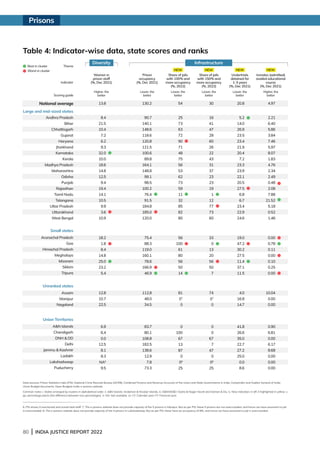
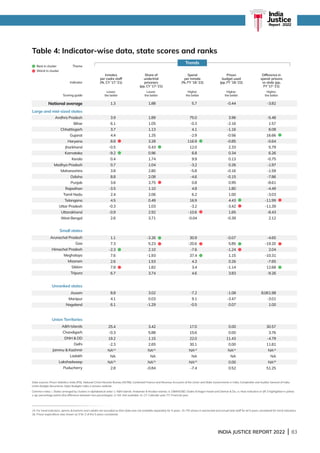
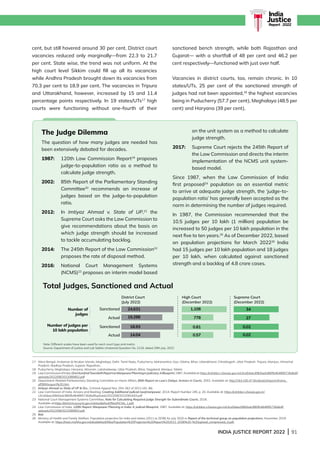
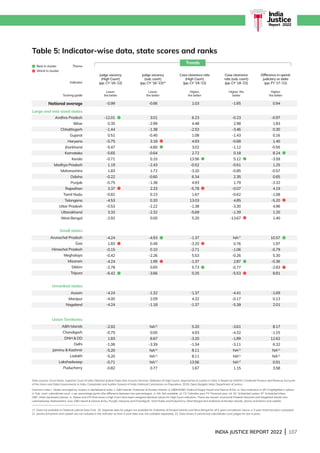
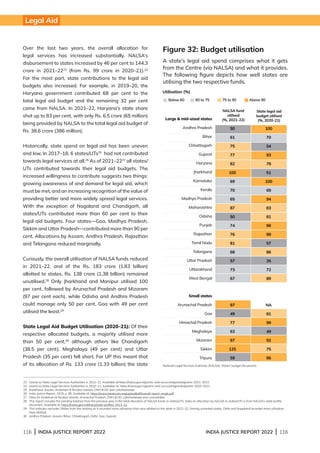
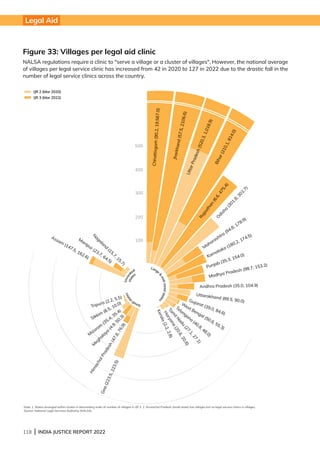
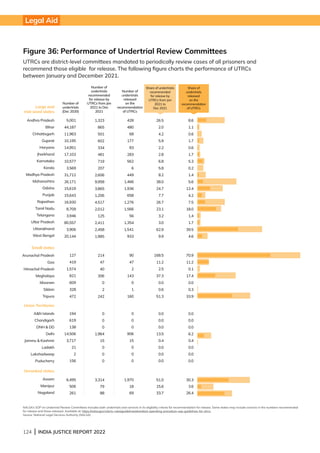
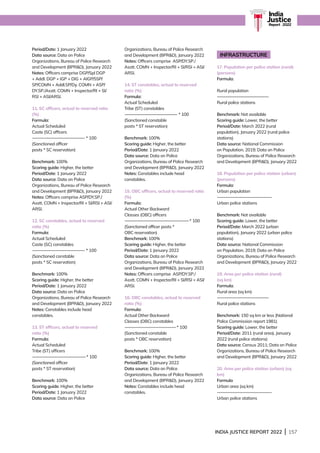
2,405. Fourteen states/UTs15
record a fall in the numbers
of lawyers.
The issue of appropriate numbers is also reflected in the
paralegal volunteer scheme. NALSA suggests 50 active
paralegals in each DLSA.16
However, in 2022 states/
UTs like Bihar (4,446/1,850), Delhi (1,104/550), Gujarat
(2,812/1,600) appointed more PLVs than required, while
others like Goa (59/100), Himachal Pradesh (368/550),
Rajasthan (1,449/1,800) and Uttar Pradesh (2,863/3,550)
appointed fewer than the required numbers. Paralegals
are intended to be embedded community legal resources
responsible for spreading awareness, counselling, and
bridging the distance between community and the
formal legal system. Thirteen years into the PLV scheme,
their potential as agents of legal empowerment remains
only partially realised. Twenty states/UTs reduced their
numbers.17
Nationally, the number of PLVs has dropped
15 per cent,18
from 53,679 in 2020 to 45,636 in 2022.
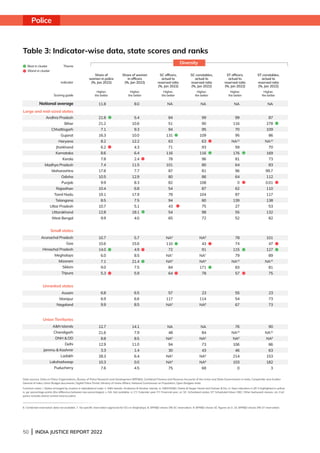
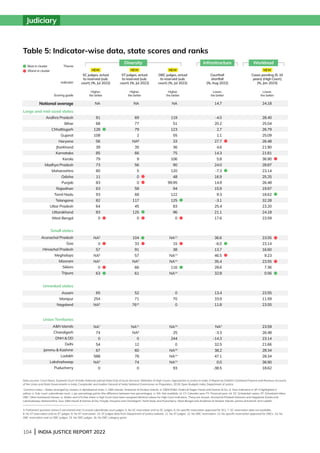
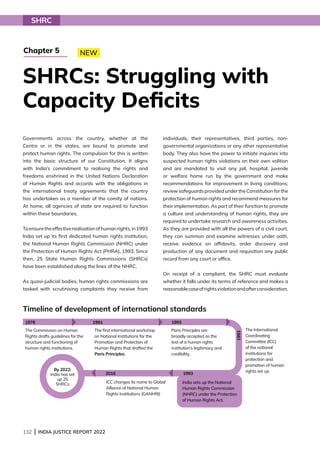
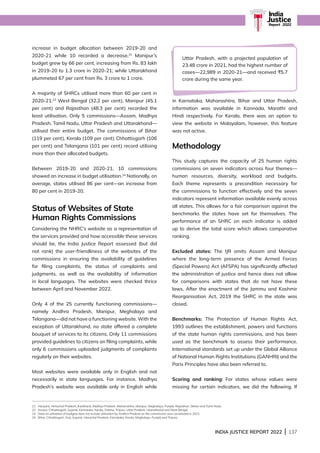
Diversity
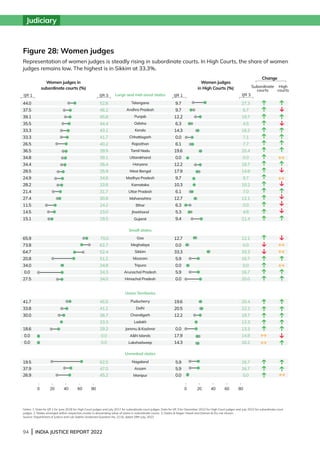
Women panel lawyers: Government services at all
tiers are required to be representative of the population
they serve. Though there continues to be a dearth of
publicly available data in terms of caste composition of
stakeholders across the legal aid system, gender diversity
is captured. Between 2020 and 2022, a majority of
states/UTs increased the share of women panel lawyers.
Nationally, their share increased by 6 percentage points
from 18 per cent19
to 25 per cent. Meghalaya had the
highest share at 60.4 per cent followed by Nagaland
(51.4 per cent), Goa (45.3 per cent), Sikkim (44.7 per
cent) and Kerala (42.4 per cent). Rajasthan (8.6 per cent)
followed by Uttar Pradesh (10.5 per cent) had the lowest
share of women among panel lawyers.
Women Paralegal Volunteers: Nationally, the share
of women paralegals increased from 35 per cent20
in
March 2020 to 40 per cent as of June 2022. Four states/
UTs including Karnataka, Goa, Kerala, and Delhi, among
others, recorded more than 50 per cent women PLVs.
Ladakh at 82 per cent had the highest share, followed
by Sikkim at 76 per cent. Nagaland (23 per cent), Tripura
(25 per cent), Uttar Pradesh (25 per cent) and Bihar (27
per cent) recorded the lowest.
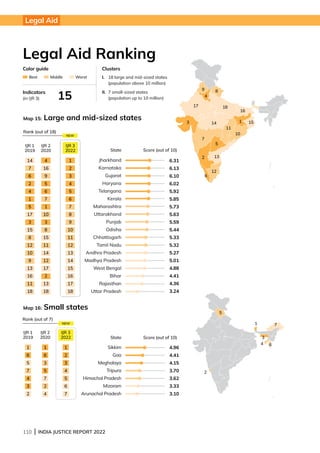
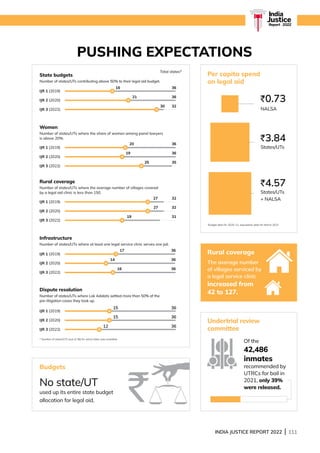
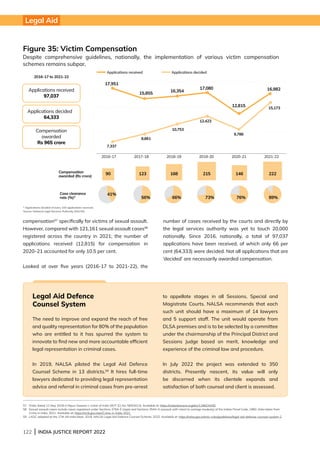
Budgets
Both NALSA (a central body) and states contribute
finances towards providing free legal aid. NALSA’s funds
are typically for activities that include conducting Lok
Adalats, mediation, training programs and honorariums
to lawyers, paralegals, mediators and judges presiding
over Lok Adalats, while state contributions primarily go
towards infrastructure, personnel and administrative
expenses. States also contribute to the Victim
Compensation Fund as mandated under Section 357-A
CrPC.
Share of women in panel lawyers
(%, 30 Jun 2022)
Women PLVs (%, 30 Jun 2022)
Transgenders: A long way to go
In 2014, the Supreme Court recognised
transgendersasalegalidentity.21
Asof2022,only
587 paralegals are transgender. Maharashtra
employs the most at 183 followed by Karnataka
(137) while seventeen states/UTs22
employ none.
Data on their presence among legal aid lawyers
and secretaries is not publicly available.
NALSA Fund utilised (%, 2021-22)
State's share in legal aid budget
(%, 2021-22)
State legal-aid budget utilised
(%, 2020-21)](https://image.slidesharecdn.com/ijr-2022-full-report-230406040535-672df3b1/85/INDIA-JUSTICE-REPORT-2022-127-320.jpg)


![INDIA JUSTICE REPORT 2022 | 147
India
Justice
Report | 2022
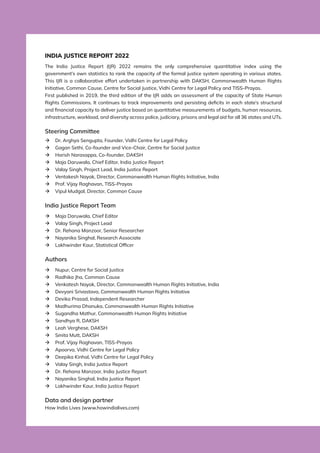
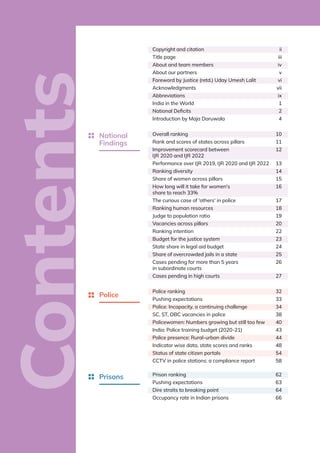
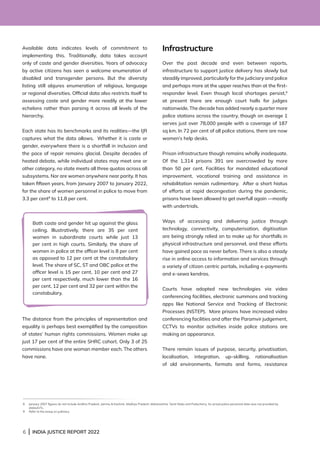
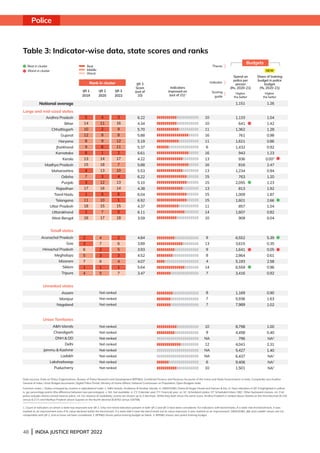
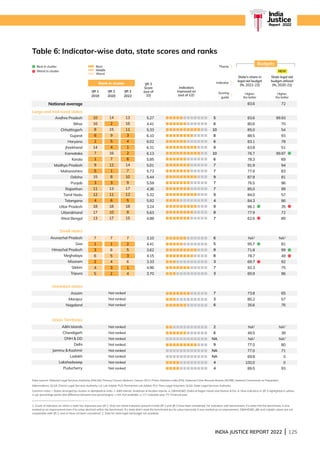
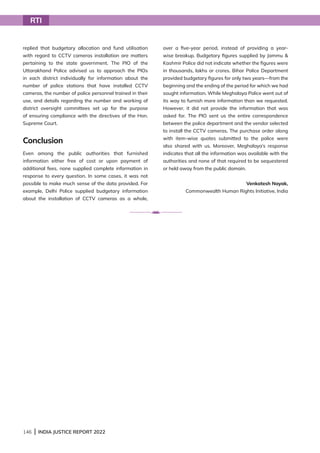
The India Justice Report’s rankings—whether pillar wise
or overall—rely entirely on quantitative data maintained
by states, UTs and the central government: numbers and
statistics. The more accurate the data, the fairer are its
conclusions. Inaccurate, imprecise, and outdated data
not only paints a false and often unfair picture, but also
impedes pathways to repair and reform. To address this,
it is important to approach data with a critical lens and
work to mitigate pitfalls.
In the main, the IJR has used the Bureau of Police
Research and Development’s (BPRD) Data on Police
Organisation (DoPO), National Crime Record Bureau’s
(NCRB) Prison Statistics India (PSI) report, the National
Judicial Data Grid (NJDG) and National Legal Services
Authority’s (NALSA) website and dashboard. These
are national aggregations of state provided data. In
addition, the IJR has relied on parliamentary questions,
state budget documents and, finally, responses to RTI
queries. Data sets show up many hard to reconcile
discrepancies that relate to the same subject in the
records of different agencies and publications. Some
challenges are illustrated below.
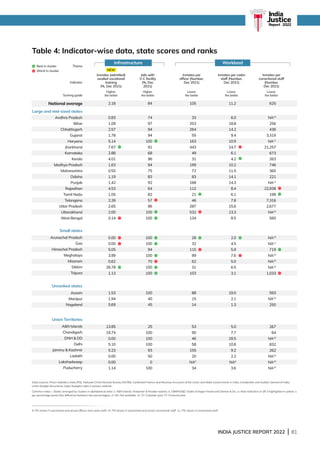
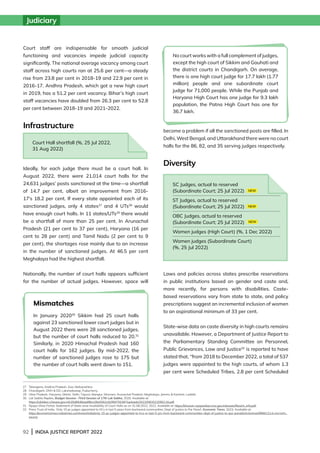
l
In July 2022, an answer to a parliamentary question
in the Lok Sabha1
gave the number of women judges
in Tamil Nadu’s subordinate courts as 428. A month
later, the Department of Justice (DoJ) portal on human
resources and diversity in district courts2
showed the
figure at nil.
l
For the same period (2021-22), three official
publications—the PSI, the E-prisons portal3
and the
state’s own prison website—recorded that Mizoram
has 1 women jail and no open jails; no women’s jail
and 1 prison HQ classified as an open jail; and 1
women’s jail but no open jail respectively.
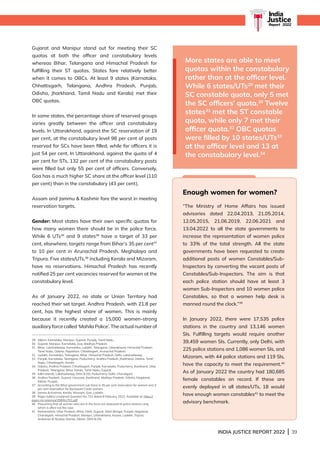
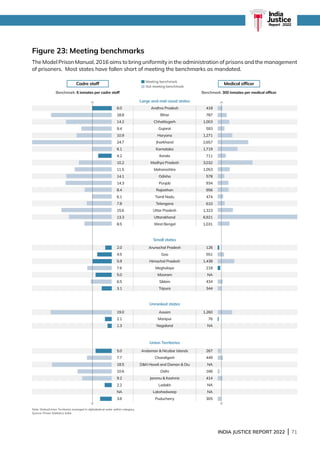
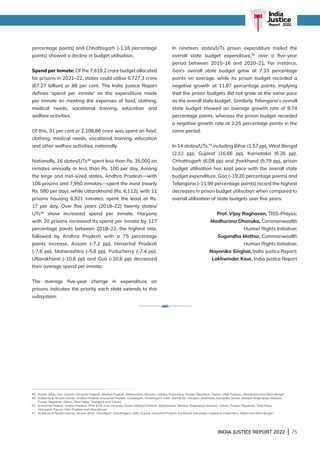
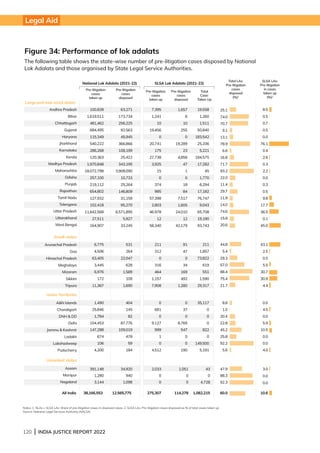
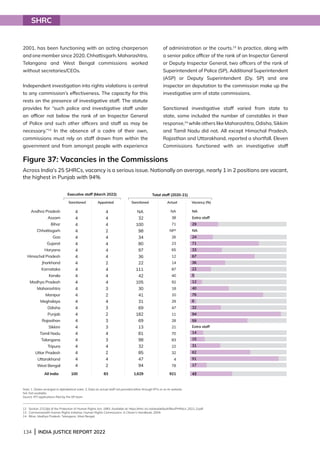
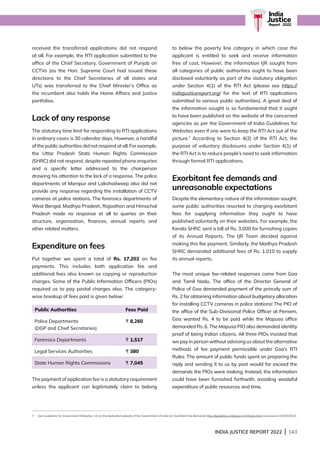
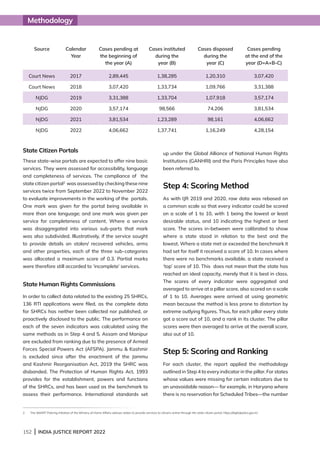
l
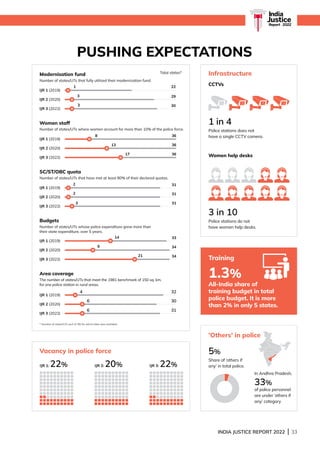
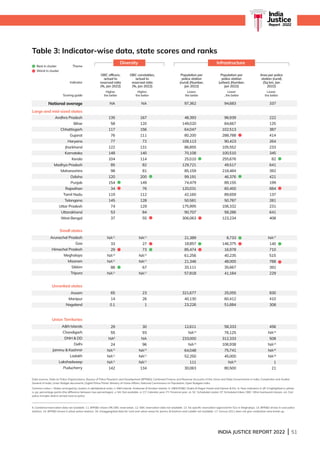
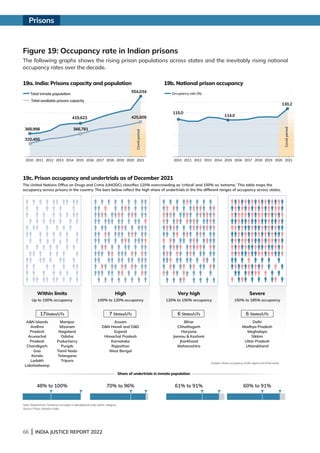
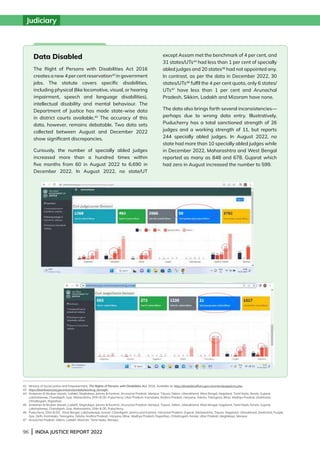
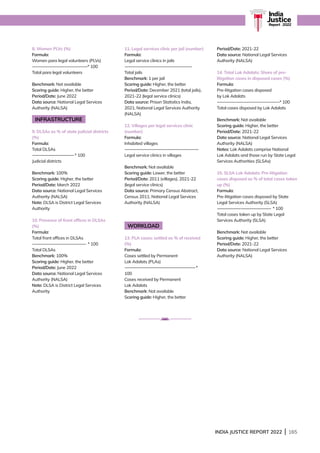
Similarly, NALSA website’s section on victim
compensation schemes4
records several anomalies.
For instance, the number of applications pending
from the previous year (Column B), applications
received in the current year (Column C), and those
disposed during the current year (Column E) do not
add up with the applications pending at the end of
the current year (Column F). As illustrated in the table
below:
1 Lok Sabha Unstarred Question No. 2116, dated 29 July 2022. Available at: http://164.100.24.220/loksabhaquestions/annex/179/AU2116.pdf
2 Department of Justice portal on strength of judges. Available at https://dashboard.doj.gov.in/sanctiondata/index.php
3 E-prisons portal developed by the National Informatics Centre. Available at: https://eprisons.nic.in/public/DashBoard
4
NALSA’s website records statistics related to legal service clinics, cases settled through mediation, permanent Lok Adalats, national Lok Adalats and applications received under victim
compensation schemes. Available at: https://nalsa.gov.in/statistics
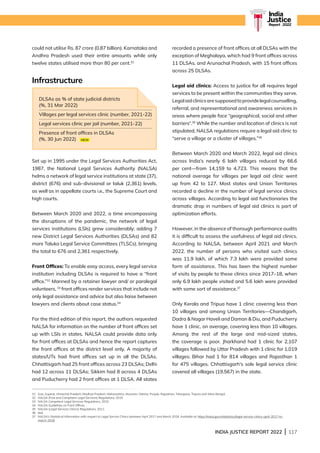
Challenges in Data
Chapter 7
A B C D E F G
Arunachal Pradesh 0 42 42 4 7 38
Bihar 654 1,002 1,656 785 348 871
Chhattisgarh 617 2,195 2,812 1,253 1,267 1,559
Kerala 81 560 641 139 123 502
Meghalaya 79 158 237 75 23 162
West Bengal 33 356 389 246 38 143
State Applications
pending at the
end of 2020-21
Applications
received in
2021-22
Total
applications
(B+C)
Applications
disposed in
2021-22
Applications
pending at the
end of 2021-22
Actual pendency
at the end of
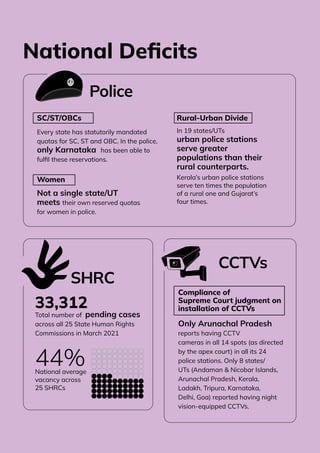
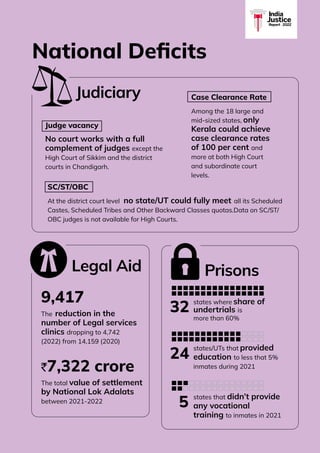
2021-22 [(B+C)-E]](https://image.slidesharecdn.com/ijr-2022-full-report-230406040535-672df3b1/85/INDIA-JUSTICE-REPORT-2022-159-320.jpg)

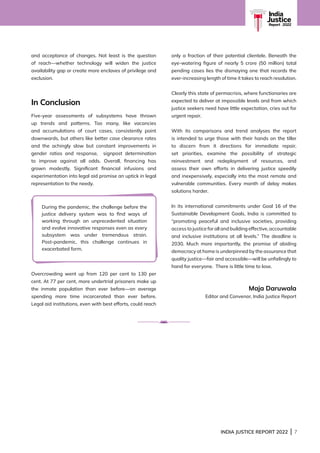
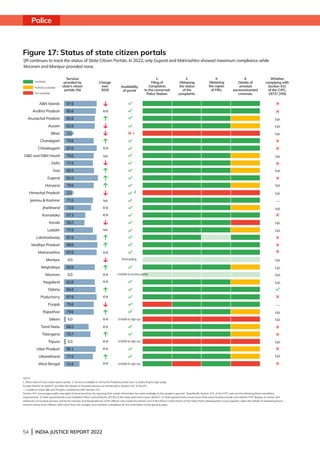
![158 | INDIA JUSTICE REPORT 2022
Benchmark: Not available
Scoring guide: Lower, the better
Period/Date: 2011 (urban area), January
2022 (urban police stations)
Data source: Census 2011; Data on Police
Organizations, Bureau of Police Research
and Development (BPRD), January 2022
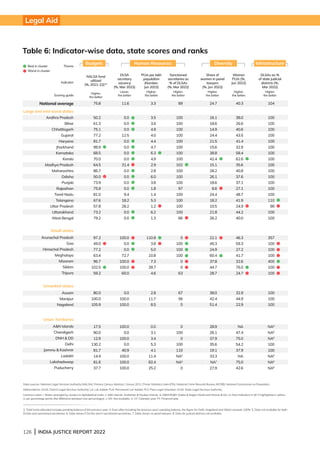
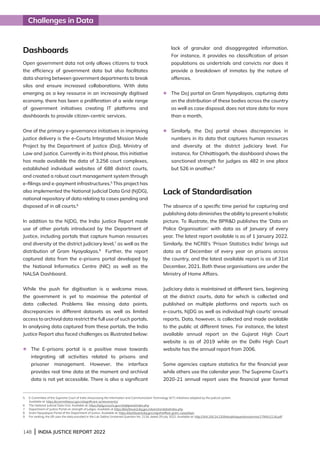
21. Services provided by state police
citizen portals (%)
Formula
Services provided (out of 10)
---------------------------------------------* 100
10
Benchmark: 100%
Scoring guide: Higher, the better
Period/Date: 2022
Data source: https://digitalpolice.gov.in/
Notes: Quantitative assessment of
state police citizen portals on 10 counts:
whether they include each of the 9
services listed by the Ministry of Home
Affairs and whether the portal was
available in a state language (other than
English).
22. Personnel per training institute
(number)
Formula:
Sanctioned total police
--------------------------------------------
Number of training institutes
Benchmark: Not available
Scoring guide: Lower, the better
Period/Date: January 2022
Data source: Data on Police
Organizations, Bureau of Police Research
and Development (BPRD), January 2022
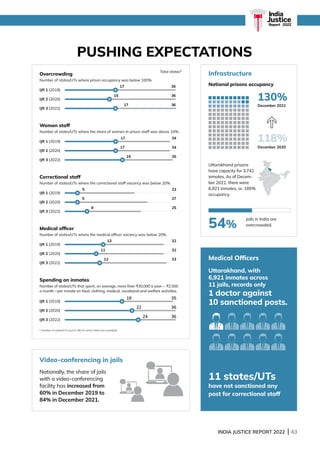
23. Share of police stations with CCTVs
(%)
Formula:
Police stations with CCTVs
--------------------------------------------* 100
Total police stations
Benchmark: 100%
Scoring guide: Higher, the better
Period/Date: January 2022
Data source: Data on Police
Organizations, Bureau of Police Research
and Development (BPRD), January 2022
24. Share of Police Stations with women
help desks (%)
Formula:
Police stations with women help desks
--------------------------------------------* 100
Total police stations
Benchmark: 100%
Scoring guide: Higher, the better
Period/Date: January 2022
Data source: Data on Police
Organizations, Bureau of Police Research
and Development (BPRD), January 2022
WORKLOAD
25. Population per civil police (persons)
Formula:
State population
----------------------------------------
Total civil police
Benchmark: Not available
Scoring guide: Lower, the better
Period/Date: March 2022 (state
population), January 2022 (civil police)
Data source: National Commission
on Population, 2019; Data on Police
Organizations, Bureau of Police Research
and Development (BPRD), January 2022
Notes: Civil police includes district armed
reserve police.
TRENDS
26. Women in total police (percentage
points)
Formula:
Women in total police – X
2016 X1
2017 X2 ((X2/X1)-1)*100 = a
2018 X3 ((X3/X2)-1)*100 = b
2019 X4 ((X4/X3)-1)*100 = c
2020 X5 ((X5/X4)-1)*100 = d
2021 X6 ((X6/X5)-1)*100 = e
5-year average (a,b,c,d,e)
Benchmark: Not available
Scoring guide: Higher, the better
Period/Date: Calendar year 2017 to 2021
Data source: Data on Police
Organizations, Bureau of Police Research
and Development (BPRD)
27. Women officers in total officers
(percentage points)
Formula:
Women officers in total officers – X
2016 X1
2017 X2 ((X2/X1)-1)*100 = a
2018 X3 ((X3/X2)-1)*100 = b
2019 X4 ((X4/X3)-1)*100 = c
2020 X5 ((X5/X4)-1)*100 = d
2011 X6 ((X6/X5)-1)*100 = e
5-year average (a,b,c,d,e)
Benchmark: Not available
Scoring guide: Higher, the better
Period/Date: Calendar year 2017 to 2021
Data source: Data on Police
Organizations, Bureau of Police Research
and Development (BPRD)
Notes: Calculation for 2016 is repeated
for 2017 as BPRD did not provide
rank-wise data for women district armed
reserve police for 2017.
28. Constable vacancy (percentage
points)
Formula:
Constable vacancy – X
2016 X1
2017 X2 ((X2/X1)-1)*100 = a
2018 X3 ((X3/X2)-1)*100 = b
2019 X4 ((X4/X3)-1)*100 = c
2020 X5 ((X5/X4)-1)*100 = d
2021 X6 ((X6/X5)-1)*100 = e
5-year average (a,b,c,d,e)
Benchmark: Not available
Scoring guide: Lower, the better
Period/Date: Calendar year 2017 to 2021
Data source: Data on Police
Organizations, Bureau of Police Research
and Development (BPRD)
29. Officer vacancy (percentage points)
Officer vacancy – X
2016 X1
2017 X2 ((X2/X1)-1)*100 = a
2018 X3 ((X3/X2)-1)*100 = b
2019 X4 ((X4/X3)-1)*100 = c
2020 X5 ((X5/X4)-1)*100 = d
2021 X6 ((X6/X5)-1)*100 = e
5-year average (a,b,c,d,e)
Benchmark: Not available
Scoring guide: Lower, the better
Period/Date: Calendar year 2017 to 2021
Data source: Data on Police
Organizations, Bureau of Police Research
and Development (BPRD)
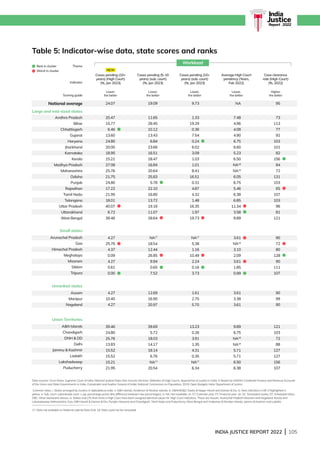
30. Difference in spend: police vs state
(percentage points)
Formula:
[5-year annual average of police
expenditure (PE) – 5-year annual average
of state expenditure (SE)]
2015-16 PE = X1
2016-17 X2 ((X2/X1)-1)*100 = a
2017-18 X3 ((X3/X2)-1)*100 = b
2018-19 X4 ((X4/X3)-1)*100 = c
2019-20 X5 ((X5/X4)-1)*100 = d
2020-21 X6 ((X6/X5)-1)*100 = e
Glossary](https://image.slidesharecdn.com/ijr-2022-full-report-230406040535-672df3b1/85/INDIA-JUSTICE-REPORT-2022-170-320.jpg)

![INDIA JUSTICE REPORT 2022 | 161
25. Inmates per cadre staff (%)
Formula:
Inmates per cadre staff = X
2016 X1
2017 X2 ((X2/X1)-1)*100 = a
2018 X3 ((X3/X2)-1)*100 = b
2019 X4 ((X4/X3)-1)*100 = c
2020 X5 ((X5/X4)-1)*100 = d
2021 X6 ((X6/X5)-1)*100 = e
5-year average (a,b,c,d,e)
Benchmark: Not available
Scoring guide: Lower, the better
Period/Date: Calendar year 2017 to 2021
Data source: Prison Statistics India
26. Share of undertrial prisoners
(percentage points)
Formula:
Share of UTPs (%) (X) = (UTPs/total
inmates*100)
2016 X1
2017 X2 ((X2/X1)-1)*100 = a
2018 X3 ((X3/X2)-1)*100 = b
2019 X4 ((X4/X3)-1)*100 = c
2020 X5 ((X5/X4)-1)*100 = d
2021 X6 ((X6/X5)-1)*100 = e
5-year average (a,b,c,d,e)
Benchmark: Not available
Scoring guide: Lower, the better
Period/Date: Calendar year 2017 to 2021
Data source: Prison Statistics India
27. Spend per inmate (%)
Formula:
Spend per inmate = X
2016-17 X1
2017-18 X2 ((X2/X1)-1)*100 = a
2018-19 X3 ((X3/X2)-1)*100 = b
2019-20 X4 ((X4/X3)-1)*100 = c
2020-21 X5 ((X5/X4)-1)*100 = d
2021-22 X6 ((X6/X5)-1)*100 = e
5-year average (a,b,c,d,e)
Benchmark: Not available
Scoring guide: Higher, the better
Period/Date: Financial year 2017-18 to
2021-22
Data source: Prison Statistics India
28. Prison budget used (percentage
points)
Formula:
Budget used = X
2016-17 X1
2017-18 X2 ((X2/X1)-1)*100 = a
2018-19 X3 ((X3/X2)-1)*100 = b
2019-20 X4 ((X4/X3)-1)*100 = c
2020-21 X5 ((X5/X4)-1)*100 = d
2021-22 X6 ((X6/X5)-1)*100 = e
5-year average (a,b,c,d,e)
Benchmark: Not available
Scoring guide: Higher, the better
Period/Date: Financial year 2017-18 to
2021-22
Data source: Prison Statistics India
29. Difference in spend: prisons vs state
(percentage points)
Formula: [5-year annual average of
prisons expenditure (PE) – 5-year annual
average of state expenditure (SE)]
2015-16 PE = X1
2016-17 X2 ((X2/X1)-1)*100 = a
2017-18 X3 ((X3/X2)-1)*100 = b
2018-19 X4 ((X4/X3)-1)*100 = c
2019-20 X5 ((X5/X4)-1)*100 = d
2020-21 X6 ((X6/X5)-1)*100 = e
PE = Average (a,b,c,d,e)
2015-16 SE = X1
2016-17 X2 ((X2/X1)-1)*100 = a
2017-18 X3 ((X3/X2)-1)*100 = b
2018-19 X4 ((X4/X3)-1)*100 = c
2019-20 X5 ((X5/X4)-1)*100 = d
2020-21 X6 ((X6/X5)-1)*100 = e
SE = Average (a,b,c,d,e)
Benchmark: Greater than zero
Scoring guide: Higher, the better
Period/Date: Financial year 2016-17 to
2020-21
Data source: Combined Finance and
Revenue Accounts of the Union and State
Governments in India, Comptroller and
Auditor General of India; Open Budgets
India; Finance Division of Ministry of
Home Affairs; Prison Statistics India
JUDICIARY
BUDGETS
1. Per capita spend on judiciary (Rs)
Formula:
Judiciary expenditure (Rs)
-----------------------------------------------------------------
State Population
Benchmark: Not available
Scoring guide: Higher, the better
Period/Date: March 2021 (population),
2020-21 (judiciary expenditure)
Data source: National Commission on
Population, 2019; Combined Finance
and Revenue Accounts of the Union and
State Governments in India for 2020-21,
Comptroller and Auditor General of India;
Finance Division of Ministry of Home
Affairs
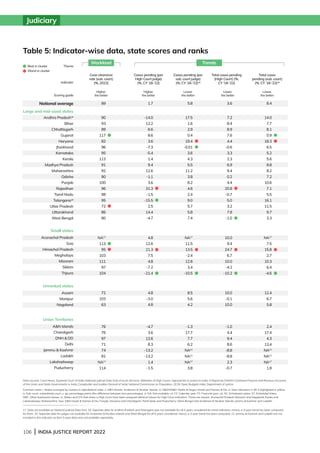
HUMAN RESOURCES
2. Population per High Court judge
(Persons)
Formula:
State population
--------------------------------------------
High Court judges
Benchmark: Not available
Scoring guide: Lower, the better
Period/Date: March 2022 (population);
December 2022 (High Court judges)
Data source: National Commission on
Population, 2019; Department of Justice
Notes: Population of states and UTs that
share a High Court have been combined,
and hence they share the same value.
These are Kerala and Lakshadweep;
West Bengal and Andaman
Nicobar Islands; Punjab, Haryana and
Chandigarh; Assam, Mizoram, Nagaland
and Arunachal Pradesh; Maharashtra,
Goa, Dadra Nagar Haveli, Daman
Diu; Tamil Nadu and Puducherry.
3. Population per subordinate court
judge (Persons)
Formula:
State population
-------------------------------------------------------------
Subordinate court judges
Benchmark: Not available
Scoring guide: Lower, the better
Period/Date: March 2022 (State
population); July 2022 (Subordinate court
judges)
Data source: National Commission
on Population, 2019; Parliamentary
Question-Lok Sabha, Unstarred Question
No. 2116
4. High Court judge vacancy (%)
Formula:
Working High
Court Judges
100 – ( ------------------------------------------------ * 100)
Sanctioned High
Court judges
Benchmark: 0%
Scoring guide: Lower, the better
Period/Date: December 2022
Data source: Department of Justice
India
Justice
Report | 2022
India
Justice
Report | 2022](https://image.slidesharecdn.com/ijr-2022-full-report-230406040535-672df3b1/85/INDIA-JUSTICE-REPORT-2022-173-320.jpg)
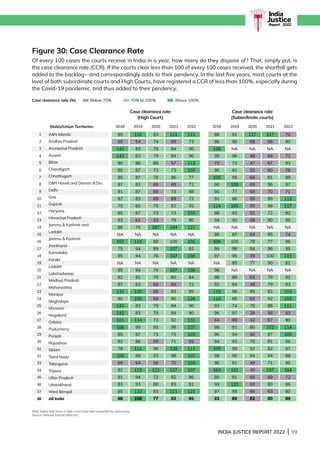
![164 | INDIA JUSTICE REPORT 2022
26. Case clearance rate (High Court)
(percentage points)
Formula:
Case clearance rate (X) =
High Court cases disposed
(civil + criminal)
------------------------------------------------------------* 100
High Court cases filed
(civil + criminal)
2017 X1
2018 X2 ((X2/X1)-1)*100 = a
2019 X3 ((X3/X2)-1)*100 = b
2020 X4 ((X4/X3)-1)*100 = c
2021 X5 ((X5/X4)-1)*100 = d
2022 X6 ((X6/X5)-1)*100 = e
5-year average (a,b,c,d,e)
Benchmark: Not available
Scoring guide: Higher, the better
Period/Date: 2018 to 2022
Data source: National Judicial Data Grid;
Court News, Supreme Court
27. Case clearance rate (subordinate
court) (percentage points)
Formula:
Case clearance rate (X) =
Subordinate court cases disposed
(civil + criminal)
---------------------------------------------------------------* 100
Subordinate court cases filed
(civil + criminal)
2017 X1
2018 X2 ((X2/X1)-1)*100 = a
2019 X3 ((X3/X2)-1)*100 = b
2020 X4 ((X4/X3)-1)*100 = c
2021 X5 ((X5/X4)-1)*100 = d
2022 X6 ((X6/X5)-1)*100 = e
5-year average (a,b,c,d,e)
Benchmark: Not available
Scoring guide: Higher, the better
Period/Date: 2018 to 2022
Data source: National Judicial Data Grid;
Court News, Supreme Court
28. Difference in spend: judiciary vs state
(percentage points)
Formula: [5-year annual average of
judiciary expenditure (JE)] – [(5-year
annual average of state expenditure (SE)]
2015-16 JE = X1
2016-17 X2 ((X2/X1)-1)*100 = a
2017-18 X3 ((X3/X2)-1)*100 = b
2018-19 X4 ((X4/X3)-1)*100 = c
2019-20 X5 ((X5/X4)-1)*100 = d
2020-21 X6 ((X6/X5)-1)*100 = e
PE = Average (a,b,c,d,e)
2015-16 JE = X1
2016-17 X2 ((X2/X1)-1)*100 = a
2017-18 X3 ((X3/X2)-1)*100 = b
2018-19 X4 ((X4/X3)-1)*100 = c
2019-20 X5 ((X5/X4)-1)*100 = d
2020-21 X6 ((X6/X5)-1)*100 = e
SE = Average (a,b,c,d,e)
Benchmark: Greater than zero
Scoring guide: Higher, the better
Period/Date: Financial year 2015-16 to
2020-21
Data source: Combined Finance and
Revenue Accounts of the Union and State
Governments in India, Comptroller and
Auditor General of India; Open Budgets
India; Finance Division of Ministry of
Home Affairs
LEGAL AID
BUDGETS
1. State's share in legal aid budget (%)
Formula:
Allocation by state for legal aid
---------------------------------------------------------* 100
Allocation by state for legal aid +
Allocation by NALSA
Benchmark: Not available
Scoring guide: Higher, the better
Period/Date: 2021-22
Data source: National Legal Services
Authority (NALSA); State budget
documents
2. State legal aid budget utilised
(%)
Formula:
Allocation by state for legal aid
---------------------------------------------------------* 100
Allocation by state for legal aid +
Allocation by NALSA
Benchmark: 100%
Scoring guide: Higher, the better
Period/Date: 2020-21
Data source: State budget documents
3. NALSA fund utilised (%)
Formula:
NALSA funds utilised
-------------------------------------------------------------* 100
NALSA funds carried forward from
previous year + received this year
Benchmark: 100%
Scoring guide: Higher, the better
Period/Date: 2021-22
Data source: National Legal Services
Authority (NALSA)
HUMAN RESOURCES
4. DLSA secretary vacancy (%)
Formula:
Actual DLSA secretaries
100 - ---------------------------------------------------* 100)
Sanctioned DLSA secretaries
Benchmark: 0%
Scoring guide: Lower, the better
Period/Date: March 2022
Data source: National Legal Services
Authority (NALSA)
Note: DLSA is District Legal Services
Authority
5. PLVs per lakh population (persons)
Formula:
Para legal volunteers (PLVs)
---------------------------------------------------------------
State population
Benchmark: Not available
Scoring guide: Higher, the better
Period/Date: March 2022 (Population);
June 2022 (PLVs)
Data source: National Commission on
Population, 2019; National Legal Services
Authority (NALSA)
6. Sanctioned secretaries as % of DLSAs
(%)
Formula:
Sanctioned DLSA secretaries
------------------------------------------------ * 100
Total sanctioned DLSAs
Benchmark: 100%
Scoring guide: Higher, the better
Period/Date: March 2022
Data source: National Legal Services
Authority (NALSA)
Note: DLSA is District Legal Services
Authority
DIVERSITY
7. Women panel lawyers (%)
Formula:
Women panel lawyers
--------------------------------------------------------- * 100
Total panel lawyers
Benchmark: Not available
Scoring guide: Higher, the better
Period/Date: June 2022
Data source: National Legal Services
Authority (NALSA)
Glossary](https://image.slidesharecdn.com/ijr-2022-full-report-230406040535-672df3b1/85/INDIA-JUSTICE-REPORT-2022-176-320.jpg)
![166 | INDIA JUSTICE REPORT 2022
References
Articles – author, title ‘’,
newspaper, date study
1.
Responding to the Pandemic: Prisons and
Overcrowding, (States’ Decongestion Efforts),
Commonwealth Human Rights Initiative, 2020.
2.
Department related parliamentary standing
committee report on Personnel, Public Grievances,
Law and Justice.
3.
Renuka Sane, Neha Sane, ‘Budgeting for the police’,
Live Mint, 11 April 2017.
Police
1.
Padmanabhaiah Committee for Police Reforms,
2000.
2.
Data on Police Organisation, 2022, Bureau of Police
Research Development.
3.
‘Govt notifies rules for AP Mahila police wing’, The
Hindu, 13 January 2022
4.
Manpower Requirement Study, Bangalore City
Police, Janaagraha centre for citizenship and
democracy, 2014
5.
Data on Police Organisation, National Requirement
of Manpower for 8-hour Shifts in Police Stations;
Bureau of Police Research Development, August
2014
6.
Census of India, 2011
7.
NALSA v. Union of India, [Writ Petition Civil) Number
400 of 2012]
8.
Rajya Sabha, Unstarred Question No. 701, 8
February 2023
9.
Modernisation of State Police Forces; Ministry of
Home Affairs, Government of India,
10.
Training Master Plan, Bureau of Police Research
and Development, 2009
11.
Paramvir Singh Saini vs Baljit Singh [Special Leave
Petition (Criminal) No. 3543 of 2020].
12.
Crime in India, 2021, National Crime Records
Bureau
13.
Order G.O(Ms.) No. 167/2014/Home, 2014, Home
Department, Government of Kerala,
14.
‘Kerala Police Cyberdome alerts against WannaCry
ransomware attack’, Indian Express, 15 May 2017
15.
Shafi Mohammad vs State of Himachal Pradesh
[Special Leave Petition (Crl.) No. 2302 of 2017]
Prisons
1.
Global Prison Trends, 2022, Penal Reform
International
2.
Re: Contagion of COVID 19 Virus in Prisons [Suo
Motu Writ Petition (Civil) No. 1/2020]
3.
E/Cn.15/2016/10, United Nations Office on Drugs
and Crime, Twenty-fifth Session of the Commission
on Crime Prevention and Criminal Justice, 2016
4.
Prison Statistics India, 2021, National Crime
Records Bureau
5.
Government of India, Ministry of Home Affairs,
Advisory No. V-17013/01/2011-PR
6.
Model Prison Manual, 2016, Ministry of Home
Affairs, Government of India
7.
‘Not all convicts lodged in jail are criminals by nature,
and there should be a way to rehabilitate them back
into society” in ‘Centre to bring Model Prisons Act:
Amit Shah’, Hindustan Times, 5 September 2022.
8.
Inside Karnataka’s Prisons, 2019, Commonwealth
Human Rights Initiative,
Judiciary
1.
Nyaya Vikas Portal, Statement of State-wise
availability of Court Halls as on 31.08.2022,
2.
Centre for Budget and Governance Accountability
and DAKSH, Memorandum to the Fifteenth Finance
Commission on Budgeting for the Judiciary in India,
2019
3.
Combined Finance and Revenue Accounts of the
Union and State Governments in India, Comptroller
and Auditor General of India, 2020-21
4.
Data Speak: A Look at District Courts’ Performance
During the Pandemic, 2022; Vidhi Centre for Legal
Policy](https://image.slidesharecdn.com/ijr-2022-full-report-230406040535-672df3b1/85/INDIA-JUSTICE-REPORT-2022-178-320.jpg)
![INDIA JUSTICE REPORT 2022 | 167
India
Justice
Report | 2022
5.
E-committee Newsletter, June 2020; Supreme Court
of India,
6.
Annual Report 2020-21; Supreme Court of India
7.
One Hundred Twentieth Report on Manpower
Planning in Judiciary: A Blueprint, 1987; Law
Commission of India
8.
85th Report on Law’s Delays: Arrears in Courts,
2002; Department-Related Parliamentary Standing
Committee on Home Affairs
9.
Imtiyaz Ahmad vs State of UP Ors. [Criminal
Appeal Nos. 254-262 of 2012]
10.
Arrears and Backlog: Creating Additional Judicial
(wo)manpower, 2014; Law Commission of India,
11.
Note for Calculating Required Judge Strength
for Subordinate Courts, 2016; National Court
Management Systems Committee,
12.
Lok Sabha Replies, Budget Session –Third Session
of 17th Lok Sabha, 2020.
13.
Press Trust of India, ‘Only 15 pc judges appointed
to HCs in last 5 years from backward communities:
Dept of Justice to Par Panel’, Economic Times, 2023.
14.
Law Commission of India, 245th Law Commission
Report, 2014
15.
Supreme Court of India, Conference Proceedings of
National Initiative to Reduce Pendency and Delay in
Judicial System, 2018
16.
Ministry of Social Justice and Empowerment, The
Rights of Persons with Disabilities Act, 2016
17.
Deconstructing delay: Analysis of Delays in High
courts and Subordinate Courts; DAKSH,
18.
Ministry of Law and Justice, 123rd Report by
Parliamentary Standing Committee on Personnel,
Public Grievances, Law and Justice, 2022
Legal Aid
1.
Justice for All - The Report of the Task Force on
Justice; Pathfinders for Peaceful, Just and Inclusive
Societies, April 2019
2. NALSA’s Statistical Snapshot, 2020
3.
Study on Functioning of Undertrial Review
Committees (from April to June 2020);
4.
Commonwealth Human Rights Initiative,
5.
NALSA (Free and Competent Legal Services)
Regulations 2010
6. NALSA (Legal Services Clinics) Regulations, 2011
7.
NALSA SOP on Representation of Persons in
Custody 2011
8. NALSA’s Scheme for Paralegal Volunteers, 2009
9.
National Legal Services Authority v. Union of India
[Writ Petition (Civil) No. 400 of 2012].
10.
NALSA Guidelines on Front Offices
11. Section 10, NALSA Lok Adalat Regulations, 2009
12.
Section 22B–22E of the Legal Services Authorities
Act, 1987:
13.
Nipun Saxena v. Union of India [W.P. (C) No.
565/2012]
14.
Crime in India, 2021.
15. NALSA Legal Aid Defence Counsel Scheme, 2022
16.
NALSA’s Standard Operating Procedure for
Undertrial Review Committees
17.
Re Inhuman Conditions in 1382 Prisons [W.P. (Civil)
No. 406/2013]
18.
NALSA’s Release_UTRC@75 Campaign
State Human Rights
Commissions
1.
Abdul Sathar vs The Principal Secretary to
Government and 5 others [W.P. No. 41791 of 2006]
2.
Section 21, Protection of the Human Rights Act,
1993
3.
Human Rights Commissions: A Citizen’s Handbook,
2004; Commonwealth Human Rights Initiative,
4.
Paris Principles, ‘Composition and guarantees of
independence and pluralism
5.
Protection of Human Rights in India: Working
of NHRC/SHRC (1993-2018); Transparency
International India, 2019,](https://image.slidesharecdn.com/ijr-2022-full-report-230406040535-672df3b1/85/INDIA-JUSTICE-REPORT-2022-179-320.jpg)