Opportunities from Satellite Observation Systems in Climate Risk Mitigation: ...
Poster chiodo fantini perito_salvatore
1. DIFFERENCES IN DEVELOPMENT PATHS OF TOURISM AND
AGRICULTURE WITHIN ABRUZZO REGION PROTECTED AREAS
Emilio CHIODO*, Maria Angela PERITO*, Rita SALVATORE**, Andrea FANTINI*
* University of Teramo, Faculty of Bioscience and technology for food agriculture and environment
Via Lerici 1, 64023 Mosciano Sant’Angelo (TE), Italy
** University of Teramo, Faculty of (…)
E.mail: echiodo@unite.it
INTRODUCTION
Abruzzo mountainous areas account for 65% of the regional surface. Mountain municipalities are 166 out of 305 in total, with a population of 380.000 inhabitants,
corresponding to the 28% of the total. With the municipalities classified as inland hill, we reach the number of 232 units that cover an area of 8,705 sq km, corresponding
to the 81% of the region, with a population of 587.000 inhabitants, 44% of the total.
Twenty years after the institution of the National parks of Majella and Gran Sasso-Laga and of the Regional Park of Sirente-Velino, the protected surface of
Abruzzo has reached the degree of more than 30 % of the region, considering also the historical National Park of Abruzzo, Lazio and Molise. The protected areas
include both mountains and hills territories, thus creating the conditions to investigate similarities and differences between the development paths of areas within the
parks and outside them.
AIMS
To conduct an analysis of the dynamics, which interested the inner municipalities by highlighting the lines of development that protected areas have undertaken.
By looking at the population long-term trends, the tourism and agriculture, to identify the difference in development paths according to a local dimension.
To identify: the different models of development in mountain areas, the relations with agriculture and tourism and the presence of those original paths that can feature
a paradigmatic value with regard to regional protected areas.
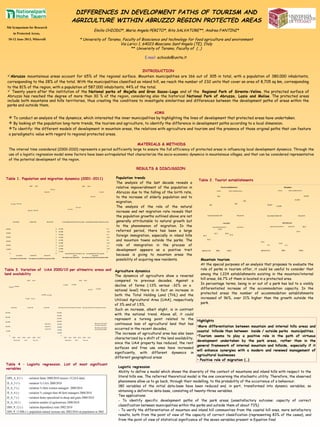
Population trends
The analysis of the last decade reveals a
relative impoverishment of the population in
Abruzzo due to the falling of the birth rate,
to the increase of elderly population and to
migration.
The analysis of the role of the natural
increase and net migration rate reveals that
the population growths outlined above are not
generally attributable to natural growth but
to the phenomenon of migration. In the
referred period, there has been a large
foreign immigration, especially in inland hills
and mountain towns outside the parks. The
role of immigration in the process of
development appears as a positive trait
because is giving to mountain areas the
possibility of acquiring new residents.
MATERIALS & METHODS
The interval time considered (2000-2010) represents a period sufficiently large to ensure the full efficiency of protected areas in influencing local development dynamics. Through the
use of a logistic regression model some factors have been extrapolated that characterize the socio-economic dynamics in mountainous villages, and that can be considered representative
of the potential development of the region.
Logistic regression
Ability to define a model which shows the diversity of the context of mountains and inland hills with respect to the
litoral hills one. The referred theoretical model is the one concerning the stochastic utility. Therefore, the observed
phenomena allow us to go back, through their modelling, to the probability of the occurrence of a behaviour.
180 variables of the initial data-base have been reduced and, in part, transformed into dynamic variables, so
obtaining a definitive data-base, consisting of twenty-three variables.
Two applications:
- To identify specific development paths of the park areas (unsatisfactory outcome: capacity of correct
classification between municipalities within the parks and outside them of about 73%)
- To verify the differentiation of mountain and inland hill communities from the coastal hill ones, more satisfactory
results, both from the point of view of the capacity of correct classification (representing 83% of the cases), and
from the point of view of statistical significance of the seven variables present in Equation final
Table 3. Variation of UAA 2000/10 per altimetric areas and
land availability
Table 4 – Logistic regression. List of most significant
variables
Table 1. Population and migration dynamics (2001-2011)
RESULTS & DISCUSSION
Table 2. Tourist establishments
Mountain tourism
At the special purposes of an analysis that proposes to evaluate the
role of parks in tourism offer, it could be useful to consider that
among the 1.224 establishments existing in the mountain/internal
hill areas, 66.7% of them is located in a protected area.
In percentage terms, being in or out of a park has led to a visibly
differentiated increase of the accommodation capacity. In the
protected areas the number of accommodation establishments
increased of 96%, over 21% higher than the growth outside the
park.
5th Symposium for Research
in Protected Areas,
10-12 June 2013, Mittersill
371,005
200,422
690,267
379,158
206,452
756,071
mountain inland hill litoral hill
2001 2011
271,073
300,354
275,319
310,291
montain&inlandhill within the parks montain&inlandhill outside the parks
2001 2011
0
1
2
3
4
5
6
7
8
9
0
10.000
20.000
30.000
40.000
50.000
60.000
mountain inland hill litoral hill
Net migration rate 2002-2010 Net migration rate 2002-201/ population 2002
5
5,05
5,1
5,15
5,2
5,25
5,3
5,35
5,4
12.500
13.000
13.500
14.000
14.500
15.000
15.500
16.000
16.500
montain&inland hill within the
parks
montain&inland hill outside
the parks
Net migration rate 2002-2010 Net migration rate 2002-201/ population 2002
365
456
859
592
mountain/inland hill litoral hill
Tourist establishments
Hotels Other establishments
18,607
32,380
15,068
42,692
mountain/inland hill litoral hill
Bed places
Hotels Other establishments
29.3
35.7 34.9
20.3
47.8
31.9
Agritourism B&B Other
number
mountain/inland hill litoral hill
19.3
12.8
67.9
5.3 4.1
90.5
Agritourism B&B Other
bed places
mountain/inland hill litoral hill
Agriculture dynamics
The dynamics of agriculture show a reversal
compared to previous decades. Against a
decline of farms (-13% versus -32% on a
national level) there is in fact an increase in
both the Total Holding Land (THL) and the
Utilized Agricultural Area (UAA), respectively
of 3% and of 1.5%.
Such an increase, albeit slight, is in contrast
with the national trend. Above all, it could
represent a turning point related to the
continuous loss of agricultural land that has
occurred in the recent decades,
The increase of agricultural area has also been
characterized by a shift of the land availability,
since the UAA property has reduced, the rent
surfaces and free use ones have increased
significantly, with different dynamics in
different geographical areas
229,816
74,269
126,996
239,344
74,231
123,786
Mountain Inland Hill Litoral Hill
2000 2010
172,998
131,087
175,896
137,680
Mountain & inland hill within the parks Mountain & inland hill outside the parks
2000 2010
0
50,000
100,000
150,000
200,000
250,000
2000 2010 2000 2010 2000 2010
Ownership Rent Free use
Mountain
Inland hill
Litoral hill
0
20,000
40,000
60,000
80,000
100,000
120,000
140,000
160,000
2000 2010 2000 2010 2000 2010
Ownership Rent Free use
Mountain and inland
hill within the parks
Mountain and inland
hill outside the parks
Highlights
•More differentiation between mountain and internal hills areas and
coastal hillside than between inside / outside parks municipalities.
•Tourism seems to play a positive role in the path of virtuous
development undertaken by the park areas, rather than in the
general framework of internal mountain and hillside, especially if it
will enhance synergies with a modern and renewed management of
agricultural businesses
• Positive role of migration (…)