
Recommended
Recommended
More Related Content
Similar to Solar Irradiation Data for Lebanon August 2020.pdf
Similar to Solar Irradiation Data for Lebanon August 2020.pdf (20)
Recently uploaded
Recently uploaded (20)
Solar Irradiation Data for Lebanon August 2020.pdf
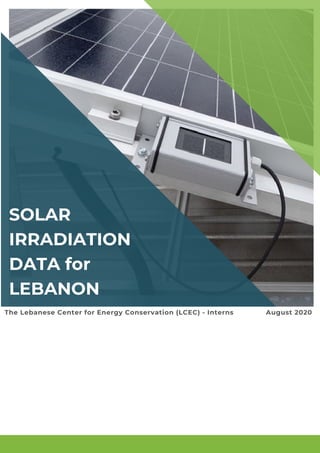
- 1. The Lebanese Center for Energy Conservation (LCEC) - Interns August 2020 SOLAR IRRADIATION DATA for LEBANON
- 2. Authors - LCEC Interns Antoine Bayssary Masters Degree in Human Geography, Faculty of Letters and human sciences, Lebanese University Christa Hajjar 5th Year Mechanical Engineer, Faculty of Engineering, Lebanese University SOLAR IRRADIATION IN LEBANON AUGUST 2020
- 3. 1. 2. 3. 4. 6. 5. 8. TABLE OF CONTENTS BACKROUND REVIEW ABSTRACT METHODOLOGY SITES OVERVIEW RESULTS CONCLUSION ACKNOWLEDMENTS 7. CHALLENGES
- 4. SOLAR IRRADIATION IN LEBANON AUGUST 2020 Figures Tables Figure 1. Climatic Zones in Lebanon .......................................................................................................... 1 Figure 10. Parissis Steel Engineering Factory Solar PV System ................................................. 7 S.M.LC Solar PV System ................................................................................................................... 5 Figure 2. Table 1. Climatic Zones' Altitudes ............................................................................................................... 1 Global Horizontal Irradiation Data 2005 ............................................................................ 2 Table 2. Table 3. Global Horizontal Irradiation Data 2019 ........................................................................... 9 Figure 3. Figure 4. Figure 5. Figure 6. Figure 7. Figure 8. Figure 9. Libanjus Solar PV System ............................................................................................................... 5 FDC Solar PV System ....................................................................................................................... 5 Las Salinas Solar PV System ....................................................................................................... 5 Ablah Medical Center Solar PV System ............................................................................ 6 Qobbeh Medical Center Solar PV System ...................................................................... 6 El Helou Barrack Solar PV System ......................................................................................... 6 Ministry of Energy and Water Solar PV System ........................................................... 6 Figure 11. ABC Achrafiyeh Solar PV System ............................................................................................ 7 Figure 12. Global Irradiation Stations in Lebanon .............................................................................. 8
- 5. In Lebanon, only one publication, “CLIMATIC ZONING FOR BUILDINGS IN LEBANON”, published in 2005, includes solar irradiation data regarding the climatic zones in Lebanon of which the following methodology was followed: In all cases, the solar data have been generated from an algorithm in DOE that builds the direct radiation and horizontal radiation data from specific information about the station including the location (latitude, longitude and altitude), the clearness number of the sky, the cloud cover and the type of cloud encountered. The values were inputted into the software to generate solar records that were in general accordance with the global horizontal solar radiation of the two stations where records were available. This allowed building weather files where the data between direct solar radiation and horizontal solar radiation are consistent. The station used used in this study were The Atlas Climatique du Liban and Post 1998 weather data records for selected stations and from private stations such as the weather station of the American University of Beirut. Solar data was collected from different climatic zones which are divided according the "Atlas Climatique du Liban" generally divides the country into three broad climatic trends: the coastal, the mountainous and the inland. These are further subdivided into a number of sub-regions making up to a total of eight climatic regions by taking into consideration various factors. 1. BACKGROUND REVIEW SOLAR IRRADIATION IN LEBANON AUGUST 2020 0-700 m 700-1400 m 700-1150 m 1400 + m 1150 + m ZONE 1 ZONE 2 ZONE 3 ZONE 4 Coastal Western Mid-Mountain Inland Plateau High Mountain Littoral side High Mountain Inland side Figure 1. Climatic Zones in Lebanon Table 1. Climatic Zones' Altitudes 1 1
- 6. 1.1. PREVIOUS RESULTS : SOLAR IRRADIATION IN LEBANON YEAR 2020 Global Horizontal Irradiation Data (2005) (Wh/m^2) MONTH ZONE JANUARY FEBRUARY MARCH MAY APRIL JUNE JULY AUGUST SEPTEMBER OCTOBER NOVEMBER DECEMBER AVERAGE COASTAL - BEIRUT COASTAL - BAYSSOUR INLAND 2387.6 3195.8 4898.1 6012 6837 7192 7010.4 6343.7 5374.6 3873.5 2757.2 2273.4 4854.6 2503.6 3208.1 4777.7 6018.3 6833.2 7209.7 7024 6353.2 5389.1 3896.9 2770.7 2287.3 4864.1 2522.2 3282.2 4861.2 5979.5 6837.6 7211.3 7037.5 6405.2 5466.1 3828.4 2765.4 2241.2 4877.6 Table 2. Global Horizontal Irradiation data 2005 2 Since the irradiation stations available in Lebanon can be only distributed over three climatic regions (Coastal - Beirut, Coastal - Bayssour, Inland), we chose to show the previous results of those regions. These results will be compared later on with the new results that were obtained.
- 7. Solar Irradiation is considered as one of the most important meteorological parameters for the operation of photovoltaic power plants, which directly impacts power production. Due its importance in determining the performance ratio of a photovoltaic system, the solar irradiation data must be updated since it could be subjected to change over the years in accordance with climate change. SOLAR IRRADIATION IN LEBANON AUGUST 2020 3 2. ABSTRACT
- 8. The year 2019 has been chosen to proceed with due to the majority of the available data being from this year. Data available from different sites are taken into consideration, of which they are distributed over only 3 climatic zones: Coastal, Bayssour, and Inland. The climatic zones are split similarly to the Figure shown previously which is taken from “CLIMATIC ZONING FOR BUILDINGS IN LEBANON”. The solar irradiation calculations for the year 2019 are done by taking into consideration data from irradiation sensors and pyranometers sampled every 5 minutes. We begin our calculation by computing first the daily irradiation for each sensor which is done by adding up the values of the data collected every 5 minutes for each day and then multiplying by (5/60). Then we proceed by calculating the average daily irradiation for each month. Therefore, to obtain the yearly result we simply calculate the average of all months. After completing the primary result table of the solar irradiation for different sensors and different sites, a monthly transposition factor (TF) must be taken into account for the correction of the obtained results due to the different orientations, inclinations of the sensors used and in order to unify the condition of measurement. All the tilted sensors’ results are then corrected by dividing them with their corresponding transposition factor and then are averaged with the horizontal sensors of the same site in order to obtain the final results which is the Global Horizontal Irradiation. Tabulation and Documentation of the Results. Interpretation of the Results and Concluding. 3. METHODOLOGY SOLAR IRRADIATION IN LEBANON AUGUST 2020 01 Literature Review 02 Data Acquisition. 03 Data Analysis. 04 05 4
- 9. 4. SITE OVERVIEW: S.M.L.C PEPSICO: Location: Haret el Oumara,Chweifat. Climatic zone: Coastal zone. Executive company name: Ecosys – ITG holding. Number of solar radiation sensors: 2 horizontal sensors. · LIBANJUS : Location: Church Mar Antonios, Baabda. Climatic zone: Coastal zone. Executive company name: Ecosys – ITG holding. Number of solar radiation sensors: 1 horizontal sensor. · FDC DISTRIBUTION CENTER : Location: Achrafiyeh, Beyrouth. Climatic zone: Coastal zone. Executive company name: Ecosys – ITG holding. Number of solar radiation sensors: 1 horizontal sensor. · LAS SALINAS HOTEL : Location: Anfeh, North. Climatic zone: Coastal zone. Executive company name: Ecosys – ITG holding. Number of solar radiation sensors: 1 horizontal sensor. · SOLAR IRRADIATION IN LEBANON AUGUST 2020 Figure 2. S.M.LC Pepsico. Solar PV System Figure 3. Libanjus. Solar PV System Figure 4. FDC Solar PV System Figure 5. Las Salinas Hotel Solar PV System 7 5
- 10. Location: Ablah, Bekaa. Climatic zone: Inland Executive company name: Green Essence Number of solar radiation sensors: 5 sensors. · Location: Qobbeh, Tripoli. Climatic zone: Coastal zone. Executive company name: Green Essence Number of solar radiation sensors: 5 sensors. · Location: : Saeb Salam, Beyrouth. Climatic zone: Coastal zone. Executive company name: Green Essence Number of solar radiation sensors: 4 sensors. · Location: : Corniche Al Nahr, Beyrouth. Climatic zone: Coastal zone. Executive company name: Ecosys – ITG holding. Number of solar radiation sensors: 3 sensors. · MINISTRY OF ENERGY AND WATER (MEW) : Figure 9. MEW Solar PV System 4. SITE OVERVIEW: LEBANESE ARMY FORCE ABLAH: LEBANESE ARMY FORCE QOBBEH: EMILE HELOU POLICE STATION : SOLAR IRRADIATION IN LEBANON AUGUT 2020 Figure 6. Ablah Medical Center Solar PV System Figure 7. Qobbeh Medical Center Solar PV System Figure 8. El Helou Barrack Solar PV System 6
- 11. Location: Achrafiyeh, Beirut Climatic zone: Coastal zone. Executive company name: Ecosys – ITG holding. Number of solar radiation sensors: 1 Horizontals sensor. · Location: Gharzouz, Jbeil Climatic zone: Coastal Bayssour Executive company name: Ecosys – ITG holding. Number of solar radiation sensors: 1 Horizontal sensor. · 4. SITE OVERVIEW: PARISSIS STEEL ENGINEERING FACTORY: ABC ACHRAFIYEH : SOLAR IRRADIATION IN LEBANON AUGUT 2020 Figure 10. Parissis Steel Engineering Factory Solar PV System Figure 11. ABC Achrafiyeh Solar PV System 7
- 12. 12M SOLAR IRRADIATION IN LEBANON AUGUST 2020 Figure 12. Global Irradiation Stations in Lebanon 8
- 13. 5. RESULTS: SOLAR IRRADIATION IN LEBANON AUGUST 2020 Updated Global Horizontal Irradiation Data (2019-2020) (Wh/m^2) 2388.6 2887.9 4012.3 5091.2 6311.9 6193.4 6674.9 5790.9 4732.8 3571 2977.1 2005.6 4386.5 2129 2628.3 3767.6 4883.7 6353.7 6044 6255.7 5254.4 4853.9 3883.3 3175.9 2144 4281.1 2658.7 3129.4 4160.7 5184.2 6995.6 7328.2 7329.7 6579.5 5532.5 4083 3340.4 2215.6 4878.1 We can notice that there is a slight decrease in the Global Horizontal Irradiation in Coastal-Beirut (9.6%) and Coastal-Bayssour (12%) in the year 2019 compared to that in the year 2005 which can be due to the fact that in the year 2005 some of the data acquired were from satellites which are not as accurate as data measured directly by sensors . Moreover, the availability of only one site in Bayssour Region might be the cause of the decrease in irradiation level since one site may include some errors if it is not being averaged with other site's data. MONTH ZONE JANUARY FEBRUARY MARCH MAY APRIL JUNE JULY AUGUST SEPTEMBER OCTOBER NOVEMBER DECEMBER AVERAGE COASTAL - BEIRUT COASTAL - BAYSSOUR INLAND Table 3. Global Horizontal Irradiation data 2019 9 6. CONCLUSION:
- 14. Mainly, data from the year 2019 was available in most of the sites while the other years were incomplete in other stations due to some sites being newly constructed. Therefore, only data from the year 2019 was taken into consideration. We also faced difficulties in the data analysis and tabulation due to important missing data from some months in some sites. Hence, there are cases where we have replaced a couple of the missing months in 2019 by data of the respective months available in 2020. In some sites, there wasn't available information regarding the exact tilt of some solar irradiation sensors and therefore were considered horizontal. SOLAR IRRADIATION IN LEBANON AUGUST 2020 10 7. CHALLENGES
- 15. 8.ACKNOWLEDGEMENTS SOLAR IRRADIATION IN LEBANON AUGUST 2020 Foremost, we would like to express our gratitude to our Supervisor, Mrs. Reem Irany for the continuous support, guidance, motivation, and immense knowledge. We wish to thank LCEC team, and all the individuals who supported and contributed to this study. Special thanks to Ecosys-ITG Holding company for providing necessary information regarding the project and solar irradiation data. 11