SlideShare a Scribd company logo
1 of 42
Download to read offline
Beer Store Operational Report 2013Beer Store Operational Report 2013
Re-Invention
Beer Store
Operational Report 2013
1Beer Store Operational Report 2013
Table of Contents
President’s Message 					2
Retail Strategy 							3
Being Part of a Community				 9
Giving Back							10
Environmental Performance				11
Health & Safety						14
The Year in Beer Sales					 15
Beer Tax Contributions					20
Rate Sheet							22
Financial Statements						23
Beer Store Operational Report 20132President’s Message
President’s
Message
Welcome to our 2013 Operational Report, a financial and business overview of our
company’s performance and innovative advances.
This was a year of dramatic change for us, a transformation not only in our brand
identity, our visual image and store design, but also in our culture.
After months of research and talking directly with customers, we found that our
customers were looking for newer, modernized and more tactile shopping experiences.
Combining our customers’ desires with our employees growing passion for beer
knowledge, we embarked on a renewed vision and exciting journey of reinvention.
Thanks to dedicated teamwork we renovated four pilot stores in the spring of 2013 and
continued with a further roll out of 13 more store renovations in the fall so that we could
ensure that a robust test was complete.
Five key elements of the reinvented experience included a new name, a new logo, a
new retail design, new service features and new technology. The name “Beer Store” with
the modern styled “B” in stylized foam eyebrow is a contemporary version of our brand
based on our past branding heritage combined with continued reinforcement of our core
business. The new identity is a visual invitation to customers to expect to see something
new whenever entering through our doorways. Please look through the pages of this
report to see the new reinvented Beer Store.
We added a sixth element to the experience and that has to do with culture change
supported by training. To make the new experience come to life it is important to have
our employees engaged with customers and trained as beer experts. Extensive product
knowledge and service training is part of our promise to customers - to be Champions
of Beer Love Every Day. I am proud of our training program which has been expanded
to hundreds of front line staff. We are seeing great results with positive feedback from
customers and market share gains in all the new-look stores.
There are a few important things that will remain unchanged. While we are going through
important “bricks and mortar”changes and cultural evolution, we still hold true to our
core values like, responsible sale, environmental leadership, operational excellence, and
most important of all; health and safety. As a responsible retailer of beer, our employees
have done a superb job checking for ID for anyone 25 or under. Not to be forgotten, we
also continue to stand behind our passionate commitment to the community with another
record year of donations for our annual Returns for Leukemia Bottle Drive – a feat only
achieved with the help of hundreds of volunteers donating much of their personal time.
As far as growing our business goes, 2013 was another record year for unprecedented
selection as the Beer Store repertoire reached over 100 brewers and 400 brands while
collecting over a billion dollars in revenue for important government programs.
This was the year of big changes for the Beer Store, and while change is not always
easy, we are successfully moving forward due to the dedication and determination of our
hard-working employees who rose to the challenge. The Beer Store is well positioned for
future growth opportunities in 2014 and beyond.
Thanks,
Ted
Retail Strategy
CUSTOMERS WANT CHANGE
Through extensive research, including interviews and on-site
intercepts, it is clearly apparent that customers are not only
passionate about their beer but they are also looking for more from
the Beer Store each time they visit a store or visit us on-line. The
traditional store with empties returns on one side and a stainless
steel counter to order beer on the other, where beer is pushed
along rollers from the back of the store, does not meet the needs
of an up and coming passionate beer lover of today. Modern
technology, growth in brands and types of beers coupled with the
desire to explore, try and experience new ways of shopping means
something had to change. The Beer Store recognized that their
future depends on being able to adapt and be relevant to the new
consumer of beer.
Retail Strategy
SEIZING THE OPPORTUNITY
In early 2013, the Beer Store introduced a retail renovation program involving an innovative interior design and new
approach to retailing. The Beer Store decided that status quo was not an option and it was imperative to take immediate
action to gain back customer loyalty and sales. The formula for success was to WIN…win by providing the right beer
for every occasion…win by having larger pack sizes at cheaper prices…win by expanding self serve opportunities...win
by continuing to be an environmental champion accepting all empty alcohol containers and related packaging…win by
being trained experts in beer.
Discriminating customers demand great service, great product selection, great prices, friendly and helpful employees,
all wrapped into an overall store experience that make them feel good about their visit to the Beer Store. The pathway to
success for the Beer Store is to create a memorable shopping experience with fully trained and knowledgeable staff that
customers will recommend to others.
Beer Store Operational Report 2013 3
Beer Store Operational Report 20134Retail Strategy
A NEW BRAND IDENTITY
The foundation of change begins with a new brand identity. A new
name, a distinctive look and a unique personality that communicates
that a transformation has occurred. Whenever a brand change occurs,
the fundamental message and expectation of customers is that a new
experience in is the offering and the experience starts as soon as they
walk through the front doors. The new ‘Beer Store’ logo is clean, fresh
and contemporary with a colourful ‘B’ graphic signifying a glass of beer
with a head of foam on top. The background gray colour tone provides a
distinctive back-drop for the new identity.
BEING “CHAMPIONS OF BEER LOVE EVERY DAY”
The evolution of the brand includes a change in the overall employee mindset…a wholesale change in the company’s
culture. Attracting and retaining customers is a top priority and our employees need to be relevant and helpful at all
times. The new mantra ‘Being Champions of Beer Love Every Day’ speaks to this new attitude . It’s about confidence in
knowing our business, being passionate about it and consistently applying and sharing our knowledge and expertise in
everything we do.
A NEW RETAIL EXPERIENCE
There are two key ways the Beer Store will deliver on its new experiential mandate:
1.	 To continue building new self serve stores with separate empties rooms.
2.	 To renovate and refresh the exteriors and interiors of existing stores to the new Beer Store design.
The process of this retail transformation began in 2013 with the renovation of 17 stores and the opening of 3 new self
serve stores with plans to continue this development over the next few years.
5Beer Store Operational Report 2013 Retail Strategy
FIRST IMPRESSIONS ARE LASTING ONES
When entering the renovated store, customers are presented with a colourful interior set on background tones of gray
and orange. The décor includes striking highlights throughout with a mix of rural elements like, natural pine combined
with modern flare using stainless steel, coloured metal accents and illuminated posters and signs. The ambient music
sets the mood while fully trained staff approach customers and are ready and willing to help out and respond to
questions on beer and service.
THE INVITATION – MEET BEER
The new retail experience begins as customers stand in the parking lot or sidewalk. Customers immediately see a new
colour scheme, a new logo, illuminated Cold Beer signs and colourful ‘Meet Beer’ marketing messages. The ‘Meet Beer’
marketing message starts with posters displayed in the front windows and is carried through to the inside of the store.
This message speaks an open invitation for customers to become acquainted or re-acquainted with beer. To make beer
relevant to any occasion, like when serving with different foods, or when watching their favourite sporting activity or
perhaps participating in a special occasion with family or friends.
Beer Store Operational Report 20136Retail Strategy
THE ‘BEER FRIDGE’
‘Cold’ and ‘Beer’ naturally go together. In newly renovated stores
customers are reminded of the chilled product waiting behind the doors
labeled appropriately as the ‘BEER FRIDGE’ zone.
AN IMPROVED SHOPPING EXPERIENCE
In many renovated stores, a double-sided central lobby fixture allows customers to either shop for single cans, search for
new products to the store, or browse through the some hats, glassware, openers and other beer related items.
The digital touch-screen tablets modernize the menu board of brands and packs sold in the store.
NAVIGATION ZONES
New self serve stores have an empties return zone that is clearly separated from the shopping zone. The bright orange
wall graphic with the words ‘Empties Exchange’ reminds customers to prepare their empties for a deposit return. Special
wall graphics and marketing messages guide customers to sort their empties for faster service and more efficient
recycling.
Depending on the store type, customers are drawn to the point of purchase by a visual eyebrow canopy lined with
natural pine with hanging orange pendant lights. The down-to-earth wood décor decorates the face of the counters in
this area differentiated from the empties counter which has a modern gray tone.
7Beer Store Operational Report 2013 Retail Strategy
EMPLOYEE TRAINING IS KEY
To meet the demands of customers and to be relevant to the new retail environment, the Beer Store developed and
implemented a Quality Customer Service program that focuses on increasing the level of engagement with customers
through questioning and listening skills.
The training course covers extensive product knowledge of the 4 main ingredients of beer including how to properly
pour and taste product. Included in the classroom are food pairings to allow employees to gain additional knowledge so
they are experts in the field.
The goal is to have all retail employees trained and ready to deliver a great experience in all stores.
IMPORTANCE OF COMMUNITY
It is a privilege to be able to sell beer responsibly
and accept empty returns in communities across
Ontario. The Beer Store feels very much like a
resident and partner in protecting the well-being
of the communities in which it operates. To sell
beer responsibly in any Ontario community,
the Beer Store implements a strict ‘WE ID25’
program challenging customers to be of legal
age. The Beer Store recognizes the greatness
of every city, town and suburb it has a store in
and shows this with new exterior signs giving
recognition to the name of the community.
8 Beer Store Operational Report 2013Retail Strategy
“The pathway
to success is
clear: create
a memorable
shopping
experience with
fully trained
employees
under a new
brand name.”
Being Part of a Community
OUR COMMITMENT TO RESPONSIBLE SERVICE
At the Beer Store responsible service is implemented in a number of ways. First and foremost, the company maintains a
strict set of operational policies designed to ensure that minors or intoxicated individuals do not have access to alcohol.
RESPONSIBLE SALES POLICIES:
•	 Request ID from anyone who appears to be 25 years old or under
•	 Refuse service to anyone who appears to be intoxicated
•	 Mandatory annual responsible service training for all sales staff
•	 Mystery shop program to ensure compliance with policies
•	 Store level responsible service results incorporated into store manager
performance reviews
Year Challenge Type Challenged Refused
2012 Intoxicants 25,598 19,807
2012 Minors 3,513,748 47,523
2013 Intoxicants 20,770 16,270
2013 Minors 3,573,333 42,750
“Arrive Alive DRIVE SOBER remains grateful for The Beer Store’s ongoing support in the battle against impaired driving
in Ontario, and we are pleased for the chance to collaboratively educate the public on ways to prevent impaired driving.
Ontario’s roads are among the safest in all of North America; this accomplishment would not have been possible without
your constant support.”					
									- Arrive Alive
RESPONSIBLE SERVICES MESSAGING:
TBS incorporates responsible service messaging into many of its marketing initiatives to ensure that customers enjoy
beer responsibly.
•	 In-store Posters
•	 Media Advertising
•	 Partnership with Arrive Alive
9Beer Store Operational Report 2013 Being Part of a Community
Giving BackThe Beer Store is dedicated to community involvement and fundraising activities for charitable groups and actively
participates in dozens of events, big and small, throughout many communities in Ontario.
The Annual Returns for Leukemia Bottle Drive brings together thousands of volunteers from 447 stores and 8
Distributions Centers, our Head Office as well as friends and family for a two day fundraising event. In addition to the
annual Bottle Drive, hundreds of employees have organized numerous other fundraising events around the Province.
There is Curling for a Cure, Bowling for Leukemia, Bikes N’ Beers, Waterfront Marathon and Light the Night Walk to name
a few. Together, the Leukemia and Lymphoma Society of Canada and the Beer Store in partnership with UFCW Local
12R24, the Union that represents our employees and 4,000 volunteers, we raised:
$1.7 million in 2013 and over $7.8 million the past 8 years!
•	 Activities ranging from coin boxes in stores, assisting bottle drives, donating time to help others
•	 UFCW Local 12R24 – TBS Partnership
•	 Province-wide Bottle Drive (May 25-26, 2013)
BOTTLE
DR VE
LEUKEM A
RETURNS FOR
OTHER TBS COMMUNITY AND CHARITABLE INITIATIVES
ROGERS HOUSE
Roger’s House is the legacy that
was created in Roger Neilson’s
honour by the Ottawa Senators
Foundation in collaboration with
The Children’s Hospital of Eastern Ontario, the Ontario
Ministries of Health and Children and Youth Services.
The overwhelming contribution and support of the Ottawa
community made the dream of Roger’s House a reality.
Beer Store locations in the Eastern Ontario area raise
money each year to support the families of sick children/
youth.
TERRY FOX
The Foundation not only
raises money for research,
but it also continues to
share the story of Terry Fox. The Terry Fox Foundation
strives to maintain the heroic effort and integrity that Terry
embodied. The Beer Store supports the cause by donating
money from bottle drives and dollar donations within
certain regions of the province.
ARRIVE ALIVE,
DRIVE SOBER
The Beer Store is
committed to keeping the streets of Ontario safe and
free from impaired driving. Through their partnership
the Beer Store and Arrive Alive DRIVE SOBER provide
wleadership and programs to eliminate impaired driving
and enables people and communities to share resources
and information that will prevent injuries and save lives.
ROYAL CANADIAN LEGION (POPPIES)
As a national organization,
The Royal Canadian Legion
operates programs and
services at all levels that aim to
help more than just Veterans. On a daily basis, members
provide their time and efforts to better the lives of many,
and to ensure Remembrance continues across Canada.
The Beer Store supports the annual poppy campaign at
locations across the province.
RETURNS FOR LEUKEMIA
Beer Store Operational Report 201310Giving Back
11Beer Store Operational Report 2013 Environmental Performance
Environmental Performance
DEPOSIT RETURN: DRIVING THE GREEN ECONOMY	
2012-2013
Glass
Reuse
Clear Glass
Bottle
Recycling
Coloured
Glass Bottle
Recycling
Aluminum
Recycling
Steel
Recycling
PET
Mixed
Plastic
Total
Diversion
tBS Tonnes Diverted 249,615 15,042 35,196 8,389 253 - 934 309,429
ODRP Tonnes
Diverted
- 35,173 75,125 924 - 1,031 - 112,253
Total Tonnes Diverted 249,615 50,215 110,321 9,313 253 1,031 934 421,682
TABLE 1: TBS AND ODRP LANDFILL DIVERSION*
TABLE 2: TBS & ODRP AVOIDED GHG EMISSIONS AND AVOIDED ENERGY CONSUMPTION
2012-2013
Glass
Reuse
Clear Glass
Bottle
Recycling
Coloured
Glass Bottle
Recycling
Aluminum
Recycling
Steel
Recycling
PET
Total
Diversion
TOTAL Tonnes Diverted 249,615 20,215 110,321 9,313 253 1,031 420,748*
Avoided GHG Emissions
(MTC02E)
94,854 5,524 6,068 89,964 301 3,753 200,462
Avoided Energy
(Gigajoules)
1,697,382 84,361 120,250 813,584 3,190 87,955 2,806,722
Combined, the Beer Store returns and ODRP programs represent the largest beverage container diversion system in
Canada. In 2012-2013, the Beer Store and ODRP deposit programs:
•	 Combined avoided 200,462 tonnes of GHG emissions – equivalent to taking over 41,700 cars and trucks off Ontario
roads.
•	 Combined, these programs avoided over 2,806,722 gigajoules of energy – equivalent to over $49 million of oil.
•	 Combined, these programs diverted 446,000 tonnes of material – equivalent to almost 50% of all materials collected
through the Blue Box program.
*Note: Only includes diversion associated with beverage alcohol containers. Does not include secondary packaging
diversion.
*Note: This number does not include “mixed plastic”, so the number does not exactly match the diversion total in Table 1
above.
Beer Store Operational Report 201312Environmental Performance
41,700CARS & TRUCKS
$49M
50%
OF
OIL
OF THE
BLUE BOX
MATERIALS
The combined avoided
GHG emissions between
the ODRP and Beer
Store deposit programs
totals 200,462 tonnes.
This is equivalent to
taking 41,700 cars and
trucks off Ontario roads.
Combined, these
programs avoided over
2,808,722 gigajoules of
energy - equivalent to
over $49 million of oil.
Combined, these
programs diverted
446,000 tonnes of
material - equivalent
to almost 50% of all
materials collected
through the Blue Box
program.
13Beer Store Operational Report 2013 Environmental Performance
TABLE 3: TBS CONTAINER SALES AND RECOVERY BY CONTAINER TYPE (BEER)
Tables cover the period April 30, 2012 - April 28, 2013, except for cans which cover the period May 6, 2012 - May 4, 2013.
Container Type
tBS Sales
(units)
LCBO Sales
(units)
Return
(units)
System
Recovery
Rate
2012-2013
System
Recovery
Rate
2011-2012
All Glass Bottles (Refillable & Non-
Refillable)
1,064,669,974 141,087,954 1,179,967,701 97.9% 99.1%
Refillable Bottles: Industry Standard
Bottle (ISB) and Non-Standard
946,941,989 98,619,492 1,026,348,158 98.2% 99.1%
Non-Refillable Bottles 117,727,985 42,468,462 153,619,543 95.9% 99.5%
Metal Cans 451,339,283 204,800,336 538,408,313 82.1% 83.1%
Kegs 1,393,286 - 1,410,796 101.3% 100.9%
PET Bottles 39 - 0 0.0% 0.0%
TOTAL (By Units) 1,517,402,582 345,888,290 1,719,786,810 92.3% 94%
TABLE 4 – ODRP CONTAINERS: SALES & RECOVERY
April 30, 2012 – April 28, 2013, Except for cans which cover the period May 6, 2012 – May 4, 2013.
Sales in Units Returns in Units Recovery rate
Container Type
Small
Containers
Large
Containers
Small
Containers
Large
Containers
Small
Containers
2013
Small
Containers
2012
Large
Containers
2013
Large
Containers
2012
Combined
2013
Combined
2012
GLASS 76,176,118 190,332,780 56,324,655 168,689,888 74% 74% 89% 90% 84% 85%
PET 18,913,553 11,281,539 8,212,140 7,379,831 43% 44% 66% 63% 52% 51%
TETRA/BIB 159,617 7,820,764 79,902 2,327,981 50% 108% 30% 31% 30% 32%
SUBTOTAL 95,249,288 209,435,083 64,616,697 178,397,700 68% 68% 85% 86% 80% 81%
CANS* 72,563,490 59,542,613 82.1% 83%
GRAND
TOTAL
377,247,861 302,557,010 80.2% 80.7%
For a detailed report please see the Beer Store’s annual Stewardship Report at
http://www.thebeerstore.ca/tbs-environmental-report.html
The Beer Store packaging management system includes the collection of all beer containers sold by the Beer Store
via either retail or wholesale channels and the collection of all related packaging. This includes beer containers sold at
the LCBO retail outlets and agency stores throughout rural and northern Ontario, and beer containers sold in Ontario
bars and restaurants.
Beer Store Operational Report 201314Healthy & Safety
LOST TIME ACCIDENT FREQUENCY - ANNUAL IMPROVEMENT
Health & Safety
WE ARE CHAMPIONS OF HEALTH & SAFETY
Health & Safety are currently testing these
mechanical devices used for keg handling.
The Power MateMagliner
0
5
10
2003 2004 2005 2006 2007 2008 2009 2010 2011 2012 2013
Beer Store Total Company
Beer Store management know that a healthy and safe
workforce is key to achieving success in both the retail and
logistics divisions of the company. They also know it’s key to
continued employee satisfaction. That is why the Beer Store
maintains an ongoing effort to ensure that employees feel safe
at work and that they arrive home each day as healthy as when
they left.
The company is making continuous improvements every year
driven by supportive dialogue to exchange concerns and learn
better ways of doing things and by ongoing experimentation
with new ideas and better techniques.
I. PRODUCT SELECTION
The Year in Beer Sales
The Beer Store has an open listing policy meaning that any Brewer around the world wanting to sell product in the
system can do so. The Beer Store stocks over 400 brands from 100 brewers from many different countries. In 2013, 69
new brands and 12 new brewers were introduced into the Beer Store system.
BEER STORE BREWER FACTS:
The Beer Store stocks a wide assortment of beer products from brewers both
large and small. Over 30% of the Beer Store brands are produced by Ontario
brewers and the remainder are produced outside of Ontario by both large and
small breweries from other provinces in Canada and around the world.
1
Refers to Ontario brewers whose products are eligible for reduced Ontario beer tax rates or Ontario beer tax credits (i.e. annual production of less
than 150,000hl).
2
Out-of-province brewers refers to Canadian brewers whose majority of Beer Store sales volume is supplied from breweries located in provinces
other than Ontario.
Import
Out of Province
Ontario
60%
11%29
%
Import
Out of Province
Ontario
60%
8
%
32%
2012 Brewer Segments
2013 Brewer Segments
2012 2013
Total number of brewers 93 115
Ontario based brewers 27 28
Small Ontario Brewers1
22 23
Out of Province Brewers2	
10 10
Import Brewers 56 77
Brewing Countries of Origin 23 22
Brewers selling more than 200,000hl 5 4
Brewers selling between 75,000hl and 200,000hl 4 5
Brewers selling less than 75,000hl	 84 95
The Year in Beer Sales15Beer Store Operational Report 2013
Beer Store Operational Report 201316The Year in Beer Sales
3
Please note annual Beer Store home consumer prices from previous Operational Reports for the years F2004 to 2012 have been corrected. These
prices were slightly overstated in the 2012 Operational Report due to a methodological error.
II. SALES BY VALUE AND BEER PRICES
AVERAGE BEER STORE HOME CONSUMER SELLING PRICE PER LITRE INCLUDING SALES TAXES
(EXCLUDING DEPOSITS)3
Average home consumer selling price increased by $.06 per litre or by 1.5% in comparison to 2012.
In relation to Ontario inflation, Beer Store average home consumer selling prices over the last decade have
declined by 13.6%.
$3.88	
   $3.88	
  
$3.78	
  
$3.77	
  
$3.79	
  
$3.86	
  
$3.88	
  
$3.91	
  
$4.01	
  
$4.07	
  
$3.60	
  
$3.65	
  
$3.70	
  
$3.75	
  
$3.80	
  
$3.85	
  
$3.90	
  
$3.95	
  
$4.00	
  
$4.05	
  
$4.10	
  
2004	
   2005	
   2006	
   2007	
   2008	
   2009	
   2010	
   2011	
   2012	
   2013	
  
Average TBS Home Consumer Price Converted to Case
Equivalent
$37.92
$33.31
$31.77
$30.00
$32.00
$34.00
$36.00
$38.00
$40.00
F2004F2005 2006 2007 2008 2009 2010 2011 2012 2013
Inflation Average Price
AVERAGE BEER STORE HOME CONSUMER PRICE CONVERTED TO CASE EQUIVALENT
17Beer Store Operational Report 2013 The Year in Beer Sales
Beer Store beer prices are also very competitive in relation to other Canadian jurisdictions. For 2013, the Beer Store
commissioned a study comparing Beer Store prices to those at Quebec grocers. The study conducted by Navigant
Economics represents the most comprehensive examination of Quebec beer prices ever published. It compiled data on
beer sales for the entire year from Quebec’s seven largest grocery chains4
.
The report found that on average Ontario Beer Store consumers paid 1.9% less than beer consumers at Quebec grocery
stores, despite the fact that Ontario beer taxes are much higher than those in Quebec. In fact, Navigant calculated that
the Beer Store average price with taxes excluded was actually 18% less than Quebec’s average grocery price in 2013.
Low prices despite high taxes show that Ontario consumers are benefiting from the efficiencies of the Beer Store retail
system. A comparison of beer prices across Canada shows that Beer Store prices are significantly lower than provinces
with comparable tax rates.
AVERAGE BEER RETAIL SELLING PRICE PER LITRE 2013: SELECTED PROVINCES
$43.10
$43.62
$42.80
$40.76
$33.96
$33.31
$41.82
$41.17
$38.38
$39.77
$30.00
$32.00
$34.00
$36.00
$38.00
$40.00
$42.00
$44.00
$46.00
NFLD PEI NS NB QUE ONT MB SK AB BC
PerCaseEquivalentPrice
4
Aron, Debra J, Ph.D. “The Price of Beer in Ontario and Quebec” Navigant Economics, May 2014 available at http://www.ontariobeerfacts.ca/studies
Beer Store Operational Report 201318The Year in Beer Sales
III. BEER STORE SALES BY CHANNEL
The Beer Store is both a retail and wholesale business. As the following chart indicates the Beer Store operates 447
stores (as of December 2013) in an Ontario beverage alcohol system that includes 1,378 outlets where beer can be
purchased.
ONTARIO RETAIL BEER OUTLETS
BEER STORE HOME CONSUMER VOLUME SALES
BEER STORE PERCENTAGE SALES BY CHANNEL
2009 2010 2011 2012 2013
Beer Stores 436 437 438 443 447
Beer Store Mobile Trailers 2 2
LCBO Stores 607 611 617 623 639
LCBO Agency Stores &
Beer Store Retail Partners
216 216 217 214 217
On-site Brewery Stores 39 39 43 45 73
TOTAL 1,298 1,303 1,315 1,327 1,378
2009 2010 2011 2012 2013
Home Consumer 64.70% 64% 63.86% 63.97% 63.93%
Licensee 19.40% 18.80% 18.72% 18.45% 18.20%
LCBO 10.80% 12.00% 12.13% 12.26% 12.54%
Retail Partner/Agency 4.40% 4.60% 4.59% 4.61% 4.60%
Other 0.70% 0.70% 0.71% 0.72% 0.73%
Store numbers for LCBO Stores, on-site brewery stores and Agency and Beer Store Retail Partners for 2013 are provided
by the LCBO. Beer Store store numbers for all years are from Beer Store data as of December 31st
for that year.
4
4.1
2009 2010 2011 2012 2013
4.2
4.3
4.4
4.5
4.6
4.7
4.8
Hectolitre(millions)
BEER STORE LICENSEE SALES
BEER STORE WHOLESALE SALES
BEER STORE RETAIL PARTNER/AGENCY SALES
BEER STORE LCBO SALES
In addition to selling beer to the public through its retail stores, the Beer Store also distributes and sells beer to LCBO
stores, agency stores and Beer Store Retail Partner stores as well as 19,656 licensed bars and restaurants.
Beer Store Wholesale Volume Sales Trends:
•	 Overall wholesale sales in 2013 decreased by
57,704 hl or 2.29%
•	 Total licensee sales declined by 50,022 hl or
3.80%
•	 Licensee packaged beer sales declined by
40,708 hl or 6.57%
•	 Licensee draught beer sales declined by 	
9,314 hl or 1.34%
•	 Sales to LCBO increased by 530 hl or 0.06%
•	 Agency Store/Retail Partner sales decreased by
8,212 hl or 2.50%
19Beer Store Operational Report 2013 The Year in Beer Sales
100,000
200,000
300,000
400,000
500,000
600,000
700,000
800,000
900,000
1,000,000
2009 2010 2011 2012 2013
Draught Packaged
50,000
0
100,000
150,000
200,000
250,000
300,000
350,000
400,000
2009 2010 2011 2012 2013
0
100,000
200,000
300,000
400,000
500,000
600,000
700,000
800,000
900,000
1,000,000
2009 2010 2011 2012 2013
HectolitresHectolitres
Hectolitres
Beer Store Operational Report 201320
Beer Tax Contributions
FEDERAL AND PROVINCIAL BEER TAX CONTRIBUTIONS 2013
TAX EXAMPLES BY PRICE POINT 2013 :
Retail Price Federal Tax Provincial Tax Total Tax
24-Discount Bottles at Minimum Social
Reference Price
$27.55 13.7% 34.3% 48.0%
Average tBS Home Consumer Price (all
packages) Converted to Case Equivalent $33.31 12.1% 31.9% 44.0%
24-Cans at Top 10 Brand Price $37.90 11.4% 33.3% 44.8%
24-Bottles Premium Priced Import $43.10 10.2% 28.9% 39.0%
24-Bottles Ontario Small Brewery
(Producing 15,000hl annually)
$43.40 6.3% 14.9% 21.2%
Federal Excise Tax $0.3122/litre
Provincial Basic Tax/LCBO Mark-up5
Ontario Beer Manufacturer Ontario Microbrewers
Draught $0.5810/litre $0.2161/litre
Packaged $0.7402/litre $0.2403/litre
Volume Levy $0.176/litre
Enviro Levy $0.0893/container
HST 13%
5
Rates in effect for March 1st each year. Under the authority of the Alcohol and Gaming Regulation and Public Protection Act, 1996, basic beer tax
rates for draught and packaged beer are increased on March 1st each year by the annual average amount of Ontario CPI increase from the previous
three years.
Beer Tax Contributions
21Beer Store Operational Report 2013 Beer Tax Contributions
ONTARIO TAXES COLLECTED ON BEER SALES (2013)
Provincial commodity taxes include revenues associated with the basic beer tax, volume levy and environmental levy
remitted by brewers to the Ministry of Finance and equivalent LCBO charges on beer. Estimates of tax revenues for Beer
Store and LCBO beer sales exclude sales to each other. LCBO volumes for calendar 2013 from Quarterly Reports. Tax
estimates do not include foregone government revenues associated with reduced small brewer tax rates and related
tax credits. The Ontario government does not publish any information related to aggregate spending related to these
programs.
Government Revenues Associated with Beer Store Beer Sales 2013
Provincial Commodity Taxes $598.4 Million
Federal Excise Taxes $188.9 Million
Goods and Services Tax (Federal Portion of HST) $113.2 Million
Provincial Sales Tax (Provincial Portion of HST) $181.1 Million
Total Government Beer Taxes Associated with tBS Sales $1,081.6 Million
Other Government Beer Tax Revenues
(LCBO Sales, On-Site Beer Stores, Licensee Sales)
2013
Provincial Commodity Taxes $205.4 Million
Federal Excise Taxes $60.3 Million
Retail GST (Federal portion of HST) $41.5 Million
Retail PST (Provincial portion of HST) $63 Million
GST on Licensee Resale (Federal portion of HST) $87.4 Million
PST on Licensee Resale (Provincial portion of HST) $139.9 Million
Non-Beer Store Total $597.5 Million
Total Ontario Beer Commodity and Sales Taxes $1,679 Million
Beer Store Operational Report 201322Rate Sheet
SCHEDULE C
BRI RATE SHEET
EFFECTIVE APRIL 29, 2013
BASIC SERVICES
First Next Remaining
25,000 hl 50,000 hl Volume
Packaged $46.70 $52.05 $53.10 per hl
Draught $39.35 $43.74 $43.90 per hl
Accounts Receivable Recovery $0.50 $0.50 $0.50
per licensee
hl only
LISTING ADMINISTRATION FEE
Base Fee +
Per store, Per
SKU, First 233
stores
All other
stores
above 233
All “D”
Stores
Packaged $2,848.93 $227.92 $53.56 $535.63
Draught $5,697.86 $455.82
ELECTED SERVICES
TRANSFERS
Emergency $26.28 per hl
Regular $21.76 per hl
DELIVERY SERVICE TO LCBO $21.76 per hl
DELIVERY SERVICE TO RETAIL PARTNERS $21.76 per hl
EMPTY CONTAINER DISPOSAL
Bottles (Service fee currently under review)
Cans
$5.85
$2.60
per hl
per hl
OLD CODE DISPOSAL T.B.D.
VOUCHER ADMINISTRATION 5% of retail
value
EMPTY CONTAINER PURCHASE
This charge applies to all products sold through the
LCBO where the empty containers are redeemed by
BRI. The charge is based on LCBO supplied sales
data.
$7.30 per hl
NON-STANDARD CONTAINERS
Industry Standard Bottles, Kegs and Cans which do
not require sorting or special handling are exempt from
this charge
Packaged
Draught
$0.0499
$1.43
per unit
per unit
KEG REPAIR SURCHARGE $0.59 per usage
DIRECT DELIVERY KEG FEE $4.49 per hl
DRAUGHT BEER Non-Palletized Shipments
Return of Empty Containers
T.B.D.
T.B.D.
NOTE: GST/HST OR EQUIVALENT WILL BE ADDED TO ALL FEES WHERE APPLICABLE
OTHER FEES
Other fees include (but are not limited to) Liability Insurance required by the government and special services which the Brewer may
engage BRI to perform from time to time. Deposits for the use of BRI pooled assets (e.g. kegs and pallets) will be levied as
appropriate. Deposits will be refunded as the assets are returned.
Rate Sheet
23Beer Store Operational Report 2013 Financial Statements
Brewers Retail Inc.
Financial Statements
December 31, 2013
(in thousands of Canadian dollars)
Beer Store Operational Report 201324Financial Statements
PricewaterhouseCoopers LLP
PwC Tower, 18 York Street, Suite 2600, Toronto, Ontario, Canada M5J 0B2
T: +1 416 863 1133, F: +1 416 365 8215
“PwC” refers to PricewaterhouseCoopers LLP, an Ontario limited liability partnership.
March 20, 2014
Independent Auditor’s Report
To the Shareholders of
Brewers Retail Inc.
We have audited the accompanying financial statements of Brewers Retail Inc., which comprise the
balance sheet as at December 31, 2013 and the statements of operations and deficit and cash flows for the
period from December 31, 2012 to December 31, 2013, and the related notes, which comprise a summary
of significant accounting policies and other explanatory information.
Management’s responsibility for the financial statements
Management is responsible for the preparation and fair presentation of these financial statements in
accordance with Canadian accounting standards for private enterprises, and for such internal control as
management determines is necessary to enable the preparation of financial statements that are free from
material misstatement, whether due to fraud or error.
Auditor’s responsibility
Our responsibility is to express an opinion on these financial statements based on our audit. We conducted
our audit in accordance with Canadian generally accepted auditing standards. Those standards require
that we comply with ethical requirements and plan and perform the audit to obtain reasonable assurance
about whether the financial statements are free from material misstatement.
An audit involves performing procedures to obtain audit evidence about the amounts and disclosures in
the financial statements. The procedures selected depend on the auditor’s judgment, including the
assessment of the risks of material misstatement of the financial statements, whether due to fraud or
error. In making those risk assessments, the auditor considers internal control relevant to the entity’s
preparation and fair presentation of the financial statements in order to design audit procedures that are
appropriate in the circumstances, but not for the purpose of expressing an opinion on the effectiveness of
the entity’s internal control. An audit also includes evaluating the appropriateness of accounting policies
used and the reasonableness of accounting estimates made by management, as well as evaluating the
overall presentation of the financial statements.
We believe that the audit evidence we have obtained is sufficient and appropriate to provide a basis for our
audit opinion.
25Beer Store Operational Report 2013 Financial Statements
Opinion
In our opinion, the financial statements present fairly, in all material respects, the financial position of
Brewers Retail Inc. as at December 31, 2013 and the results of its operations and its cash flows for the
period from December 31, 2012 to December 31, 2013 in accordance with Canadian accounting standards
for private enterprises.
Chartered Professional Accountants, Licensed Public Accountants
Beer Store Operational Report 201326Financial Statements
Brewers Retail Inc.
Balance Sheet
(in thousands of Canadian dollars)
The accompanying notes are an integral part of these financial statements.
Approved by the Board of Directors
__________________________________ Director _________________________________ Director
December 31,
2013
$
December 30,
2012
$
Assets
Current assets
Cash and cash equivalents (note 4) 34,018 51,395
Accounts receivable
Brewers (note 12) 5,840 8,214
Others (note 12) 40,235 45,164
Empties deposits 3,182 3,242
Inventories (note 5) 147,277 137,936
Prepaid expenses and deposits 2,539 2,080
233,091 248,031
Property and equipment (note 6) 123,416 128,250
Intangible assets (note 7) 8,399 3,661
Future income tax assets (note 13) 11,710 14,000
Pension benefit asset (note 8) 114,462 111,511
491,078 505,453
Liabilities
Current liabilities
Accounts payable and accrued liabilities
Brewers (notes 9 and 12) 195,398 195,540
Other (note 9) 105,570 98,107
300,968 293,647
Accrued benefit liability (note 8) 78,725 98,032
379,693 391,679
Shareholders’ Equity
Capital stock (note 10) 200,367 200,382
Deficit (88,982) (86,608)
111,385 113,774
491,078 505,453
Commitments and contingencies (note 11)
27Beer Store Operational Report 2013 Financial Statements
Brewers Retail Inc.
Statement of Operations and Deficit
(in thousands of Canadian dollars)
The accompanying notes are an integral part of these financial statements.
Period from
December 31,
2012 to
December 31,
2013
$
Period from
January 2,
2012 to
December 30,
2012
$
Revenue
Service charges (note 12) 298,983 301,705
Other 87,320 83,615
386,303 385,320
Expenses
Operating (note 12) 349,027 359,138
Administration 6,214 6,416
Amortization (notes 6 and 7) 18,326 18,248
373,567 383,802
Income before income taxes 12,736 1,518
Provision for (recovery of) future income taxes (note 13) 2,290 (2,000)
Net income for the period 10,446 3,518
Deficit - Beginning of period (86,608) (88,608)
Premium on redemption of shares (note 10) (12,820) (1,518)
Deficit - End of period (88,982) (86,608)
Beer Store Operational Report 201328Financial Statements
Brewers Retail Inc.
Statement of Cash Flows
(in thousands of Canadian dollars)
The accompanying notes are an integral part of these financial statements.
Period from
December 31,
2012 to
December 31,
2013
$
Period from
January 2,
2012 to
December 30,
2012
$
Cash provided by (used in)
Operating activities
Net income for the period 10,446 3,518
Add (deduct): Non-cash items
Amortization 18,326 18,248
Future income taxes 2,290 (2,000)
Defined benefit plan expenses (note 8) 32,774 33,292
Change in accrued benefit liability (19,307) 5,755
Gain on disposal of property and equipment (note 6) (5,811) (5,528)
Defined benefit plan contributions (note 8) (35,725) (23,273)
2,993 30,012
Change in non-cash operating working capital balances (note 17) 1,545 (5,723)
4,538 24,289
Investing activities
Purchase of property and equipment (note 6) (17,369) (17,066)
Proceeds on sale of property and equipment (note 6) 8,289 8,151
(9,080) (8,915)
Financing activities
Redemption of shares (12,835) (1,520)
Increase (decrease) in cash and cash equivalents during the
period (17,377) 13,854
Cash and cash equivalents - Beginning of period 51,395 37,541
Cash and cash equivalents - End of period 34,018 51,395
29Beer Store Operational Report 2013 Financial Statements
Brewers Retail Inc.
Notes to Financial Statements
December 31, 2013
(in thousands of Canadian dollars)
(1)
1 Description of business
Brewers Retail Inc. (the company) is owned by three brewers: Molson Canada 2005, Labatt Brewing Company
Limited, and Sleeman Breweries Ltd. (collectively the Brewers or shareholders) and, pursuant to an operating
agreement, acts as a sales centre for the products of the Brewers in the Province of Ontario.
In 2013, the company changed its fiscal year-end to coincide with the calendar year. Accordingly, the fiscal 2013
ended December 31, 2013.
2 Summary of significant accounting policies and basis of presentation
The financial statements have been prepared in accordance with Canadian accounting standards for private
enterprises as issued by the Canadian Accounting Standards Board, and they have been applied within the
framework of the significant accounting policies summarized below.
Revenue recognition
Service charges revenue is primarily earned based on the volume of products distributed at rates determined
annually. The difference, if any, between service charges revenue and costs and expenses incurred is allocated
among the owner-breweries in accordance with the terms of the shareholders’ agreement and recorded as an
adjustment to service charges revenue.
Other revenues consist of empty containers fee, recycling fee, product sale, promotional revenue, and
dispensing services. The revenue is recorded at the point where the service has been performed or the products
have been delivered.
Cash and cash equivalents
Cash and cash equivalents include cash on hand and highly liquid investments with a maturity of less than three
months from the date of acquisition. Short-term investments are recorded at cost plus accrued interest, which
approximates fair value.
Inventories
Inventories of beer are valued at cost, which equals the selling price. Related products inventory and dispensing
equipment are recorded at the lower of cost and net realizable value.
Empties deposits
Empties deposits represent the deposit value of empty containers collected and received.
Beer Store Operational Report 201330Financial Statements
Brewers Retail Inc.
Notes to Financial Statements
December 31, 2013
(in thousands of Canadian dollars)
(2)
Property and equipment
Property and equipment are recorded at cost less accumulated amortization and any impairment loss. The
company assesses property and equipment for recoverability whenever indicators of impairment exist. If the
carrying value of the asset exceeds the estimated net recoverable amount of the asset, then an impairment loss
is recognized to write the asset down to its fair value. Property and equipment are amortized over their
estimated useful lives on a straight-line basis as follows:
Buildings 40 years
Leasehold improvements over term of the leases
Machinery, equipment and operating system 3 - 20 years
Single aperture kegs 20 years
Pallets 4 years
Intangible assets
Software is carried at cost less accumulated amortization and accumulated impairment losses. Acquired
computer software is capitalized on the basis of the costs incurred to acquire licences and install the specific
software.
Amortization is calculated on the cost of the asset less its residual value. Software is amortized on a straight-line
basis over periods ranging from three to seven years. The amortization method, useful lives and residual values
are reviewed annually.
The company assesses software for recoverability whenever indicators of impairment exist. If the carrying value
of the asset exceeds the estimated net recoverable amount of the asset, then an impairment loss is recognized to
write the asset down to its fair value.
Pension costs
Pension costs are determined using actuarial methods. Net periodic benefit cost is charged to income and
includes:
i) the cost of pension benefits provided in exchange for employees’ services rendered during the year;
ii) the interest cost of pension obligations;
iii) the expected long-term return on pension fund assets;
iv) the amortization of prior service costs and amendments over the expected average remaining service life of
the employee group covered by the plans; and
v) the amortization of cumulative net actuarial gains and losses in excess of 10% of the greater of the
beginning of year balances of the projected benefit obligation or market-related value of plan assets, over
the expected average remaining service life of the employee group covered by the plans.
31Beer Store Operational Report 2013 Financial Statements
Brewers Retail Inc.
Notes to Financial Statements
December 31, 2013
(in thousands of Canadian dollars)
(3)
The pension plans are funded through contributions determined in accordance with the projected unit credit
actuarial cost method.
Post-retirement benefits other than pensions
The company accrues the cost of post-retirement benefits other than pensions using actuarial methods. These
benefits, which are funded as they come due, include life insurance programs, medical and dental benefits. The
company amortizes the cumulative net actuarial gains and losses in excess of 10% of the projected benefit
obligation at the beginning of the year, over the expected average remaining service life of the employee group
covered by the plan.
Post-employment benefits other than pensions
The company provides long-term disability benefits to active employees. These benefits, which are funded as
they come due, include salary continuation while the employees are deemed not to be physically and mentally
fit to perform the essential duties of their normal occupation. The company recognizes net actuarial gain and
losses immediately in income in the year they arise.
Income taxes
Income tax expenses for the year comprise current and future income taxes. Income taxes are recognized in the
statement of operations. Levies other than income taxes, such as taxes on real estate, are included in
administrative expenses.
 Current income taxes
Current income tax expense is based on the results of the period and is adjusted for items that are not
taxable or deductible. Current income taxes are calculated using income tax rates and laws that were
substantively enacted at the end of the reporting period. Management periodically evaluates positions
taken in the preparation and filing of income tax returns with respect to situations in which applicable
income tax regulations are subject to interpretation. Provisions are established, where appropriate, on the
basis of amounts expected to be paid to the tax authorities.
 Future income taxes
Future income taxes are recognized, using the liability method, on temporary differences arising between
the income tax bases of assets and liabilities and their carrying amounts in the financial statements. Future
income taxes are determined using income tax rates and laws that have been enacted or substantively
enacted by the balance sheet date and are expected to apply when the related future income tax asset is
realized or the future income tax liability is settled.
Future income tax assets are recognized only to the extent that it is probable that future taxable profit will
be available, against which the temporary differences can be utilized.
Beer Store Operational Report 201332Financial Statements
Brewers Retail Inc.
Notes to Financial Statements
December 31, 2013
(in thousands of Canadian dollars)
(4)
Future income tax assets and future income tax liabilities are offset when there is a legally enforceable
right to offset current income tax assets against current income tax liabilities and when the future income
tax assets and future income tax liabilities relate to income taxes levied by the same taxation authority and
when there is an intention to settle the balances on a net basis.
3 Critical accounting estimates and judgments
The preparation of these financial statements requires management to make estimates and judgments that
affect the reported and disclosed amounts of assets, liabilities, revenues and expenses in the financial
statements and accompanying notes. Management bases its estimates and judgments on historical experience
and on various other assumptions that it considers to be reasonable. The resulting accounting estimates will, by
definition, seldom equal the related actual results. Actual results could differ from those estimates under
different assumptions or conditions.
Impairment
The company reviews other non-financial assets when there is any indication that the asset might be impaired.
Employee future benefits
The present value of the retirement benefit obligation depends on a number of factors that are determined on
an actuarial basis using a number of assumptions. The assumptions used in determining the employee future
benefits expense include the discount rate. Any changes in these assumptions will impact the amount of the
employee future benefits obligation disclosed in the financial statements.
The company determines the appropriate discount rate at the end of each year. This is the interest rate that is
used to determine the present value of estimated future cash outflows expected to be required to settle the
employee future benefits obligation. In determining the appropriate discount rate, the company considers the
interest rates of high-quality corporate bonds that are denominated in Canadian dollars and have terms to
maturity approximating the terms of the related future benefit obligation.
Other key assumptions for the employee future benefits obligation are based on current market conditions.
Additional information is disclosed in note 8.
4 Cash and cash equivalents
Included in cash and cash equivalents is $107 (December 30, 2012 - $107) that has been pledged as collateral
on letters of credit of up to $500. The company has a bank overdraft facility of up to $150, of which $nil
(December 30, 2012 - $nil) is outstanding. The company holds a one-year guaranteed investment certificate of
$900 that will mature in 2014.
33Beer Store Operational Report 2013 Financial Statements
Brewers Retail Inc.
Notes to Financial Statements
December 31, 2013
(in thousands of Canadian dollars)
(5)
5 Inventories
December 31,
2013
$
December 30,
2012
$
Beer 144,896 135,520
Related products 499 367
Dispensing equipment 1,854 2,016
Keg repair materials 28 33
147,277 137,936
6 Property and equipment
December 31,
2013
December 30,
2012
Cost
$
Accumulated
amortization
$
Net
$
Net
$
Land 7,070 - 7,070 7,614
Buildings 106,640 47,870 58,770 60,243
Construction-in-progress 2,836 - 2,836 2,516
Leasehold improvements 57,024 28,951 28,073 26,449
Machinery, equipment and operating
system 55,313 32,932 22,381 25,821
Single aperture kegs 6,653 5,323 1,330 1,660
Pallets 7,219 4,263 2,956 3,947
242,755 119,339 123,416 128,250
The company disposed of assets with a net carrying value of $2,478 (December 30, 2012 - $2,623) for net
proceeds of $8,289 (December 30, 2012 - $8,151) and recognized a gain on sale of $5,811 (December 30, 2012 -
$5,528). An amortization expense of $17,413 (December 30, 2012 - $17,380) has been charged in amortization
expense.
7 Intangible assets
December 31,
2013
December 30,
2012
Cost
$
Accumulated
amortization
$
Net
$
Net
$
Software 2,901 1,781 1,120 2,033
SAP - construction-in-process 7,279 - 7,279 1,628
10,180 1,781 8,399 3,661
An amortization expense of $913 (December 30, 2012 - $868) has been charged in amortization expense.
Beer Store Operational Report 201334Financial Statements
Brewers Retail Inc.
Notes to Financial Statements
December 31, 2013
(in thousands of Canadian dollars)
(6)
8 Employee future benefits
The company maintains various defined contribution, defined benefit pension plans providing pension and
other retirement and post-employment benefits for both salaried and hourly paid employees. Costs for
employee future benefits are accrued over the periods in which employees earn the benefits. The company also
maintains certain post-employment medical benefit plans. A summary of the balance sheets and statements of
operations is shown below.
December 31, 2013 December 30, 2012
Defined
benefits
pension
plans
$
Other
post-
employment
$
Defined
benefits
pension
plans
$
Other
post-
employment
$
Accrued benefit obligation
Balance - Beginning of year 821,273 82,512 772,578 82,726
Plan amendments (1,943) (29,519) 4,988 -
Current service costs 13,573 3,062 14,319 6,467
Past service costs 6,000 - -
Interest cost 33,749 2,353 34,273 3,458
Settlement - (1,138) -
Actuarial loss (gain) (89,241) (6,595) 28,377 (6,341)
Benefits payments (34,332) (4,797) (33,262) (3,798)
Balance - End of year 749,079 45,878 821,273 82,512
Fair value of plan assets
Balance - Beginning of year 616,038 - 566,573
Actual return on plan assets 82,229 - 59,454
Benefit payments (33,711) (4,797) (33,262) (3,798)
Employer contributions 35,725 4,797 23,273 3,798
Balance - End of year 700,281 - 616,038 -
Funded status - plan deficit (48,798) (45,878) (205,235) (82,512)
Unamortized actuarial loss (gain) 130,533 (8,459) 278,785 (12,274)
Unamortized past service costs 32,727 (24,388) 37,961 (3,246)
Accrued benefit asset (liability) 114,462 (78,725) 111,511 (98,032)
35Beer Store Operational Report 2013 Financial Statements
Brewers Retail Inc.
Notes to Financial Statements
December 31, 2013
(in thousands of Canadian dollars)
(7)
Other information about the company’s defined benefit plans and other benefit plans is as follows:
Pension benefit plans Other benefit plans
December 31,
2013
$
December 30,
2012
$
December 31,
2013
$
December 30,
2012
$
Net expenses 32,774 33,292 (14,510) 9,555
Company’s contributions
made 35,725 23,273 4,797 3,798
Benefits paid 33,711 33,262 4,797 3,798
In 2013, the company offered eligible retired employees a voluntary buyout to permanently opt out of their
post-retirement health and life insurance coverage in exchange for a lump sum payment. The company settled
$1,138 of benefits for $897 in cash payout and incurred costs of $190 to administer the settlement.
The significant actuarial assumptions adopted in measuring the company’s accrued benefit obligations are as
follows:
December 31,
2013
%
December 30,
2012
%
Discount rate (Salary Plan) 4.80 4.20
Discount rate (Bargaining Plan) 5.00 4.20
Discount rate (LTD Plan) 3.80 3.30
Discount rate (PRB Plan) 4.90 4.20
Long-term rate of return on plan assets 7.00 7.00
Rate of compensation increase 2.00 2.00
For measurement purposes, a 7.0% annual rate of increase in the per capita cost of drugs and other medical
benefits was assumed for fiscal 2013 and 2012. The rate is assumed to decrease by 0.5% per year to a minimum
of 5%.
Plan assets comprise the following:
December 31,
2013
$
December 30,
2012
$
Equity instruments 413,226 381,943
Debt instruments 283,488 231,015
Cash and cash equivalents 3,567 3,080
700,281 616,038
In the event that the discount rate used changed by o.5% from management’s estimates, the carrying (amount
of the present value of the obligation) would change by $4,028 (December 30, 2012 - $4,520).
Beer Store Operational Report 201336Financial Statements
Brewers Retail Inc.
Notes to Financial Statements
December 31, 2013
(in thousands of Canadian dollars)
(8)
9 Accounts payables and accrued liabilities
December 31,
2013
$
December 30,
2012
$
Owner brewers 195,398 195,540
Other brewers 43,091 39,678
Other payables and accrued liabilities 62,479 58,429
300,968 293,647
10 Capital stock
Authorized
197,700 first preference shares, eight dollars, Series A, redeemable at one hundred dollars each
10,000 Class A shares, non-voting
20,000 Class B shares, non-voting, redeemable at ten thousand dollars each, contingent on certain future
events
Unlimited Class C shares, non-voting, redeemable at one hundred dollars each, contingent on certain
future events
Unlimited Class D shares, non-voting, redeemable at one hundred dollars each, contingent on certain
future events
1,000 common shares
Issued and outstanding
December 31,
2013
$
December 30,
2012
$
10,000 Class A shares 100 100
20,000 (2012 - 20,000) Class B shares 200,000 200,000
604,312 (2012 - 610,145) Class C shares 84 91
903,716 (2012 - 913,086) Class D shares 83 91
1,000 common shares 100 100
200,367 200,382
49,247 (December 30, 2012 - 5,837) Class C shares were redeemed for $4,925 (December 30, 2012 - $583),
with a premium of $4,918 (December 30, 2012 - $582). 79,099 (December 30, 2012 - 9,370) Class D shares
were redeemed for $7,910 (December 30, 2012 - $937) with a premium of $7,902 (December 30, 2012 - $936).
37Beer Store Operational Report 2013 Financial Statements
Brewers Retail Inc.
Notes to Financial Statements
December 31, 2013
(in thousands of Canadian dollars)
(9)
11 Commitments and contingencies
The company has commitments under operating leases for properties, vehicles, cars and equipment that
require future minimum annual payments as follows:
$
2014 29,697
2015 24,668
2016 18,073
2017 14,230
2018 10,825
Thereafter 36,335
133,828
The company is a defendant in litigation arising in the normal course of business. The company believes that
the ultimate resolution of these matters will not materially affect the company’s financial condition or income.
12 Related party transactions and balances
The company carried out the following transactions in accordance with the terms of the shareholders’
agreement during the period and had balances at the end of the period with these entities as follows:
December 31,
2013
$
December 30,
2012
$
Service charges revenue 222,322 227,113
Operating costs charged to Brewers’ Distributor Ltd. 4,300 4,214
Accounts receivable - Brewers 4,257 6,541
Accounts receivable - other - Brewers’ Distributor Ltd. 442 5,471
Accounts payable and accrued liabilities - Brewers 195,398 195,540
Brewers’ Distributor Ltd. is an affiliated company controlled by the shareholders. The above transactions were
in the normal course of operations and were recorded at the exchange value, which represents the amount of
consideration established and agreed to by the related parties.
In addition to these amounts, the company has transactions in the normal course of business with a number of
other breweries owned or controlled by the Brewers. These amounts are included in accounts receivable -
others, accounts payable - others and service charges and other revenue.
Beer Store Operational Report 201338Financial Statements
Brewers Retail Inc.
Notes to Financial Statements
December 31, 2013
(in thousands of Canadian dollars)
(10)
13 Income taxes
The analysis of deferred income tax assets is as follows:
December 31,
2013
$
December 30,
2012
$
Deferred income tax assets
To be recovered after more than 12 months 7,710 10,625
To be recovered within 12 months 4,000 3,375
11,710 14,000
The movement in the deferred income tax balances is as follows:
December 31,
2013
$
December 30,
2012
$
As at January 1 14,000 12,000
(Credited) charged to the statement of operations (2,290) 2,000
As at December 31 11,710 14,000
Income tax (recovery) expense
December 31,
2013
$
December 30,
2012
$
Current income taxes - -
Deferred income taxes
Origination and reversal of temporary differences 2,290 (2,000)
2,290 (2,000)
The current income taxes on the company’s profit before income taxes differ from the theoretical amount that
would arise using the weighted average income tax rate applicable to income as follows:
December 31,
2013
$
December 30,
2012
$
Income taxes calculated at domestic rates applicable to
income 3,399 378
Income tax effects of
Permanent difference (643) (666)
Temporary difference (1,701) 2,401
Utilization of previously unrecognized income tax losses (1,055) (2,113)
Current income taxes - -
The weighted average applicable income tax rate was 26.5% (December 30, 2012 - 25.0%).
39Beer Store Operational Report 2013 Financial Statements
Brewers Retail Inc.
Notes to Financial Statements
December 31, 2013
(in thousands of Canadian dollars)
(11)
14 Government remittances
Government remittances consist of amounts (such as property taxes, sales taxes, payroll withholding taxes and
LCBO remittances) required to be paid to the government authorities and are recognized when the amounts
come due. In respect to government remittances, $36,880 (December 30, 2012 - $38,967) is included in
accounts payable and accrued liabilities.
15 Financial instruments
Financial assets and liabilities are recognized when the company becomes a party to the contractual provisions
of the instrument. Financial assets are derecognized when the rights to receive cash flows from the assets have
expired or have been transferred and the Company has transferred substantially all risks and rewards of
ownership. Financial liabilities are derecognized when the obligation specified in the contract is discharged,
cancelled or expires.
The company’s financial assets and liabilities are classified into the following categories:
 cash and cash equivalents as held-for-trading, which are measured at fair value;
 accounts receivable are non-derivative financial assets with fixed or determinable payments that are
not quoted in an active market. The company’s accounts receivable comprise trade receivables and are
included in current assets due to their short-term nature. Accounts receivables are initially
recognized at the amount expected to be received, less, when material, a discount to reduce the
account receivables and notes receivable to fair value. Subsequently, accounts receivable are
measured at amortized cost using the effective interest method less a provision for doubtful accounts;
and
 payable and accrued liabilities as other financial liabilities, which are measured at amortized cost.
Financial liabilities are initially recognized at the amount required to be paid, less, when material, a
discount to reduce the payables to fair value. Subsequently, financial liabilities are measured at
amortized cost using the effective interest method. These are classified as current liabilities if
payment is due within 12 months.
Credit risk
In the normal course of business, the company is exposed to credit risk from its accounts receivable from
customers. The carrying values of accounts receivable are net of applicable revenue provisions and allowances
for doubtful accounts. Allowances for doubtful accounts are estimated based on past experience, specific risks
associated with the customer and other relevant information.
Interest rate risk
Interest rate risk is the risk the fair value or future cash flows of a financial instrument will fluctuate because of
changes in market interest rates. The company does not hold any significant interest bearing assets.
Beer Store Operational Report 201340Financial Statements
Brewers Retail Inc.
Notes to Financial Statements
December 31, 2013
(in thousands of Canadian dollars)
(12)
Foreign currency risk
The company is exposed to currency risks as a result of exchange rate fluctuations and the volatility of these
rates. In the normal course of business, the company has financial assets and liabilities that are denominated in
US dollars. The company transacts in US dollars for income and expense transactions and carries US dollars in
the bank account for this purpose. The risk in this area is assessed by the company to be insignificant.
Liquidity risk
Liquidity risk is the risk the company will not be able to meet its financial obligations as they fall due. The
exposure to liquidity risk is dependent on the collection of accounts receivable. The company manages its
liquidity risk by monitoring its operating requirements. The company prepares budgets and forecasts to
monitor this risk. There has been no change to this risk exposure since 2012.
Price risk
Price risk is that the fair value or future cash flows of a financial instrument will fluctuate because of changes in
market prices (other than those arising from interest rate risk or currency risk), whether those changes are
caused by factors specific to the individual financial instrument or its issuer, or factors affecting all similar
financial instruments traded in the market. The company does not hold any instruments that could have the
exposure to cash flow interest rate risk.
16 Capital management
The company’s capital consists of share capital and deficit. The company’s objectives in managing capital are to
ensure adequate operating funds are available to maintain its business activities and to provide a cost-effective
operation to its shareholders. Additionally, the company aims to ensure sufficient liquidity to support its stores,
execute its business plans and enable the internal financing of capital projects.
The company’s primary uses of capital are to finance non-cash working capital along with capital expenditures
for new store additions, existing store renovation projects, information technology software and hardware
purchases and equipment purchases. The company currently funds these requirements out of its internally
generated cash flows.
The company is not subject to any externally imposed capital requirements. There has been no change with
respect to the overall capital risk management strategy during the period.
41Beer Store Operational Report 2013 Financial Statements
Brewers Retail Inc.
Notes to Financial Statements
December 31, 2013
(in thousands of Canadian dollars)
(13)
17 Change in non-cash operating working capital balances
December 31,
2013
$
December 30,
2012
$
Decrease (increase) in accounts receivable
Brewers 2,374 (636)
Others 4,929 (1,374)
Empties deposits 60 (248)
Change in inventories (9,341) 1,629
Change in prepaid expenses and deposits (459) 284
Change in accounts payable and accrued liabilities 7,321 (3,348)
Change in accounts payable and accrued liabilities in relation to
purchase of property, plant and equipment and intangible
assets (3,339) (2,030)
1,545 (5,723)
18 Comparative figures
Certain comparative figures have been reclassified to conform to the financial statement presentation adopted
in the current year.

More Related Content

What's hot

Leroy Merlin: Customer Satisfaction Project
Leroy Merlin: Customer Satisfaction ProjectLeroy Merlin: Customer Satisfaction Project
Leroy Merlin: Customer Satisfaction ProjectAnna Osmanay
 
Global Supply Chain Management & Logistics - Leroy Merlin Case Study
Global Supply Chain Management & Logistics - Leroy Merlin Case StudyGlobal Supply Chain Management & Logistics - Leroy Merlin Case Study
Global Supply Chain Management & Logistics - Leroy Merlin Case StudyVasilis Tsardaklis
 
rbhk2016_brochure
rbhk2016_brochurerbhk2016_brochure
rbhk2016_brochureJacky Lam
 
Business Plan - MGOP Bakery Supplies
Business Plan - MGOP Bakery SuppliesBusiness Plan - MGOP Bakery Supplies
Business Plan - MGOP Bakery SuppliesMary Grace Pagas
 
business proposal for sunshine bakery
business proposal for sunshine bakerybusiness proposal for sunshine bakery
business proposal for sunshine bakerycloudious nyikadzino
 
Managmant project introduction to volka
Managmant project introduction to volkaManagmant project introduction to volka
Managmant project introduction to volkaTouseefAfzaal
 
Wearcultue Company Profile
Wearcultue Company ProfileWearcultue Company Profile
Wearcultue Company ProfileEze Ikedi
 
Paper boat 2019 market analysis (factor analysis))
Paper boat 2019 market analysis (factor analysis))Paper boat 2019 market analysis (factor analysis))
Paper boat 2019 market analysis (factor analysis))Ramanjeet Singh
 
Food and Beverage Trends: The Fancy Food Show, 2017
Food and Beverage Trends: The Fancy Food Show, 2017Food and Beverage Trends: The Fancy Food Show, 2017
Food and Beverage Trends: The Fancy Food Show, 2017Hamutal Schieber
 
The harvest cake strategy
The harvest cake strategyThe harvest cake strategy
The harvest cake strategyEka Darmadi
 
Strategic Case Analysis of Domino's Pizza
Strategic Case Analysis of Domino's PizzaStrategic Case Analysis of Domino's Pizza
Strategic Case Analysis of Domino's PizzaAtacan Garip
 
House of cake Marketing Project
House of cake Marketing Project House of cake Marketing Project
House of cake Marketing Project Abubakar Ali Toor
 
Cafe industry presentation
Cafe industry presentationCafe industry presentation
Cafe industry presentationSandeep Mishra
 
Indian coffee cafe chains market overview
Indian coffee cafe chains market overviewIndian coffee cafe chains market overview
Indian coffee cafe chains market overviewChandni Sahgal
 

What's hot (20)

Leroy Merlin: Customer Satisfaction Project
Leroy Merlin: Customer Satisfaction ProjectLeroy Merlin: Customer Satisfaction Project
Leroy Merlin: Customer Satisfaction Project
 
Global Supply Chain Management & Logistics - Leroy Merlin Case Study
Global Supply Chain Management & Logistics - Leroy Merlin Case StudyGlobal Supply Chain Management & Logistics - Leroy Merlin Case Study
Global Supply Chain Management & Logistics - Leroy Merlin Case Study
 
rbhk2016_brochure
rbhk2016_brochurerbhk2016_brochure
rbhk2016_brochure
 
Product Launch - Fudge ice
Product Launch - Fudge ice Product Launch - Fudge ice
Product Launch - Fudge ice
 
Business Plan - MGOP Bakery Supplies
Business Plan - MGOP Bakery SuppliesBusiness Plan - MGOP Bakery Supplies
Business Plan - MGOP Bakery Supplies
 
presentation
presentationpresentation
presentation
 
Nature's Basket
Nature's BasketNature's Basket
Nature's Basket
 
Tapioca shake project
Tapioca shake projectTapioca shake project
Tapioca shake project
 
business proposal for sunshine bakery
business proposal for sunshine bakerybusiness proposal for sunshine bakery
business proposal for sunshine bakery
 
Managmant project introduction to volka
Managmant project introduction to volkaManagmant project introduction to volka
Managmant project introduction to volka
 
Wearcultue Company Profile
Wearcultue Company ProfileWearcultue Company Profile
Wearcultue Company Profile
 
Paper boat 2019 market analysis (factor analysis))
Paper boat 2019 market analysis (factor analysis))Paper boat 2019 market analysis (factor analysis))
Paper boat 2019 market analysis (factor analysis))
 
Food and Beverage Trends: The Fancy Food Show, 2017
Food and Beverage Trends: The Fancy Food Show, 2017Food and Beverage Trends: The Fancy Food Show, 2017
Food and Beverage Trends: The Fancy Food Show, 2017
 
The harvest cake strategy
The harvest cake strategyThe harvest cake strategy
The harvest cake strategy
 
Dukaan Bakery ppt
Dukaan Bakery pptDukaan Bakery ppt
Dukaan Bakery ppt
 
Strategic Case Analysis of Domino's Pizza
Strategic Case Analysis of Domino's PizzaStrategic Case Analysis of Domino's Pizza
Strategic Case Analysis of Domino's Pizza
 
House of cake Marketing Project
House of cake Marketing Project House of cake Marketing Project
House of cake Marketing Project
 
Cafe industry presentation
Cafe industry presentationCafe industry presentation
Cafe industry presentation
 
Starbucks Strategy
Starbucks StrategyStarbucks Strategy
Starbucks Strategy
 
Indian coffee cafe chains market overview
Indian coffee cafe chains market overviewIndian coffee cafe chains market overview
Indian coffee cafe chains market overview
 

Viewers also liked

Au&deo productions
Au&deo productionsAu&deo productions
Au&deo productionsdaniortiz2407
 
So messen Sie QR-Code-Ergebnisse!
So messen Sie QR-Code-Ergebnisse!So messen Sie QR-Code-Ergebnisse!
So messen Sie QR-Code-Ergebnisse!ROHINIE.COM Limited
 
เทคโนโลยีสารสนเทศและการสื้อสาร
เทคโนโลยีสารสนเทศและการสื้อสารเทคโนโลยีสารสนเทศและการสื้อสาร
เทคโนโลยีสารสนเทศและการสื้อสารpplleenngg
 
Rebel Mouse - Ihr Social-Media-Schaufenster!
Rebel Mouse - Ihr Social-Media-Schaufenster!Rebel Mouse - Ihr Social-Media-Schaufenster!
Rebel Mouse - Ihr Social-Media-Schaufenster!ROHINIE.COM Limited
 
Grabaciones en CD
Grabaciones en CD Grabaciones en CD
Grabaciones en CD Facebook
 
Programa jornada tecnica
Programa jornada tecnicaPrograma jornada tecnica
Programa jornada tecnicaleandroeara
 

Viewers also liked (7)

Au&deo productions
Au&deo productionsAu&deo productions
Au&deo productions
 
So messen Sie QR-Code-Ergebnisse!
So messen Sie QR-Code-Ergebnisse!So messen Sie QR-Code-Ergebnisse!
So messen Sie QR-Code-Ergebnisse!
 
เทคโนโลยีสารสนเทศและการสื้อสาร
เทคโนโลยีสารสนเทศและการสื้อสารเทคโนโลยีสารสนเทศและการสื้อสาร
เทคโนโลยีสารสนเทศและการสื้อสาร
 
Psych303Poster
Psych303PosterPsych303Poster
Psych303Poster
 
Rebel Mouse - Ihr Social-Media-Schaufenster!
Rebel Mouse - Ihr Social-Media-Schaufenster!Rebel Mouse - Ihr Social-Media-Schaufenster!
Rebel Mouse - Ihr Social-Media-Schaufenster!
 
Grabaciones en CD
Grabaciones en CD Grabaciones en CD
Grabaciones en CD
 
Programa jornada tecnica
Programa jornada tecnicaPrograma jornada tecnica
Programa jornada tecnica
 

Similar to Modern Beer Experience

The Franchise Proposal
The Franchise ProposalThe Franchise Proposal
The Franchise ProposalSebastian Yoon
 
Barriquando: Marketing plan
Barriquando: Marketing planBarriquando: Marketing plan
Barriquando: Marketing planMTM IULM
 
Sbux 2012 annual_report_final_from_rrd_web
Sbux 2012 annual_report_final_from_rrd_webSbux 2012 annual_report_final_from_rrd_web
Sbux 2012 annual_report_final_from_rrd_webRenat Musin
 
Minglewood Creative Brief Group 3
Minglewood Creative Brief Group 3Minglewood Creative Brief Group 3
Minglewood Creative Brief Group 3Alyssa Basler
 
OverviewSummaryIndustry backgroundMarketing strategyComp.docx
OverviewSummaryIndustry backgroundMarketing strategyComp.docxOverviewSummaryIndustry backgroundMarketing strategyComp.docx
OverviewSummaryIndustry backgroundMarketing strategyComp.docxkarlhennesey
 
Retail marketing final project
Retail marketing final projectRetail marketing final project
Retail marketing final projectHafeez Rehman
 
RUNNING HEAD Strategic Plan Part 11Strategic Plan Part 1.docx
RUNNING HEAD Strategic Plan Part 11Strategic Plan Part 1.docxRUNNING HEAD Strategic Plan Part 11Strategic Plan Part 1.docx
RUNNING HEAD Strategic Plan Part 11Strategic Plan Part 1.docxtoltonkendal
 
Soft Drinks Product Development
Soft Drinks Product DevelopmentSoft Drinks Product Development
Soft Drinks Product DevelopmentMuhammadNurafif1
 
Speciality Retailin Coffee Shop
Speciality Retailin Coffee ShopSpeciality Retailin Coffee Shop
Speciality Retailin Coffee Shopalvareena
 
Flavourly Marketing Plan Fall 2015
Flavourly Marketing Plan Fall 2015Flavourly Marketing Plan Fall 2015
Flavourly Marketing Plan Fall 2015Molly Sweeney
 
BUSINESS PLAN " SWEETBITS COMPANY"
BUSINESS PLAN " SWEETBITS COMPANY"BUSINESS PLAN " SWEETBITS COMPANY"
BUSINESS PLAN " SWEETBITS COMPANY"miramar serrion
 
wepik-brewing-success-a-business-idea-on-coffee-20240305150514P1th.pptx
wepik-brewing-success-a-business-idea-on-coffee-20240305150514P1th.pptxwepik-brewing-success-a-business-idea-on-coffee-20240305150514P1th.pptx
wepik-brewing-success-a-business-idea-on-coffee-20240305150514P1th.pptxHakunaDas
 
Young Marketers Elite 7 - Assignment 1.1 - Anh+Huy+Nhơn+Vinh+An
Young Marketers Elite 7 - Assignment 1.1 - Anh+Huy+Nhơn+Vinh+AnYoung Marketers Elite 7 - Assignment 1.1 - Anh+Huy+Nhơn+Vinh+An
Young Marketers Elite 7 - Assignment 1.1 - Anh+Huy+Nhơn+Vinh+Annguyenxvinh
 

Similar to Modern Beer Experience (20)

The Franchise Proposal
The Franchise ProposalThe Franchise Proposal
The Franchise Proposal
 
Barriquando: Marketing plan
Barriquando: Marketing planBarriquando: Marketing plan
Barriquando: Marketing plan
 
Sbux 2012 annual_report_final_from_rrd_web
Sbux 2012 annual_report_final_from_rrd_webSbux 2012 annual_report_final_from_rrd_web
Sbux 2012 annual_report_final_from_rrd_web
 
Store windows
Store windowsStore windows
Store windows
 
Store windows
Store windowsStore windows
Store windows
 
Minglewood Creative Brief Group 3
Minglewood Creative Brief Group 3Minglewood Creative Brief Group 3
Minglewood Creative Brief Group 3
 
OverviewSummaryIndustry backgroundMarketing strategyComp.docx
OverviewSummaryIndustry backgroundMarketing strategyComp.docxOverviewSummaryIndustry backgroundMarketing strategyComp.docx
OverviewSummaryIndustry backgroundMarketing strategyComp.docx
 
Retail marketing final project
Retail marketing final projectRetail marketing final project
Retail marketing final project
 
RUNNING HEAD Strategic Plan Part 11Strategic Plan Part 1.docx
RUNNING HEAD Strategic Plan Part 11Strategic Plan Part 1.docxRUNNING HEAD Strategic Plan Part 11Strategic Plan Part 1.docx
RUNNING HEAD Strategic Plan Part 11Strategic Plan Part 1.docx
 
Soft Drinks Product Development
Soft Drinks Product DevelopmentSoft Drinks Product Development
Soft Drinks Product Development
 
CAP210-Founders
CAP210-FoundersCAP210-Founders
CAP210-Founders
 
Speciality Retailin Coffee Shop
Speciality Retailin Coffee ShopSpeciality Retailin Coffee Shop
Speciality Retailin Coffee Shop
 
Flavourly Marketing Plan Fall 2015
Flavourly Marketing Plan Fall 2015Flavourly Marketing Plan Fall 2015
Flavourly Marketing Plan Fall 2015
 
BUSINESS PLAN " SWEETBITS COMPANY"
BUSINESS PLAN " SWEETBITS COMPANY"BUSINESS PLAN " SWEETBITS COMPANY"
BUSINESS PLAN " SWEETBITS COMPANY"
 
slave-yellow_20180315
slave-yellow_20180315slave-yellow_20180315
slave-yellow_20180315
 
Business Plan
Business PlanBusiness Plan
Business Plan
 
wepik-brewing-success-a-business-idea-on-coffee-20240305150514P1th.pptx
wepik-brewing-success-a-business-idea-on-coffee-20240305150514P1th.pptxwepik-brewing-success-a-business-idea-on-coffee-20240305150514P1th.pptx
wepik-brewing-success-a-business-idea-on-coffee-20240305150514P1th.pptx
 
Young Marketers Elite 7 - Assignment 1.1 - Anh+Huy+Nhơn+Vinh+An
Young Marketers Elite 7 - Assignment 1.1 - Anh+Huy+Nhơn+Vinh+AnYoung Marketers Elite 7 - Assignment 1.1 - Anh+Huy+Nhơn+Vinh+An
Young Marketers Elite 7 - Assignment 1.1 - Anh+Huy+Nhơn+Vinh+An
 
Bask
BaskBask
Bask
 
COCKTAILS CB 2015 retail
COCKTAILS CB 2015 retailCOCKTAILS CB 2015 retail
COCKTAILS CB 2015 retail
 

Modern Beer Experience

  • 1. Beer Store Operational Report 2013Beer Store Operational Report 2013
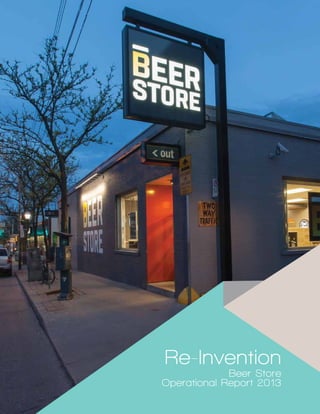
 Re-Invention Beer Store Operational Report 2013
  • 2. 1Beer Store Operational Report 2013 Table of Contents President’s Message 2 Retail Strategy 3 Being Part of a Community 9 Giving Back 10 Environmental Performance 11 Health & Safety 14 The Year in Beer Sales 15 Beer Tax Contributions 20 Rate Sheet 22 Financial Statements 23
  • 3. Beer Store Operational Report 20132President’s Message President’s Message Welcome to our 2013 Operational Report, a financial and business overview of our company’s performance and innovative advances. This was a year of dramatic change for us, a transformation not only in our brand identity, our visual image and store design, but also in our culture. After months of research and talking directly with customers, we found that our customers were looking for newer, modernized and more tactile shopping experiences. Combining our customers’ desires with our employees growing passion for beer knowledge, we embarked on a renewed vision and exciting journey of reinvention. Thanks to dedicated teamwork we renovated four pilot stores in the spring of 2013 and continued with a further roll out of 13 more store renovations in the fall so that we could ensure that a robust test was complete. Five key elements of the reinvented experience included a new name, a new logo, a new retail design, new service features and new technology. The name “Beer Store” with the modern styled “B” in stylized foam eyebrow is a contemporary version of our brand based on our past branding heritage combined with continued reinforcement of our core business. The new identity is a visual invitation to customers to expect to see something new whenever entering through our doorways. Please look through the pages of this report to see the new reinvented Beer Store. We added a sixth element to the experience and that has to do with culture change supported by training. To make the new experience come to life it is important to have our employees engaged with customers and trained as beer experts. Extensive product knowledge and service training is part of our promise to customers - to be Champions of Beer Love Every Day. I am proud of our training program which has been expanded to hundreds of front line staff. We are seeing great results with positive feedback from customers and market share gains in all the new-look stores. There are a few important things that will remain unchanged. While we are going through important “bricks and mortar”changes and cultural evolution, we still hold true to our core values like, responsible sale, environmental leadership, operational excellence, and most important of all; health and safety. As a responsible retailer of beer, our employees have done a superb job checking for ID for anyone 25 or under. Not to be forgotten, we also continue to stand behind our passionate commitment to the community with another record year of donations for our annual Returns for Leukemia Bottle Drive – a feat only achieved with the help of hundreds of volunteers donating much of their personal time. As far as growing our business goes, 2013 was another record year for unprecedented selection as the Beer Store repertoire reached over 100 brewers and 400 brands while collecting over a billion dollars in revenue for important government programs. This was the year of big changes for the Beer Store, and while change is not always easy, we are successfully moving forward due to the dedication and determination of our hard-working employees who rose to the challenge. The Beer Store is well positioned for future growth opportunities in 2014 and beyond. Thanks, Ted
  • 4. Retail Strategy CUSTOMERS WANT CHANGE Through extensive research, including interviews and on-site intercepts, it is clearly apparent that customers are not only passionate about their beer but they are also looking for more from the Beer Store each time they visit a store or visit us on-line. The traditional store with empties returns on one side and a stainless steel counter to order beer on the other, where beer is pushed along rollers from the back of the store, does not meet the needs of an up and coming passionate beer lover of today. Modern technology, growth in brands and types of beers coupled with the desire to explore, try and experience new ways of shopping means something had to change. The Beer Store recognized that their future depends on being able to adapt and be relevant to the new consumer of beer. Retail Strategy SEIZING THE OPPORTUNITY In early 2013, the Beer Store introduced a retail renovation program involving an innovative interior design and new approach to retailing. The Beer Store decided that status quo was not an option and it was imperative to take immediate action to gain back customer loyalty and sales. The formula for success was to WIN…win by providing the right beer for every occasion…win by having larger pack sizes at cheaper prices…win by expanding self serve opportunities...win by continuing to be an environmental champion accepting all empty alcohol containers and related packaging…win by being trained experts in beer. Discriminating customers demand great service, great product selection, great prices, friendly and helpful employees, all wrapped into an overall store experience that make them feel good about their visit to the Beer Store. The pathway to success for the Beer Store is to create a memorable shopping experience with fully trained and knowledgeable staff that customers will recommend to others. Beer Store Operational Report 2013 3
  • 5. Beer Store Operational Report 20134Retail Strategy A NEW BRAND IDENTITY The foundation of change begins with a new brand identity. A new name, a distinctive look and a unique personality that communicates that a transformation has occurred. Whenever a brand change occurs, the fundamental message and expectation of customers is that a new experience in is the offering and the experience starts as soon as they walk through the front doors. The new ‘Beer Store’ logo is clean, fresh and contemporary with a colourful ‘B’ graphic signifying a glass of beer with a head of foam on top. The background gray colour tone provides a distinctive back-drop for the new identity. BEING “CHAMPIONS OF BEER LOVE EVERY DAY” The evolution of the brand includes a change in the overall employee mindset…a wholesale change in the company’s culture. Attracting and retaining customers is a top priority and our employees need to be relevant and helpful at all times. The new mantra ‘Being Champions of Beer Love Every Day’ speaks to this new attitude . It’s about confidence in knowing our business, being passionate about it and consistently applying and sharing our knowledge and expertise in everything we do. A NEW RETAIL EXPERIENCE There are two key ways the Beer Store will deliver on its new experiential mandate: 1. To continue building new self serve stores with separate empties rooms. 2. To renovate and refresh the exteriors and interiors of existing stores to the new Beer Store design. The process of this retail transformation began in 2013 with the renovation of 17 stores and the opening of 3 new self serve stores with plans to continue this development over the next few years.
  • 6. 5Beer Store Operational Report 2013 Retail Strategy FIRST IMPRESSIONS ARE LASTING ONES When entering the renovated store, customers are presented with a colourful interior set on background tones of gray and orange. The décor includes striking highlights throughout with a mix of rural elements like, natural pine combined with modern flare using stainless steel, coloured metal accents and illuminated posters and signs. The ambient music sets the mood while fully trained staff approach customers and are ready and willing to help out and respond to questions on beer and service. THE INVITATION – MEET BEER The new retail experience begins as customers stand in the parking lot or sidewalk. Customers immediately see a new colour scheme, a new logo, illuminated Cold Beer signs and colourful ‘Meet Beer’ marketing messages. The ‘Meet Beer’ marketing message starts with posters displayed in the front windows and is carried through to the inside of the store. This message speaks an open invitation for customers to become acquainted or re-acquainted with beer. To make beer relevant to any occasion, like when serving with different foods, or when watching their favourite sporting activity or perhaps participating in a special occasion with family or friends.
  • 7. Beer Store Operational Report 20136Retail Strategy THE ‘BEER FRIDGE’ ‘Cold’ and ‘Beer’ naturally go together. In newly renovated stores customers are reminded of the chilled product waiting behind the doors labeled appropriately as the ‘BEER FRIDGE’ zone. AN IMPROVED SHOPPING EXPERIENCE In many renovated stores, a double-sided central lobby fixture allows customers to either shop for single cans, search for new products to the store, or browse through the some hats, glassware, openers and other beer related items. The digital touch-screen tablets modernize the menu board of brands and packs sold in the store. NAVIGATION ZONES New self serve stores have an empties return zone that is clearly separated from the shopping zone. The bright orange wall graphic with the words ‘Empties Exchange’ reminds customers to prepare their empties for a deposit return. Special wall graphics and marketing messages guide customers to sort their empties for faster service and more efficient recycling. Depending on the store type, customers are drawn to the point of purchase by a visual eyebrow canopy lined with natural pine with hanging orange pendant lights. The down-to-earth wood décor decorates the face of the counters in this area differentiated from the empties counter which has a modern gray tone.
  • 8. 7Beer Store Operational Report 2013 Retail Strategy EMPLOYEE TRAINING IS KEY To meet the demands of customers and to be relevant to the new retail environment, the Beer Store developed and implemented a Quality Customer Service program that focuses on increasing the level of engagement with customers through questioning and listening skills. The training course covers extensive product knowledge of the 4 main ingredients of beer including how to properly pour and taste product. Included in the classroom are food pairings to allow employees to gain additional knowledge so they are experts in the field. The goal is to have all retail employees trained and ready to deliver a great experience in all stores. IMPORTANCE OF COMMUNITY It is a privilege to be able to sell beer responsibly and accept empty returns in communities across Ontario. The Beer Store feels very much like a resident and partner in protecting the well-being of the communities in which it operates. To sell beer responsibly in any Ontario community, the Beer Store implements a strict ‘WE ID25’ program challenging customers to be of legal age. The Beer Store recognizes the greatness of every city, town and suburb it has a store in and shows this with new exterior signs giving recognition to the name of the community.
  • 9. 8 Beer Store Operational Report 2013Retail Strategy “The pathway to success is clear: create a memorable shopping experience with fully trained employees under a new brand name.”
  • 10. Being Part of a Community OUR COMMITMENT TO RESPONSIBLE SERVICE At the Beer Store responsible service is implemented in a number of ways. First and foremost, the company maintains a strict set of operational policies designed to ensure that minors or intoxicated individuals do not have access to alcohol. RESPONSIBLE SALES POLICIES: • Request ID from anyone who appears to be 25 years old or under • Refuse service to anyone who appears to be intoxicated • Mandatory annual responsible service training for all sales staff • Mystery shop program to ensure compliance with policies • Store level responsible service results incorporated into store manager performance reviews Year Challenge Type Challenged Refused 2012 Intoxicants 25,598 19,807 2012 Minors 3,513,748 47,523 2013 Intoxicants 20,770 16,270 2013 Minors 3,573,333 42,750 “Arrive Alive DRIVE SOBER remains grateful for The Beer Store’s ongoing support in the battle against impaired driving in Ontario, and we are pleased for the chance to collaboratively educate the public on ways to prevent impaired driving. Ontario’s roads are among the safest in all of North America; this accomplishment would not have been possible without your constant support.” - Arrive Alive RESPONSIBLE SERVICES MESSAGING: TBS incorporates responsible service messaging into many of its marketing initiatives to ensure that customers enjoy beer responsibly. • In-store Posters • Media Advertising • Partnership with Arrive Alive 9Beer Store Operational Report 2013 Being Part of a Community
  • 11. Giving BackThe Beer Store is dedicated to community involvement and fundraising activities for charitable groups and actively participates in dozens of events, big and small, throughout many communities in Ontario. The Annual Returns for Leukemia Bottle Drive brings together thousands of volunteers from 447 stores and 8 Distributions Centers, our Head Office as well as friends and family for a two day fundraising event. In addition to the annual Bottle Drive, hundreds of employees have organized numerous other fundraising events around the Province. There is Curling for a Cure, Bowling for Leukemia, Bikes N’ Beers, Waterfront Marathon and Light the Night Walk to name a few. Together, the Leukemia and Lymphoma Society of Canada and the Beer Store in partnership with UFCW Local 12R24, the Union that represents our employees and 4,000 volunteers, we raised: $1.7 million in 2013 and over $7.8 million the past 8 years! • Activities ranging from coin boxes in stores, assisting bottle drives, donating time to help others • UFCW Local 12R24 – TBS Partnership • Province-wide Bottle Drive (May 25-26, 2013) BOTTLE DR VE LEUKEM A RETURNS FOR OTHER TBS COMMUNITY AND CHARITABLE INITIATIVES ROGERS HOUSE Roger’s House is the legacy that was created in Roger Neilson’s honour by the Ottawa Senators Foundation in collaboration with The Children’s Hospital of Eastern Ontario, the Ontario Ministries of Health and Children and Youth Services. The overwhelming contribution and support of the Ottawa community made the dream of Roger’s House a reality. Beer Store locations in the Eastern Ontario area raise money each year to support the families of sick children/ youth. TERRY FOX The Foundation not only raises money for research, but it also continues to share the story of Terry Fox. The Terry Fox Foundation strives to maintain the heroic effort and integrity that Terry embodied. The Beer Store supports the cause by donating money from bottle drives and dollar donations within certain regions of the province. ARRIVE ALIVE, DRIVE SOBER The Beer Store is committed to keeping the streets of Ontario safe and free from impaired driving. Through their partnership the Beer Store and Arrive Alive DRIVE SOBER provide wleadership and programs to eliminate impaired driving and enables people and communities to share resources and information that will prevent injuries and save lives. ROYAL CANADIAN LEGION (POPPIES) As a national organization, The Royal Canadian Legion operates programs and services at all levels that aim to help more than just Veterans. On a daily basis, members provide their time and efforts to better the lives of many, and to ensure Remembrance continues across Canada. The Beer Store supports the annual poppy campaign at locations across the province. RETURNS FOR LEUKEMIA Beer Store Operational Report 201310Giving Back
  • 12. 11Beer Store Operational Report 2013 Environmental Performance Environmental Performance DEPOSIT RETURN: DRIVING THE GREEN ECONOMY 2012-2013 Glass Reuse Clear Glass Bottle Recycling Coloured Glass Bottle Recycling Aluminum Recycling Steel Recycling PET Mixed Plastic Total Diversion tBS Tonnes Diverted 249,615 15,042 35,196 8,389 253 - 934 309,429 ODRP Tonnes Diverted - 35,173 75,125 924 - 1,031 - 112,253 Total Tonnes Diverted 249,615 50,215 110,321 9,313 253 1,031 934 421,682 TABLE 1: TBS AND ODRP LANDFILL DIVERSION* TABLE 2: TBS & ODRP AVOIDED GHG EMISSIONS AND AVOIDED ENERGY CONSUMPTION 2012-2013 Glass Reuse Clear Glass Bottle Recycling Coloured Glass Bottle Recycling Aluminum Recycling Steel Recycling PET Total Diversion TOTAL Tonnes Diverted 249,615 20,215 110,321 9,313 253 1,031 420,748* Avoided GHG Emissions (MTC02E) 94,854 5,524 6,068 89,964 301 3,753 200,462 Avoided Energy (Gigajoules) 1,697,382 84,361 120,250 813,584 3,190 87,955 2,806,722 Combined, the Beer Store returns and ODRP programs represent the largest beverage container diversion system in Canada. In 2012-2013, the Beer Store and ODRP deposit programs: • Combined avoided 200,462 tonnes of GHG emissions – equivalent to taking over 41,700 cars and trucks off Ontario roads. • Combined, these programs avoided over 2,806,722 gigajoules of energy – equivalent to over $49 million of oil. • Combined, these programs diverted 446,000 tonnes of material – equivalent to almost 50% of all materials collected through the Blue Box program. *Note: Only includes diversion associated with beverage alcohol containers. Does not include secondary packaging diversion. *Note: This number does not include “mixed plastic”, so the number does not exactly match the diversion total in Table 1 above.
  • 13. Beer Store Operational Report 201312Environmental Performance 41,700CARS & TRUCKS $49M 50% OF OIL OF THE BLUE BOX MATERIALS The combined avoided GHG emissions between the ODRP and Beer Store deposit programs totals 200,462 tonnes. This is equivalent to taking 41,700 cars and trucks off Ontario roads. Combined, these programs avoided over 2,808,722 gigajoules of energy - equivalent to over $49 million of oil. Combined, these programs diverted 446,000 tonnes of material - equivalent to almost 50% of all materials collected through the Blue Box program.
  • 14. 13Beer Store Operational Report 2013 Environmental Performance TABLE 3: TBS CONTAINER SALES AND RECOVERY BY CONTAINER TYPE (BEER) Tables cover the period April 30, 2012 - April 28, 2013, except for cans which cover the period May 6, 2012 - May 4, 2013. Container Type tBS Sales (units) LCBO Sales (units) Return (units) System Recovery Rate 2012-2013 System Recovery Rate 2011-2012 All Glass Bottles (Refillable & Non- Refillable) 1,064,669,974 141,087,954 1,179,967,701 97.9% 99.1% Refillable Bottles: Industry Standard Bottle (ISB) and Non-Standard 946,941,989 98,619,492 1,026,348,158 98.2% 99.1% Non-Refillable Bottles 117,727,985 42,468,462 153,619,543 95.9% 99.5% Metal Cans 451,339,283 204,800,336 538,408,313 82.1% 83.1% Kegs 1,393,286 - 1,410,796 101.3% 100.9% PET Bottles 39 - 0 0.0% 0.0% TOTAL (By Units) 1,517,402,582 345,888,290 1,719,786,810 92.3% 94% TABLE 4 – ODRP CONTAINERS: SALES & RECOVERY April 30, 2012 – April 28, 2013, Except for cans which cover the period May 6, 2012 – May 4, 2013. Sales in Units Returns in Units Recovery rate Container Type Small Containers Large Containers Small Containers Large Containers Small Containers 2013 Small Containers 2012 Large Containers 2013 Large Containers 2012 Combined 2013 Combined 2012 GLASS 76,176,118 190,332,780 56,324,655 168,689,888 74% 74% 89% 90% 84% 85% PET 18,913,553 11,281,539 8,212,140 7,379,831 43% 44% 66% 63% 52% 51% TETRA/BIB 159,617 7,820,764 79,902 2,327,981 50% 108% 30% 31% 30% 32% SUBTOTAL 95,249,288 209,435,083 64,616,697 178,397,700 68% 68% 85% 86% 80% 81% CANS* 72,563,490 59,542,613 82.1% 83% GRAND TOTAL 377,247,861 302,557,010 80.2% 80.7% For a detailed report please see the Beer Store’s annual Stewardship Report at http://www.thebeerstore.ca/tbs-environmental-report.html The Beer Store packaging management system includes the collection of all beer containers sold by the Beer Store via either retail or wholesale channels and the collection of all related packaging. This includes beer containers sold at the LCBO retail outlets and agency stores throughout rural and northern Ontario, and beer containers sold in Ontario bars and restaurants.
  • 15. Beer Store Operational Report 201314Healthy & Safety LOST TIME ACCIDENT FREQUENCY - ANNUAL IMPROVEMENT Health & Safety WE ARE CHAMPIONS OF HEALTH & SAFETY Health & Safety are currently testing these mechanical devices used for keg handling. The Power MateMagliner 0 5 10 2003 2004 2005 2006 2007 2008 2009 2010 2011 2012 2013 Beer Store Total Company Beer Store management know that a healthy and safe workforce is key to achieving success in both the retail and logistics divisions of the company. They also know it’s key to continued employee satisfaction. That is why the Beer Store maintains an ongoing effort to ensure that employees feel safe at work and that they arrive home each day as healthy as when they left. The company is making continuous improvements every year driven by supportive dialogue to exchange concerns and learn better ways of doing things and by ongoing experimentation with new ideas and better techniques.
  • 16. I. PRODUCT SELECTION The Year in Beer Sales The Beer Store has an open listing policy meaning that any Brewer around the world wanting to sell product in the system can do so. The Beer Store stocks over 400 brands from 100 brewers from many different countries. In 2013, 69 new brands and 12 new brewers were introduced into the Beer Store system. BEER STORE BREWER FACTS: The Beer Store stocks a wide assortment of beer products from brewers both large and small. Over 30% of the Beer Store brands are produced by Ontario brewers and the remainder are produced outside of Ontario by both large and small breweries from other provinces in Canada and around the world. 1 Refers to Ontario brewers whose products are eligible for reduced Ontario beer tax rates or Ontario beer tax credits (i.e. annual production of less than 150,000hl). 2 Out-of-province brewers refers to Canadian brewers whose majority of Beer Store sales volume is supplied from breweries located in provinces other than Ontario. Import Out of Province Ontario 60% 11%29 % Import Out of Province Ontario 60% 8 % 32% 2012 Brewer Segments 2013 Brewer Segments 2012 2013 Total number of brewers 93 115 Ontario based brewers 27 28 Small Ontario Brewers1 22 23 Out of Province Brewers2 10 10 Import Brewers 56 77 Brewing Countries of Origin 23 22 Brewers selling more than 200,000hl 5 4 Brewers selling between 75,000hl and 200,000hl 4 5 Brewers selling less than 75,000hl 84 95 The Year in Beer Sales15Beer Store Operational Report 2013
  • 17. Beer Store Operational Report 201316The Year in Beer Sales 3 Please note annual Beer Store home consumer prices from previous Operational Reports for the years F2004 to 2012 have been corrected. These prices were slightly overstated in the 2012 Operational Report due to a methodological error. II. SALES BY VALUE AND BEER PRICES AVERAGE BEER STORE HOME CONSUMER SELLING PRICE PER LITRE INCLUDING SALES TAXES (EXCLUDING DEPOSITS)3 Average home consumer selling price increased by $.06 per litre or by 1.5% in comparison to 2012. In relation to Ontario inflation, Beer Store average home consumer selling prices over the last decade have declined by 13.6%. $3.88   $3.88   $3.78   $3.77   $3.79   $3.86   $3.88   $3.91   $4.01   $4.07   $3.60   $3.65   $3.70   $3.75   $3.80   $3.85   $3.90   $3.95   $4.00   $4.05   $4.10   2004   2005   2006   2007   2008   2009   2010   2011   2012   2013   Average TBS Home Consumer Price Converted to Case Equivalent $37.92 $33.31 $31.77 $30.00 $32.00 $34.00 $36.00 $38.00 $40.00 F2004F2005 2006 2007 2008 2009 2010 2011 2012 2013 Inflation Average Price AVERAGE BEER STORE HOME CONSUMER PRICE CONVERTED TO CASE EQUIVALENT
  • 18. 17Beer Store Operational Report 2013 The Year in Beer Sales Beer Store beer prices are also very competitive in relation to other Canadian jurisdictions. For 2013, the Beer Store commissioned a study comparing Beer Store prices to those at Quebec grocers. The study conducted by Navigant Economics represents the most comprehensive examination of Quebec beer prices ever published. It compiled data on beer sales for the entire year from Quebec’s seven largest grocery chains4 . The report found that on average Ontario Beer Store consumers paid 1.9% less than beer consumers at Quebec grocery stores, despite the fact that Ontario beer taxes are much higher than those in Quebec. In fact, Navigant calculated that the Beer Store average price with taxes excluded was actually 18% less than Quebec’s average grocery price in 2013. Low prices despite high taxes show that Ontario consumers are benefiting from the efficiencies of the Beer Store retail system. A comparison of beer prices across Canada shows that Beer Store prices are significantly lower than provinces with comparable tax rates. AVERAGE BEER RETAIL SELLING PRICE PER LITRE 2013: SELECTED PROVINCES $43.10 $43.62 $42.80 $40.76 $33.96 $33.31 $41.82 $41.17 $38.38 $39.77 $30.00 $32.00 $34.00 $36.00 $38.00 $40.00 $42.00 $44.00 $46.00 NFLD PEI NS NB QUE ONT MB SK AB BC PerCaseEquivalentPrice 4 Aron, Debra J, Ph.D. “The Price of Beer in Ontario and Quebec” Navigant Economics, May 2014 available at http://www.ontariobeerfacts.ca/studies
  • 19. Beer Store Operational Report 201318The Year in Beer Sales III. BEER STORE SALES BY CHANNEL The Beer Store is both a retail and wholesale business. As the following chart indicates the Beer Store operates 447 stores (as of December 2013) in an Ontario beverage alcohol system that includes 1,378 outlets where beer can be purchased. ONTARIO RETAIL BEER OUTLETS BEER STORE HOME CONSUMER VOLUME SALES BEER STORE PERCENTAGE SALES BY CHANNEL 2009 2010 2011 2012 2013 Beer Stores 436 437 438 443 447 Beer Store Mobile Trailers 2 2 LCBO Stores 607 611 617 623 639 LCBO Agency Stores & Beer Store Retail Partners 216 216 217 214 217 On-site Brewery Stores 39 39 43 45 73 TOTAL 1,298 1,303 1,315 1,327 1,378 2009 2010 2011 2012 2013 Home Consumer 64.70% 64% 63.86% 63.97% 63.93% Licensee 19.40% 18.80% 18.72% 18.45% 18.20% LCBO 10.80% 12.00% 12.13% 12.26% 12.54% Retail Partner/Agency 4.40% 4.60% 4.59% 4.61% 4.60% Other 0.70% 0.70% 0.71% 0.72% 0.73% Store numbers for LCBO Stores, on-site brewery stores and Agency and Beer Store Retail Partners for 2013 are provided by the LCBO. Beer Store store numbers for all years are from Beer Store data as of December 31st for that year. 4 4.1 2009 2010 2011 2012 2013 4.2 4.3 4.4 4.5 4.6 4.7 4.8 Hectolitre(millions)
  • 20. BEER STORE LICENSEE SALES BEER STORE WHOLESALE SALES BEER STORE RETAIL PARTNER/AGENCY SALES BEER STORE LCBO SALES In addition to selling beer to the public through its retail stores, the Beer Store also distributes and sells beer to LCBO stores, agency stores and Beer Store Retail Partner stores as well as 19,656 licensed bars and restaurants. Beer Store Wholesale Volume Sales Trends: • Overall wholesale sales in 2013 decreased by 57,704 hl or 2.29% • Total licensee sales declined by 50,022 hl or 3.80% • Licensee packaged beer sales declined by 40,708 hl or 6.57% • Licensee draught beer sales declined by 9,314 hl or 1.34% • Sales to LCBO increased by 530 hl or 0.06% • Agency Store/Retail Partner sales decreased by 8,212 hl or 2.50% 19Beer Store Operational Report 2013 The Year in Beer Sales 100,000 200,000 300,000 400,000 500,000 600,000 700,000 800,000 900,000 1,000,000 2009 2010 2011 2012 2013 Draught Packaged 50,000 0 100,000 150,000 200,000 250,000 300,000 350,000 400,000 2009 2010 2011 2012 2013 0 100,000 200,000 300,000 400,000 500,000 600,000 700,000 800,000 900,000 1,000,000 2009 2010 2011 2012 2013 HectolitresHectolitres Hectolitres
  • 21. Beer Store Operational Report 201320 Beer Tax Contributions FEDERAL AND PROVINCIAL BEER TAX CONTRIBUTIONS 2013 TAX EXAMPLES BY PRICE POINT 2013 : Retail Price Federal Tax Provincial Tax Total Tax 24-Discount Bottles at Minimum Social Reference Price $27.55 13.7% 34.3% 48.0% Average tBS Home Consumer Price (all packages) Converted to Case Equivalent $33.31 12.1% 31.9% 44.0% 24-Cans at Top 10 Brand Price $37.90 11.4% 33.3% 44.8% 24-Bottles Premium Priced Import $43.10 10.2% 28.9% 39.0% 24-Bottles Ontario Small Brewery (Producing 15,000hl annually) $43.40 6.3% 14.9% 21.2% Federal Excise Tax $0.3122/litre Provincial Basic Tax/LCBO Mark-up5 Ontario Beer Manufacturer Ontario Microbrewers Draught $0.5810/litre $0.2161/litre Packaged $0.7402/litre $0.2403/litre Volume Levy $0.176/litre Enviro Levy $0.0893/container HST 13% 5 Rates in effect for March 1st each year. Under the authority of the Alcohol and Gaming Regulation and Public Protection Act, 1996, basic beer tax rates for draught and packaged beer are increased on March 1st each year by the annual average amount of Ontario CPI increase from the previous three years. Beer Tax Contributions
  • 22. 21Beer Store Operational Report 2013 Beer Tax Contributions ONTARIO TAXES COLLECTED ON BEER SALES (2013) Provincial commodity taxes include revenues associated with the basic beer tax, volume levy and environmental levy remitted by brewers to the Ministry of Finance and equivalent LCBO charges on beer. Estimates of tax revenues for Beer Store and LCBO beer sales exclude sales to each other. LCBO volumes for calendar 2013 from Quarterly Reports. Tax estimates do not include foregone government revenues associated with reduced small brewer tax rates and related tax credits. The Ontario government does not publish any information related to aggregate spending related to these programs. Government Revenues Associated with Beer Store Beer Sales 2013 Provincial Commodity Taxes $598.4 Million Federal Excise Taxes $188.9 Million Goods and Services Tax (Federal Portion of HST) $113.2 Million Provincial Sales Tax (Provincial Portion of HST) $181.1 Million Total Government Beer Taxes Associated with tBS Sales $1,081.6 Million Other Government Beer Tax Revenues (LCBO Sales, On-Site Beer Stores, Licensee Sales) 2013 Provincial Commodity Taxes $205.4 Million Federal Excise Taxes $60.3 Million Retail GST (Federal portion of HST) $41.5 Million Retail PST (Provincial portion of HST) $63 Million GST on Licensee Resale (Federal portion of HST) $87.4 Million PST on Licensee Resale (Provincial portion of HST) $139.9 Million Non-Beer Store Total $597.5 Million Total Ontario Beer Commodity and Sales Taxes $1,679 Million
  • 23. Beer Store Operational Report 201322Rate Sheet SCHEDULE C BRI RATE SHEET EFFECTIVE APRIL 29, 2013 BASIC SERVICES First Next Remaining 25,000 hl 50,000 hl Volume Packaged $46.70 $52.05 $53.10 per hl Draught $39.35 $43.74 $43.90 per hl Accounts Receivable Recovery $0.50 $0.50 $0.50 per licensee hl only LISTING ADMINISTRATION FEE Base Fee + Per store, Per SKU, First 233 stores All other stores above 233 All “D” Stores Packaged $2,848.93 $227.92 $53.56 $535.63 Draught $5,697.86 $455.82 ELECTED SERVICES TRANSFERS Emergency $26.28 per hl Regular $21.76 per hl DELIVERY SERVICE TO LCBO $21.76 per hl DELIVERY SERVICE TO RETAIL PARTNERS $21.76 per hl EMPTY CONTAINER DISPOSAL Bottles (Service fee currently under review) Cans $5.85 $2.60 per hl per hl OLD CODE DISPOSAL T.B.D. VOUCHER ADMINISTRATION 5% of retail value EMPTY CONTAINER PURCHASE This charge applies to all products sold through the LCBO where the empty containers are redeemed by BRI. The charge is based on LCBO supplied sales data. $7.30 per hl NON-STANDARD CONTAINERS Industry Standard Bottles, Kegs and Cans which do not require sorting or special handling are exempt from this charge Packaged Draught $0.0499 $1.43 per unit per unit KEG REPAIR SURCHARGE $0.59 per usage DIRECT DELIVERY KEG FEE $4.49 per hl DRAUGHT BEER Non-Palletized Shipments Return of Empty Containers T.B.D. T.B.D. NOTE: GST/HST OR EQUIVALENT WILL BE ADDED TO ALL FEES WHERE APPLICABLE OTHER FEES Other fees include (but are not limited to) Liability Insurance required by the government and special services which the Brewer may engage BRI to perform from time to time. Deposits for the use of BRI pooled assets (e.g. kegs and pallets) will be levied as appropriate. Deposits will be refunded as the assets are returned. Rate Sheet
  • 24. 23Beer Store Operational Report 2013 Financial Statements Brewers Retail Inc. Financial Statements December 31, 2013 (in thousands of Canadian dollars)
  • 25. Beer Store Operational Report 201324Financial Statements PricewaterhouseCoopers LLP PwC Tower, 18 York Street, Suite 2600, Toronto, Ontario, Canada M5J 0B2 T: +1 416 863 1133, F: +1 416 365 8215 “PwC” refers to PricewaterhouseCoopers LLP, an Ontario limited liability partnership. March 20, 2014 Independent Auditor’s Report To the Shareholders of Brewers Retail Inc. We have audited the accompanying financial statements of Brewers Retail Inc., which comprise the balance sheet as at December 31, 2013 and the statements of operations and deficit and cash flows for the period from December 31, 2012 to December 31, 2013, and the related notes, which comprise a summary of significant accounting policies and other explanatory information. Management’s responsibility for the financial statements Management is responsible for the preparation and fair presentation of these financial statements in accordance with Canadian accounting standards for private enterprises, and for such internal control as management determines is necessary to enable the preparation of financial statements that are free from material misstatement, whether due to fraud or error. Auditor’s responsibility Our responsibility is to express an opinion on these financial statements based on our audit. We conducted our audit in accordance with Canadian generally accepted auditing standards. Those standards require that we comply with ethical requirements and plan and perform the audit to obtain reasonable assurance about whether the financial statements are free from material misstatement. An audit involves performing procedures to obtain audit evidence about the amounts and disclosures in the financial statements. The procedures selected depend on the auditor’s judgment, including the assessment of the risks of material misstatement of the financial statements, whether due to fraud or error. In making those risk assessments, the auditor considers internal control relevant to the entity’s preparation and fair presentation of the financial statements in order to design audit procedures that are appropriate in the circumstances, but not for the purpose of expressing an opinion on the effectiveness of the entity’s internal control. An audit also includes evaluating the appropriateness of accounting policies used and the reasonableness of accounting estimates made by management, as well as evaluating the overall presentation of the financial statements. We believe that the audit evidence we have obtained is sufficient and appropriate to provide a basis for our audit opinion.
  • 26. 25Beer Store Operational Report 2013 Financial Statements Opinion In our opinion, the financial statements present fairly, in all material respects, the financial position of Brewers Retail Inc. as at December 31, 2013 and the results of its operations and its cash flows for the period from December 31, 2012 to December 31, 2013 in accordance with Canadian accounting standards for private enterprises. Chartered Professional Accountants, Licensed Public Accountants
  • 27. Beer Store Operational Report 201326Financial Statements Brewers Retail Inc. Balance Sheet (in thousands of Canadian dollars) The accompanying notes are an integral part of these financial statements. Approved by the Board of Directors __________________________________ Director _________________________________ Director December 31, 2013 $ December 30, 2012 $ Assets Current assets Cash and cash equivalents (note 4) 34,018 51,395 Accounts receivable Brewers (note 12) 5,840 8,214 Others (note 12) 40,235 45,164 Empties deposits 3,182 3,242 Inventories (note 5) 147,277 137,936 Prepaid expenses and deposits 2,539 2,080 233,091 248,031 Property and equipment (note 6) 123,416 128,250 Intangible assets (note 7) 8,399 3,661 Future income tax assets (note 13) 11,710 14,000 Pension benefit asset (note 8) 114,462 111,511 491,078 505,453 Liabilities Current liabilities Accounts payable and accrued liabilities Brewers (notes 9 and 12) 195,398 195,540 Other (note 9) 105,570 98,107 300,968 293,647 Accrued benefit liability (note 8) 78,725 98,032 379,693 391,679 Shareholders’ Equity Capital stock (note 10) 200,367 200,382 Deficit (88,982) (86,608) 111,385 113,774 491,078 505,453 Commitments and contingencies (note 11)
  • 28. 27Beer Store Operational Report 2013 Financial Statements Brewers Retail Inc. Statement of Operations and Deficit (in thousands of Canadian dollars) The accompanying notes are an integral part of these financial statements. Period from December 31, 2012 to December 31, 2013 $ Period from January 2, 2012 to December 30, 2012 $ Revenue Service charges (note 12) 298,983 301,705 Other 87,320 83,615 386,303 385,320 Expenses Operating (note 12) 349,027 359,138 Administration 6,214 6,416 Amortization (notes 6 and 7) 18,326 18,248 373,567 383,802 Income before income taxes 12,736 1,518 Provision for (recovery of) future income taxes (note 13) 2,290 (2,000) Net income for the period 10,446 3,518 Deficit - Beginning of period (86,608) (88,608) Premium on redemption of shares (note 10) (12,820) (1,518) Deficit - End of period (88,982) (86,608)
  • 29. Beer Store Operational Report 201328Financial Statements Brewers Retail Inc. Statement of Cash Flows (in thousands of Canadian dollars) The accompanying notes are an integral part of these financial statements. Period from December 31, 2012 to December 31, 2013 $ Period from January 2, 2012 to December 30, 2012 $ Cash provided by (used in) Operating activities Net income for the period 10,446 3,518 Add (deduct): Non-cash items Amortization 18,326 18,248 Future income taxes 2,290 (2,000) Defined benefit plan expenses (note 8) 32,774 33,292 Change in accrued benefit liability (19,307) 5,755 Gain on disposal of property and equipment (note 6) (5,811) (5,528) Defined benefit plan contributions (note 8) (35,725) (23,273) 2,993 30,012 Change in non-cash operating working capital balances (note 17) 1,545 (5,723) 4,538 24,289 Investing activities Purchase of property and equipment (note 6) (17,369) (17,066) Proceeds on sale of property and equipment (note 6) 8,289 8,151 (9,080) (8,915) Financing activities Redemption of shares (12,835) (1,520) Increase (decrease) in cash and cash equivalents during the period (17,377) 13,854 Cash and cash equivalents - Beginning of period 51,395 37,541 Cash and cash equivalents - End of period 34,018 51,395
  • 30. 29Beer Store Operational Report 2013 Financial Statements Brewers Retail Inc. Notes to Financial Statements December 31, 2013 (in thousands of Canadian dollars) (1) 1 Description of business Brewers Retail Inc. (the company) is owned by three brewers: Molson Canada 2005, Labatt Brewing Company Limited, and Sleeman Breweries Ltd. (collectively the Brewers or shareholders) and, pursuant to an operating agreement, acts as a sales centre for the products of the Brewers in the Province of Ontario. In 2013, the company changed its fiscal year-end to coincide with the calendar year. Accordingly, the fiscal 2013 ended December 31, 2013. 2 Summary of significant accounting policies and basis of presentation The financial statements have been prepared in accordance with Canadian accounting standards for private enterprises as issued by the Canadian Accounting Standards Board, and they have been applied within the framework of the significant accounting policies summarized below. Revenue recognition Service charges revenue is primarily earned based on the volume of products distributed at rates determined annually. The difference, if any, between service charges revenue and costs and expenses incurred is allocated among the owner-breweries in accordance with the terms of the shareholders’ agreement and recorded as an adjustment to service charges revenue. Other revenues consist of empty containers fee, recycling fee, product sale, promotional revenue, and dispensing services. The revenue is recorded at the point where the service has been performed or the products have been delivered. Cash and cash equivalents Cash and cash equivalents include cash on hand and highly liquid investments with a maturity of less than three months from the date of acquisition. Short-term investments are recorded at cost plus accrued interest, which approximates fair value. Inventories Inventories of beer are valued at cost, which equals the selling price. Related products inventory and dispensing equipment are recorded at the lower of cost and net realizable value. Empties deposits Empties deposits represent the deposit value of empty containers collected and received.
  • 31. Beer Store Operational Report 201330Financial Statements Brewers Retail Inc. Notes to Financial Statements December 31, 2013 (in thousands of Canadian dollars) (2) Property and equipment Property and equipment are recorded at cost less accumulated amortization and any impairment loss. The company assesses property and equipment for recoverability whenever indicators of impairment exist. If the carrying value of the asset exceeds the estimated net recoverable amount of the asset, then an impairment loss is recognized to write the asset down to its fair value. Property and equipment are amortized over their estimated useful lives on a straight-line basis as follows: Buildings 40 years Leasehold improvements over term of the leases Machinery, equipment and operating system 3 - 20 years Single aperture kegs 20 years Pallets 4 years Intangible assets Software is carried at cost less accumulated amortization and accumulated impairment losses. Acquired computer software is capitalized on the basis of the costs incurred to acquire licences and install the specific software. Amortization is calculated on the cost of the asset less its residual value. Software is amortized on a straight-line basis over periods ranging from three to seven years. The amortization method, useful lives and residual values are reviewed annually. The company assesses software for recoverability whenever indicators of impairment exist. If the carrying value of the asset exceeds the estimated net recoverable amount of the asset, then an impairment loss is recognized to write the asset down to its fair value. Pension costs Pension costs are determined using actuarial methods. Net periodic benefit cost is charged to income and includes: i) the cost of pension benefits provided in exchange for employees’ services rendered during the year; ii) the interest cost of pension obligations; iii) the expected long-term return on pension fund assets; iv) the amortization of prior service costs and amendments over the expected average remaining service life of the employee group covered by the plans; and v) the amortization of cumulative net actuarial gains and losses in excess of 10% of the greater of the beginning of year balances of the projected benefit obligation or market-related value of plan assets, over the expected average remaining service life of the employee group covered by the plans.
  • 32. 31Beer Store Operational Report 2013 Financial Statements Brewers Retail Inc. Notes to Financial Statements December 31, 2013 (in thousands of Canadian dollars) (3) The pension plans are funded through contributions determined in accordance with the projected unit credit actuarial cost method. Post-retirement benefits other than pensions The company accrues the cost of post-retirement benefits other than pensions using actuarial methods. These benefits, which are funded as they come due, include life insurance programs, medical and dental benefits. The company amortizes the cumulative net actuarial gains and losses in excess of 10% of the projected benefit obligation at the beginning of the year, over the expected average remaining service life of the employee group covered by the plan. Post-employment benefits other than pensions The company provides long-term disability benefits to active employees. These benefits, which are funded as they come due, include salary continuation while the employees are deemed not to be physically and mentally fit to perform the essential duties of their normal occupation. The company recognizes net actuarial gain and losses immediately in income in the year they arise. Income taxes Income tax expenses for the year comprise current and future income taxes. Income taxes are recognized in the statement of operations. Levies other than income taxes, such as taxes on real estate, are included in administrative expenses.  Current income taxes Current income tax expense is based on the results of the period and is adjusted for items that are not taxable or deductible. Current income taxes are calculated using income tax rates and laws that were substantively enacted at the end of the reporting period. Management periodically evaluates positions taken in the preparation and filing of income tax returns with respect to situations in which applicable income tax regulations are subject to interpretation. Provisions are established, where appropriate, on the basis of amounts expected to be paid to the tax authorities.  Future income taxes Future income taxes are recognized, using the liability method, on temporary differences arising between the income tax bases of assets and liabilities and their carrying amounts in the financial statements. Future income taxes are determined using income tax rates and laws that have been enacted or substantively enacted by the balance sheet date and are expected to apply when the related future income tax asset is realized or the future income tax liability is settled. Future income tax assets are recognized only to the extent that it is probable that future taxable profit will be available, against which the temporary differences can be utilized.
  • 33. Beer Store Operational Report 201332Financial Statements Brewers Retail Inc. Notes to Financial Statements December 31, 2013 (in thousands of Canadian dollars) (4) Future income tax assets and future income tax liabilities are offset when there is a legally enforceable right to offset current income tax assets against current income tax liabilities and when the future income tax assets and future income tax liabilities relate to income taxes levied by the same taxation authority and when there is an intention to settle the balances on a net basis. 3 Critical accounting estimates and judgments The preparation of these financial statements requires management to make estimates and judgments that affect the reported and disclosed amounts of assets, liabilities, revenues and expenses in the financial statements and accompanying notes. Management bases its estimates and judgments on historical experience and on various other assumptions that it considers to be reasonable. The resulting accounting estimates will, by definition, seldom equal the related actual results. Actual results could differ from those estimates under different assumptions or conditions. Impairment The company reviews other non-financial assets when there is any indication that the asset might be impaired. Employee future benefits The present value of the retirement benefit obligation depends on a number of factors that are determined on an actuarial basis using a number of assumptions. The assumptions used in determining the employee future benefits expense include the discount rate. Any changes in these assumptions will impact the amount of the employee future benefits obligation disclosed in the financial statements. The company determines the appropriate discount rate at the end of each year. This is the interest rate that is used to determine the present value of estimated future cash outflows expected to be required to settle the employee future benefits obligation. In determining the appropriate discount rate, the company considers the interest rates of high-quality corporate bonds that are denominated in Canadian dollars and have terms to maturity approximating the terms of the related future benefit obligation. Other key assumptions for the employee future benefits obligation are based on current market conditions. Additional information is disclosed in note 8. 4 Cash and cash equivalents Included in cash and cash equivalents is $107 (December 30, 2012 - $107) that has been pledged as collateral on letters of credit of up to $500. The company has a bank overdraft facility of up to $150, of which $nil (December 30, 2012 - $nil) is outstanding. The company holds a one-year guaranteed investment certificate of $900 that will mature in 2014.
  • 34. 33Beer Store Operational Report 2013 Financial Statements Brewers Retail Inc. Notes to Financial Statements December 31, 2013 (in thousands of Canadian dollars) (5) 5 Inventories December 31, 2013 $ December 30, 2012 $ Beer 144,896 135,520 Related products 499 367 Dispensing equipment 1,854 2,016 Keg repair materials 28 33 147,277 137,936 6 Property and equipment December 31, 2013 December 30, 2012 Cost $ Accumulated amortization $ Net $ Net $ Land 7,070 - 7,070 7,614 Buildings 106,640 47,870 58,770 60,243 Construction-in-progress 2,836 - 2,836 2,516 Leasehold improvements 57,024 28,951 28,073 26,449 Machinery, equipment and operating system 55,313 32,932 22,381 25,821 Single aperture kegs 6,653 5,323 1,330 1,660 Pallets 7,219 4,263 2,956 3,947 242,755 119,339 123,416 128,250 The company disposed of assets with a net carrying value of $2,478 (December 30, 2012 - $2,623) for net proceeds of $8,289 (December 30, 2012 - $8,151) and recognized a gain on sale of $5,811 (December 30, 2012 - $5,528). An amortization expense of $17,413 (December 30, 2012 - $17,380) has been charged in amortization expense. 7 Intangible assets December 31, 2013 December 30, 2012 Cost $ Accumulated amortization $ Net $ Net $ Software 2,901 1,781 1,120 2,033 SAP - construction-in-process 7,279 - 7,279 1,628 10,180 1,781 8,399 3,661 An amortization expense of $913 (December 30, 2012 - $868) has been charged in amortization expense.
  • 35. Beer Store Operational Report 201334Financial Statements Brewers Retail Inc. Notes to Financial Statements December 31, 2013 (in thousands of Canadian dollars) (6) 8 Employee future benefits The company maintains various defined contribution, defined benefit pension plans providing pension and other retirement and post-employment benefits for both salaried and hourly paid employees. Costs for employee future benefits are accrued over the periods in which employees earn the benefits. The company also maintains certain post-employment medical benefit plans. A summary of the balance sheets and statements of operations is shown below. December 31, 2013 December 30, 2012 Defined benefits pension plans $ Other post- employment $ Defined benefits pension plans $ Other post- employment $ Accrued benefit obligation Balance - Beginning of year 821,273 82,512 772,578 82,726 Plan amendments (1,943) (29,519) 4,988 - Current service costs 13,573 3,062 14,319 6,467 Past service costs 6,000 - - Interest cost 33,749 2,353 34,273 3,458 Settlement - (1,138) - Actuarial loss (gain) (89,241) (6,595) 28,377 (6,341) Benefits payments (34,332) (4,797) (33,262) (3,798) Balance - End of year 749,079 45,878 821,273 82,512 Fair value of plan assets Balance - Beginning of year 616,038 - 566,573 Actual return on plan assets 82,229 - 59,454 Benefit payments (33,711) (4,797) (33,262) (3,798) Employer contributions 35,725 4,797 23,273 3,798 Balance - End of year 700,281 - 616,038 - Funded status - plan deficit (48,798) (45,878) (205,235) (82,512) Unamortized actuarial loss (gain) 130,533 (8,459) 278,785 (12,274) Unamortized past service costs 32,727 (24,388) 37,961 (3,246) Accrued benefit asset (liability) 114,462 (78,725) 111,511 (98,032)
  • 36. 35Beer Store Operational Report 2013 Financial Statements Brewers Retail Inc. Notes to Financial Statements December 31, 2013 (in thousands of Canadian dollars) (7) Other information about the company’s defined benefit plans and other benefit plans is as follows: Pension benefit plans Other benefit plans December 31, 2013 $ December 30, 2012 $ December 31, 2013 $ December 30, 2012 $ Net expenses 32,774 33,292 (14,510) 9,555 Company’s contributions made 35,725 23,273 4,797 3,798 Benefits paid 33,711 33,262 4,797 3,798 In 2013, the company offered eligible retired employees a voluntary buyout to permanently opt out of their post-retirement health and life insurance coverage in exchange for a lump sum payment. The company settled $1,138 of benefits for $897 in cash payout and incurred costs of $190 to administer the settlement. The significant actuarial assumptions adopted in measuring the company’s accrued benefit obligations are as follows: December 31, 2013 % December 30, 2012 % Discount rate (Salary Plan) 4.80 4.20 Discount rate (Bargaining Plan) 5.00 4.20 Discount rate (LTD Plan) 3.80 3.30 Discount rate (PRB Plan) 4.90 4.20 Long-term rate of return on plan assets 7.00 7.00 Rate of compensation increase 2.00 2.00 For measurement purposes, a 7.0% annual rate of increase in the per capita cost of drugs and other medical benefits was assumed for fiscal 2013 and 2012. The rate is assumed to decrease by 0.5% per year to a minimum of 5%. Plan assets comprise the following: December 31, 2013 $ December 30, 2012 $ Equity instruments 413,226 381,943 Debt instruments 283,488 231,015 Cash and cash equivalents 3,567 3,080 700,281 616,038 In the event that the discount rate used changed by o.5% from management’s estimates, the carrying (amount of the present value of the obligation) would change by $4,028 (December 30, 2012 - $4,520).
  • 37. Beer Store Operational Report 201336Financial Statements Brewers Retail Inc. Notes to Financial Statements December 31, 2013 (in thousands of Canadian dollars) (8) 9 Accounts payables and accrued liabilities December 31, 2013 $ December 30, 2012 $ Owner brewers 195,398 195,540 Other brewers 43,091 39,678 Other payables and accrued liabilities 62,479 58,429 300,968 293,647 10 Capital stock Authorized 197,700 first preference shares, eight dollars, Series A, redeemable at one hundred dollars each 10,000 Class A shares, non-voting 20,000 Class B shares, non-voting, redeemable at ten thousand dollars each, contingent on certain future events Unlimited Class C shares, non-voting, redeemable at one hundred dollars each, contingent on certain future events Unlimited Class D shares, non-voting, redeemable at one hundred dollars each, contingent on certain future events 1,000 common shares Issued and outstanding December 31, 2013 $ December 30, 2012 $ 10,000 Class A shares 100 100 20,000 (2012 - 20,000) Class B shares 200,000 200,000 604,312 (2012 - 610,145) Class C shares 84 91 903,716 (2012 - 913,086) Class D shares 83 91 1,000 common shares 100 100 200,367 200,382 49,247 (December 30, 2012 - 5,837) Class C shares were redeemed for $4,925 (December 30, 2012 - $583), with a premium of $4,918 (December 30, 2012 - $582). 79,099 (December 30, 2012 - 9,370) Class D shares were redeemed for $7,910 (December 30, 2012 - $937) with a premium of $7,902 (December 30, 2012 - $936).
  • 38. 37Beer Store Operational Report 2013 Financial Statements Brewers Retail Inc. Notes to Financial Statements December 31, 2013 (in thousands of Canadian dollars) (9) 11 Commitments and contingencies The company has commitments under operating leases for properties, vehicles, cars and equipment that require future minimum annual payments as follows: $ 2014 29,697 2015 24,668 2016 18,073 2017 14,230 2018 10,825 Thereafter 36,335 133,828 The company is a defendant in litigation arising in the normal course of business. The company believes that the ultimate resolution of these matters will not materially affect the company’s financial condition or income. 12 Related party transactions and balances The company carried out the following transactions in accordance with the terms of the shareholders’ agreement during the period and had balances at the end of the period with these entities as follows: December 31, 2013 $ December 30, 2012 $ Service charges revenue 222,322 227,113 Operating costs charged to Brewers’ Distributor Ltd. 4,300 4,214 Accounts receivable - Brewers 4,257 6,541 Accounts receivable - other - Brewers’ Distributor Ltd. 442 5,471 Accounts payable and accrued liabilities - Brewers 195,398 195,540 Brewers’ Distributor Ltd. is an affiliated company controlled by the shareholders. The above transactions were in the normal course of operations and were recorded at the exchange value, which represents the amount of consideration established and agreed to by the related parties. In addition to these amounts, the company has transactions in the normal course of business with a number of other breweries owned or controlled by the Brewers. These amounts are included in accounts receivable - others, accounts payable - others and service charges and other revenue.
  • 39. Beer Store Operational Report 201338Financial Statements Brewers Retail Inc. Notes to Financial Statements December 31, 2013 (in thousands of Canadian dollars) (10) 13 Income taxes The analysis of deferred income tax assets is as follows: December 31, 2013 $ December 30, 2012 $ Deferred income tax assets To be recovered after more than 12 months 7,710 10,625 To be recovered within 12 months 4,000 3,375 11,710 14,000 The movement in the deferred income tax balances is as follows: December 31, 2013 $ December 30, 2012 $ As at January 1 14,000 12,000 (Credited) charged to the statement of operations (2,290) 2,000 As at December 31 11,710 14,000 Income tax (recovery) expense December 31, 2013 $ December 30, 2012 $ Current income taxes - - Deferred income taxes Origination and reversal of temporary differences 2,290 (2,000) 2,290 (2,000) The current income taxes on the company’s profit before income taxes differ from the theoretical amount that would arise using the weighted average income tax rate applicable to income as follows: December 31, 2013 $ December 30, 2012 $ Income taxes calculated at domestic rates applicable to income 3,399 378 Income tax effects of Permanent difference (643) (666) Temporary difference (1,701) 2,401 Utilization of previously unrecognized income tax losses (1,055) (2,113) Current income taxes - - The weighted average applicable income tax rate was 26.5% (December 30, 2012 - 25.0%).
  • 40. 39Beer Store Operational Report 2013 Financial Statements Brewers Retail Inc. Notes to Financial Statements December 31, 2013 (in thousands of Canadian dollars) (11) 14 Government remittances Government remittances consist of amounts (such as property taxes, sales taxes, payroll withholding taxes and LCBO remittances) required to be paid to the government authorities and are recognized when the amounts come due. In respect to government remittances, $36,880 (December 30, 2012 - $38,967) is included in accounts payable and accrued liabilities. 15 Financial instruments Financial assets and liabilities are recognized when the company becomes a party to the contractual provisions of the instrument. Financial assets are derecognized when the rights to receive cash flows from the assets have expired or have been transferred and the Company has transferred substantially all risks and rewards of ownership. Financial liabilities are derecognized when the obligation specified in the contract is discharged, cancelled or expires. The company’s financial assets and liabilities are classified into the following categories:  cash and cash equivalents as held-for-trading, which are measured at fair value;  accounts receivable are non-derivative financial assets with fixed or determinable payments that are not quoted in an active market. The company’s accounts receivable comprise trade receivables and are included in current assets due to their short-term nature. Accounts receivables are initially recognized at the amount expected to be received, less, when material, a discount to reduce the account receivables and notes receivable to fair value. Subsequently, accounts receivable are measured at amortized cost using the effective interest method less a provision for doubtful accounts; and  payable and accrued liabilities as other financial liabilities, which are measured at amortized cost. Financial liabilities are initially recognized at the amount required to be paid, less, when material, a discount to reduce the payables to fair value. Subsequently, financial liabilities are measured at amortized cost using the effective interest method. These are classified as current liabilities if payment is due within 12 months. Credit risk In the normal course of business, the company is exposed to credit risk from its accounts receivable from customers. The carrying values of accounts receivable are net of applicable revenue provisions and allowances for doubtful accounts. Allowances for doubtful accounts are estimated based on past experience, specific risks associated with the customer and other relevant information. Interest rate risk Interest rate risk is the risk the fair value or future cash flows of a financial instrument will fluctuate because of changes in market interest rates. The company does not hold any significant interest bearing assets.
  • 41. Beer Store Operational Report 201340Financial Statements Brewers Retail Inc. Notes to Financial Statements December 31, 2013 (in thousands of Canadian dollars) (12) Foreign currency risk The company is exposed to currency risks as a result of exchange rate fluctuations and the volatility of these rates. In the normal course of business, the company has financial assets and liabilities that are denominated in US dollars. The company transacts in US dollars for income and expense transactions and carries US dollars in the bank account for this purpose. The risk in this area is assessed by the company to be insignificant. Liquidity risk Liquidity risk is the risk the company will not be able to meet its financial obligations as they fall due. The exposure to liquidity risk is dependent on the collection of accounts receivable. The company manages its liquidity risk by monitoring its operating requirements. The company prepares budgets and forecasts to monitor this risk. There has been no change to this risk exposure since 2012. Price risk Price risk is that the fair value or future cash flows of a financial instrument will fluctuate because of changes in market prices (other than those arising from interest rate risk or currency risk), whether those changes are caused by factors specific to the individual financial instrument or its issuer, or factors affecting all similar financial instruments traded in the market. The company does not hold any instruments that could have the exposure to cash flow interest rate risk. 16 Capital management The company’s capital consists of share capital and deficit. The company’s objectives in managing capital are to ensure adequate operating funds are available to maintain its business activities and to provide a cost-effective operation to its shareholders. Additionally, the company aims to ensure sufficient liquidity to support its stores, execute its business plans and enable the internal financing of capital projects. The company’s primary uses of capital are to finance non-cash working capital along with capital expenditures for new store additions, existing store renovation projects, information technology software and hardware purchases and equipment purchases. The company currently funds these requirements out of its internally generated cash flows. The company is not subject to any externally imposed capital requirements. There has been no change with respect to the overall capital risk management strategy during the period.
  • 42. 41Beer Store Operational Report 2013 Financial Statements Brewers Retail Inc. Notes to Financial Statements December 31, 2013 (in thousands of Canadian dollars) (13) 17 Change in non-cash operating working capital balances December 31, 2013 $ December 30, 2012 $ Decrease (increase) in accounts receivable Brewers 2,374 (636) Others 4,929 (1,374) Empties deposits 60 (248) Change in inventories (9,341) 1,629 Change in prepaid expenses and deposits (459) 284 Change in accounts payable and accrued liabilities 7,321 (3,348) Change in accounts payable and accrued liabilities in relation to purchase of property, plant and equipment and intangible assets (3,339) (2,030) 1,545 (5,723) 18 Comparative figures Certain comparative figures have been reclassified to conform to the financial statement presentation adopted in the current year.