Slope Stability in Cohesive Soils
•
9 likes•1,153 views

1. Soil slopes become unstable when the shear stress along a failure plane exceeds the shear strength of the soil. This can occur along distinct layers within a slope. 2. One defined failure plane is the interface between a sloping soil layer and an underlying impermeable layer. The overlying soil is prone to sliding failure along this interface. 3. Stability charts can be used to analyze slope failures in cohesive soils, accounting for soil cohesion, internal friction angle, and slope geometry.

Recommended
More Related Content
What's hot
What's hot (20)
Viewers also liked
Viewers also liked (20)
Similar to Slope Stability in Cohesive Soils
Similar to Slope Stability in Cohesive Soils (20)
More from Prionath Roy
More from Prionath Roy (16)
Slope Stability in Cohesive Soils
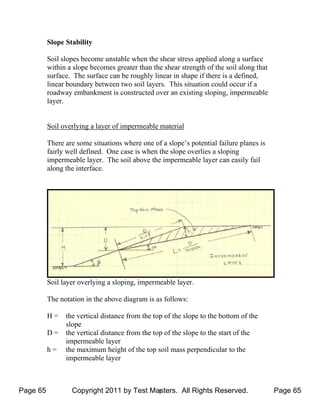
- 1. 1 Slope Stability Soil slopes become unstable when the shear stress applied along a surface within a slope becomes greater than the shear strength of the soil along that surface. The surface can be roughly linear in shape if there is a defined, linear boundary between two soil layers. This situation could occur if a roadway embankment is constructed over an existing sloping, impermeable layer. Soil overlying a layer of impermeable material There are some situations where one of a slope’s potential failure planes is fairly well defined. One case is when the slope overlies a sloping impermeable layer. The soil above the impermeable layer can easily fail along the interface. Soil layer overlying a sloping, impermeable layer. The notation in the above diagram is as follows: H = the vertical distance from the top of the slope to the bottom of the slope D = the vertical distance from the top of the slope to the start of the impermeable layer h = the maximum height of the top soil mass perpendicular to the impermeable layer Page 65 Copyright 2011 by Test Masters. All Rights Reserved. Page 65
- 2. 2 )(sin sin αβ β −= D h β = the angle of the impermeable layer at the toe of the slope α = the angle of the top soil layer at the intersection of the impermeable layer L = the contact distance between the top soil layer and the impermeable layer The following quantities are needed to calculate the factor of safety against sliding between the 2 layers: 2 γLh W = Where W = the weight of the soil in the top soil layer γ = the unit weight of the soil layer L and h as defined above Fs = W(sin α) Where Fs = the magnitude of the force trying to cause sliding Rs = cL + W(cos α)(tan δ) Where Rs = the magnitude of the force trying to resist sliding δ = the angle of friction between the top and impermeable layers c = the cohesion of the impermeable soil layer The factor of safety against sliding is equal to: F.S.sliding = Rs/Fs Slope failure in cohesionless soil (c = 0 and Φ > 0) Sand that is sloped at an angle from the horizontal (β) greater than its angle of internal friction (Φ) will fail by sliding. The factor of safety of sloped sand against sliding is: F.S.sliding = tan Φ/tan β Page 66 Copyright 2011 by Test Masters. All Rights Reserved. Page 66
- 4. 4 Slope failure in cohesive soils (c > 0, and Φ ≥ 0) There are several methods that can be used to determine the stability of slopes in cohesive soils. The least time consuming method makes use of a stability number and 2 charts. Which chart to use depends upon whether or not the cohesive soil has an angle of internal friction, Φ equal to 0 or greater than 0. It is generally assume that saturated clay has an angle of internal friction, Φ = 0. Types of slope failure There are three general ways that slopes fail based on where the failure exits the slope: the toe, the base or the slope. Diagrams of each failure are shown below. The following notation is used in each of the failure diagrams: H = the vertical distance from the top of the slope to the bottom (base of the slope, D = the vertical distance from the bottom of the slope to the top of an underlying stiff layer. It is assumed that the slope failure will not extend into the stiff layer, β = the angle that the bottom (aka toe) of the slope makes with the horizontal Schematic of a toe failure. Page 68 Copyright 2011 by Test Masters. All Rights Reserved. Page 68
- 5. 5 Schematic of a base failure. Schematic of a slope failure. Slope stability charts The 2 slope stability charts provided below should be sufficient to handle most slope failure problems relating to cohesive (clay) soils. Page 69 Copyright 2011 by Test Masters. All Rights Reserved. Page 69
- 6. 6 Slope stability chart for slopes with Φ = 0. From: Soils and Foundations 7th edition, Cheng Liu and Jack Evett, Pearson Prentice Hall, New Jersey, 2008. Page 70 Copyright 2011 by Test Masters. All Rights Reserved. Page 70
- 7. 7 Slope stability chart for slopes with Φ > 0. From: Soils and Foundations 7th edition, Cheng Liu and Jack Evett, Pearson Prentice Hall, New Jersey, 2008. Chart Notation The following notation is used in both of the slope stability charts shown above: Ns = the slope stability number = c H))('(γ Page 71 Copyright 2011 by Test Masters. All Rights Reserved. Page 71
- 8. 8 Where γ‘ = the effective unit weight of the failing soil, if the soil is above the water table then use γ (total unit weight) H = the vertical height of the slope as shown on the slope failure diagrams above c = the cohesion of the failing soil The height of the slope is related to the depth to the stiff or unyielding layer by a factor called nd. nd = H DH + (see slope failure diagrams above) Where H = the vertical height of the slope D = the vertical distance from the bottom of the slope to the unyielding layer Φ = the angle of internal friction of the failing soil. Using the charts Problems involving slope stability can involve analyzing an existing slope where c, H, β, γ‘ and Φ are given to determine if the required factor of safety has been satisfied. Problems can also involve determining the maximum angle of the slope (β), or the height of the slope (H) that will still meet the required factor of safety. Special Conditions If β is greater than 53° then the failure surface will always be a toe circle. If nd is greater than 4 then the failure surface will always be a base circle. Page 72 Copyright 2011 by Test Masters. All Rights Reserved. Page 72