1. Categorization and standardization of accidental risk-criticality levels
of human error to develop risk and safety management policy
Pramod Kumar a
, Suprakash Gupta b,⇑
, Mudit Agarwal c
, Umesh Singh a
a
Department of Science and Technology – Centre for Interdisciplinary and Mathematical Sciences, BHU, Varanasi 221005, India
b
Department of Mining Engineering, Indian Institute of Technology (BHU), Varanasi 221005, India
c
Churcha Underground Mine, CIL, Baikunthpur, Chhattisgarh 497001, India
a r t i c l e i n f o
Article history:
Received 17 September 2015
Received in revised form 7 December 2015
Accepted 11 January 2016
Keywords:
Human error
Risk categorization
Support vector machine
Risk and safety management
Mining activity
a b s t r a c t
In addition to increasing mechanization, technology upgradation and process automation, safety
enhancement in systems operation is one of the key parameters of productivity improvement. Now, it
is an established fact that human error plays a crucial role in accidents and needs to be addressed ade-
quately in risk and safety management. This paper aims at assessing, categorizing and setting standards
for human error risk and criticality of system activities. Based on the classification and standardizations
of human error rate, consequences of human error and criticality index of errors, different policy deci-
sions for risk and safety management are suggested. The proposed methodology has been demonstrated
with reference to the system activities of an underground coal mining system. However developed
method can be equally adapted to other systems.
Ó 2016 Elsevier Ltd. All rights reserved.
1. Introduction
Continuous pressure for safely increasing productivity coupled
with growing awareness about the safety standards has boosted
industries to highlight the safety and risk issues. Various industries
have agreed that human errors play the crucial role in accidental
property damage, personal injury, and sometimes even death
(Bennet and Passmore, 1985; Trager, 1985; Rimmington, 1989;
Chadwell et al., 1999; Hobbs and Williamson, 2003; Ung et al.,
2006; Chen et al., 2012). Injury and fatality rates in industries
which have harsh and hazardous workplace environment, as in
mining, are unacceptably high compared to their counterpart
industries. Paul et al. (2005), Paul and Maiti (2007) and Ghosh
and Bhattacherjee (2007) have studied the effect of demographic,
behavioral, and environmental factors on personal injuries of mine
workers in India. Landre and Gibb (2002) have reported that min-
ing has only 1% of global work force, but it is responsible for 5%
work related fatal accidents. A study by the US Bureau of Mines
found that almost 85% of all mining accidents can be attributed
to at least one human error (Rushworth and Tallbot, 1999). In Aus-
tralia, two out of every three occupational accidents can be attrib-
uted to human errors (Hobbs and Williamson, 2003). These studies
show that analysis and management of the human error aspect
need to be integrated into the design criteria to reduce inherent
designed error opportunities and enhance error recovery chances
for improving the safety status of the systems.
Major policy decisions in risk and safety management are based
on the analysis of past incidences. Accident data do not tell the
type of error(s) behind the accident, and it may be inferred from
the retrospective analysis of information related to the nature of
the activity, crew members and the manifestation of error. Rivera
et al. (2011) have rightly said that there is no clearly defined
boundary for the membership of a particular type of error as the
cause of an accident. Elimination or reduction of human error from
various stages of a system to augment its safety and productivity
necessitates a detailed analysis of human error (Swain and
Guttmann, 1983). Several industry specific techniques have been
developed for human reliability analysis (HRA) and error modeling.
This restricts the sharing of knowledge, information and data in
intra-domain analysis and management of human error. One of
the most popular Generic Error Modeling (GEMS) approach has
been proposed by Reason (1987). He has classified human error
integrating behavioral, contextual and conceptual levels. Second
generation HRA techniques such as Cognitive Reliability and Error
Analysis Method (CREAM) (Hollnagel, 1998) assume that human
error occurs due to the error in cognition process, influenced by
a set of common performance factors, (CPFs), while A Technique
for Human Error Analysis (ATHEANA) (Cooper et al., 1996) assumes
http://dx.doi.org/10.1016/j.ssci.2016.01.007
0925-7535/Ó 2016 Elsevier Ltd. All rights reserved.
⇑ Corresponding author. Tel.: +91 5426702386; fax: +91 5422369442.
E-mail addresses: pk.saini253@gmail.com, pramod.0132@rediffmail.com
(P. Kumar), sgupta.min@itbhu.ac.in, suprakash_gupta@yahoo.co.in (S. Gupta),
mudit.agarwal.min09@itbhu.ac.in (M. Agarwal), usingh_52@yahoo.co.in (U. Singh).
Safety Science 85 (2016) 88–98
Contents lists available at ScienceDirect
Safety Science
journal homepage: www.elsevier.com/locate/ssci
2. human error rate (HER) is a function of performance shaping fac-
tors (PSFs) and plant reliability. The outcome of the HRA is used
to identify weak links in the system and to guide to preparing
intervention strategies for safety improvement. In these widely
used HRA methods, human error risk analysis depends heavily on
the experts’ judgements and the consensus of the judges. There-
fore, uncertainty is inherently imbedded into the analysis. The pro-
posed model relies much on the statistical analysis of past
performance and hence, takes due care of judgemental uncertainty
in the analysis.
Risk control and safety enhancement process concentrates on
the priority issues. Risk potential based ranking of actions for off-
shore operation has been proposed by Khan et al. (2006). Maiti
et al. (2009) have presented an elaborate retrospective study of
Indian coal mine accidents and identified the risk factors and esti-
mated the risk. Khanzode et al. (2010) have ranked the risk poten-
tial of mining activities through incident attributes such as
‘person’, ‘system’, ‘interaction-person’ and ‘interaction-system’.
Maiti (2010) has considered the time between occurrences of inju-
ries and the number of injuries per month to estimate safety per-
formance of an underground coal mining system. These studies
fail to address human error aspects adequately in risk estimation.
However, assessment of criticality of human errors and devising
their management strategies are key to HRA based safety and risk
management.
Setting standards for risk criticality is an integral part of system
approach to risk and safety management. Risk standardizations
provide guidance on how to identify unacceptable risks and their
impacts. These are further directed toward the design of enablers
for system’s risk aversion and safety enhancement. They are
devised to avoid, mitigate, and manage risks and impacts of human
error as a way of developing safety functions. This study intends to
answer the following questions. How are the:
Risk potential of human error assessed?
Benchmark values of different risk levels decided?
Target areas identified for safety improvement?
Risk and safety management policy of human error developed?
Suitable interventions for human errors and their consequences
selected?
The proposed methodology is based on retroactive analysis of
past incidents/accidents and has been explained in reference to
the collected data from the safety division of three Indian under-
ground coal mines. Probable human errors behind every incidence
have been accounted and analyzed for error rate, consequences of
error and criticality. Risk levels and criticality values have been cat-
egorized using k-means clustering technique and cluster bound-
aries have been drawn by using support vector machine (SVM)
as a linear classifier. Developed risk-criticality diagram guided risk
and safety management policy has been framed. A graphical repre-
sentation of the methodology is given in Fig. 1.
2. Human error and its consequences
Human error infests almost every aspect of human life (Peters
and Peters, 2006) but often shows no concern at all or little con-
cern. Knowledge and error flow from the same mental sources,
and only success can discriminate one from the other (Mach,
1976). One may define errors as the human actions that fail to pro-
duce the desired result. Sanders and McCormick (1997) have
defined human error as ‘an inappropriate or undesirable human
decision or behavior that reduces, or has the potential of reducing
effectiveness, safety or system performance’. Swain (1989) has
described human error as ‘any member of a set of human actions
or activities that exceeds some limits of acceptability, means out
of tolerance performances’ and this limit has to be decided by
the system. Any wrong action can be justifiable in some system
until it does not lead to the occurrence of any incident and later
it is categorized as human error. Therefore, human error is a subset
of human actions, i.e., responses initiated by the sensory triggers
that do not produce the desired result. Sensory organs of humans
continuously scan the environment, be it physical or subjective.
A change in the environment acts as a sensory trigger. Human
response is the sum of four functions, namely perception, atten-
tion, memory and action and is activated through sensory triggers.
Under or over performance of these four functions change human
responses into human errors.
In the literature, many researchers have proposed different
(case specific) classification models for human error, but the pio-
neer works of Rasmussen (1983) and Reason (1984, 1990) are more
generic in nature. Common human errors are of five types, i.e., slip,
lapses, rule base mistake (RBM), knowledge based mistake (KBM),
violation and are adapted in this study for further analysis. A sum-
mary of these five types of errors is presented in Table 1.
2.1. Consequences of human error
To identify the risk, associated with human error, it is essential
to assess its consequences. Sometimes a little mistake can play a
major role in the occurrence of a catastrophe. Therefore, due atten-
tion is required for all sorts of error even for a common slip/lapses.
Most common errors could have serious consequences for people,
industry and environment. But most of the time employees suffer
(physically, financially and emotionally) more than the employers.
Many researchers Mottiar (2004), HMSO (1993), Mossink and
Greef (2002) have discussed the impact of accident. As human
errors are one of the major causal factors of accident/incident,
these can be indirectly accounted as the impact of human errors
also. Following section describes the extent and degree of impact
of accident/incident on employee, employer and on environment.
2.1.1. Employee costs
In the aftermath of an accident, the victim, i.e., the employees of
an industry is affected both financially and emotionally. The finan-
cial and psychological impacts on employees are as follows:
I. Financial losses: The amount of financial losses for employees
varied greatly on the mode of payment. The largest amount
of loss is due to a reduction in salary. The other modes of
payment are medical and travel expenses due to injury, loss
of savings because of injury. Sometimes, the new salary
package of the injured employee may be reduced because
of permanent disability, loss of limbs, etc.
II. Psycho-socially effects: The pains and suffering of an
employee from an accident are hard to measure objectively.
Any accident can affect the human being socially and emo-
tionally both, e.g., family members and close friends are
depressed and disturbed, and many other social issues may
be created which affect the victim negatively. It is not possi-
ble to count all.
2.1.2. Employer costs
Although an accident costs highly to the employees, it has sub-
stantial impact on the employer too. Firstly, organization incurs
huge amount of financial loss due to disturbance in production
schedule. Other issues, e.g., employee compensation, medical reim-
bursement, salary for an absence period of employees, repairing
and replacement of tools, public relation and corporate images
are also affected negatively by the accident.
P. Kumar et al. / Safety Science 85 (2016) 88–98 89
3. Incidence/accidents
records
Selection of the
sample space
representing the
population
Development of risk and
safety management policy
of an industrial system
DATA BASE BUILDING
Collection of reported
incidence data &
information
Classification of
data
Data analysis &
error identification
Formation of risk-criticality
diagram
Frame risk-criticality zone-wise
risk & safety management policy
Field Expert
opinion
REPRESENTED POPULATION SPACE
SAMPLE DATA BASE BUILDING
Formation of lost
man-days (LMD)
sample data set
Formation of
criticality index of
error (CE) sample
data set
Formation of rate
of error (RHE)
sample data set
CATEGORIZATION OF DATA
INTO THREE RISK LEVELS
Clusters
formation-----
K-means
Cluster
boundary
demarktion-----
SVM
Selected risk and safety
management policy for the
system XYZ
Plot RHE, LMD values on
the risk ceiticality diagram
Assessment of RHE, LMD
for the system XYZ
Opinion of field
expert of
system XYZ
Records and
information of
past incidances
Selection of risk and safety
management policy for system XYZ
Fig. 1. Diagrammatic representation of the proposed model.
Table 1
Summary of error categorization.
Type of error Stages of error
occurrence
Nature of
activity
Principle cause Mode of response Error category
Slip Execution of action
response
Routine Attention capture Omission Omission error
Lapses Execution of action
response
Memory failure Memory gap/omission error
Mistake Rule based Decision planning Not routine
type
Misperception &
Misinterpretation
Commission/
Substitution
Application error/decision error
Knowledge-
based
Detection/diagnosis Inadequate Knowledge Learning gap errors or
Inconsistency error
Violation Execution of action
response
Any type Willful disregard to rules &
regulations
Decision error
90 P. Kumar et al. / Safety Science 85 (2016) 88–98
4. 2.1.3. Environmental effect
Nowadays environmental conditions are directly linked to the
human activities in different industries. Human error increases
the chance to develop a non-eco-friendly environment. A number
of incidents can be found from the past history, which have
affected our environment badly. Retroactive investigations of
many accidents have revealed that the prime cause was human
error that was present in the system long before the accident
sequence started. The impact of these incidents lasts for long in
environment by producing poisonous gases, radiation, etc., e.g.,
Bhopal gas tragedy, India (December 3, 1984), NASA Space Shuttle
Orbiter Challenger, USA (January 28, 1986), Deepwater Horizon oil
spill, Mexico (April 20, 2010), Fukushima Nuclear Disaster, Japan
(March 11, 2011), etc.
2.2. Risk assessment of human error
Despite the improvement in industrial safety over the last few
decades, risk assessment is a challenging issue and yet many peo-
ple lose their lives through human error related accidents across
the world. Knowledge of human error risk-criticality is essential
for managing risk in industry. Existing level of risk of human error
in various activities may be assessed following a reliable risk
assessment process. The adopted method must identify the target
area and the type of intervention needed. This acts as a guiding tool
in decision making for effective management of human error risk
in industry.
According to Sheridan (2008), the magnitude risk of human
error is expressed by
R ¼ PE Ã
X
i
ðPijE Ã CiÞ ð1Þ
Here PE is the probability of occurrence of error, (Pi|E) is the condi-
tional probability if an error has not recovered before the occur-
rence of any accident and Ci’s are all existing consequences of the
accident.
The main hurdles in the human error risk assessment from ret-
rospective analysis of accidents/incidences are the estimation of
(Pi|E), as the reported accidents/incidents provide information on
unrecovered human errors. It is hard to get a plausible estimate
of recovered human errors through retrospective analysis of acci-
dents/incidences. Another problem in the estimation of Ci is the
absence of detailed records. Due to these restrictions, the risk crit-
icality of human error has been calculated in this study as a func-
tion of ‘error rate’ and ‘lost man days’. Symbolically,
Criticality Index of Error; CE ¼ Avg: rate of error ðRHEÞ
 Avg: Man days lost per error ðLMDÞ
ð2Þ
Since less severe accident may be more probable and vice versa,
therefore taking the product of two variables will reflect the com-
bined effect of severity and probability of incidents/accidents. CE
helps to identify the problem areas requiring interventions. For
further localization of challenging area, calculation of CE for various
types of system activities is preferred.
3. Estimation of human error criticality indices for different
error modes and system activities
Systems’ safety enhancement or human error risk circumven-
tion necessitates pinpointing the decisive areas for devising effi-
cient and effective human error risk management policy.
Activity-wise and error-based classification of reported incidents/
accidents helps to identify the target area(s) and to choose the
apt corrective measure for implementation. Following sections
illustrate the proposed methodology with reference to the under-
ground coal mining system.
Reported incident/accident data of a group of underground coal
mines in India were collected for retrospective analysis and gener-
ation of database. Selected group of mines includes three mines
that reported comparatively low, high and average rate of inci-
dent/accident during last ten years. As such, these mines represent
the safety standard in underground coal mines in India. Develop-
ment of reliable standard needs analysis of bulk data. Accident data
collected from the selected three mines were used to demonstrate
the developed methodology. Retrospective analysis of collected
reports on past incidents/accidents, has been done through classi-
fication of information into steps. Firstly, reported incidents/acci-
dents have been classified activity-wise (Drilling & Blasting,
Loading/Unloading, Transportation, Supporting, Maintenance and
Miscellaneous). Then possible type of human error(s) (slip, lapses,
RBM, KBM and violation) that/those led to the incident/accident
was/were identified. Therefore, every reported incident has been
tagged with one or more type of human error and to a system
activity. Man-days lost in all reported incidents/accidents have
been retrieved from ‘incident reporting log-book’. Thus, a data tri-
plet, i.e., ‘committed types of error leading to the incident/acci-
dent’, ‘lost man-days due to this incident/accident’ and ‘system
activity associated with the incident/accident’, for all the reported
incidents/accidents has been generated through the retrospective
analysis of accident reports. Statistical analysis of these data esti-
mates average man-days lost per error and average error rate per
year in an activity. The average man-days lost and respective fre-
quency of average human error per year have been used in further
analysis to determine risk related to human error in various mining
activities.
Data derived through retrospective analysis of incidence reports
of selected mines were analyzed to calculate average error rate per
year (RHE) and average man-days lost per error (LHD). Using Eq. (2)
the Criticality Index of Error (CE) has been calculated for the
selected three mines and presented in Table 2 for mine-I. Thus
we get 25 CE values for the mine-I, 25 CE values for the mine-II
and 16 CE values for the mine-III. Out of these total 66 CE values,
three values are considered as outliers. Rest 63 CE values with an
error rate (RHE), and lost man-days (LMD) are used to demonstrate
the development of the proposed model for standardization of
error and risk in underground coal mines in India.
4. Categorization and fixing standards for safety performance
data
Standardization of performance data provides benchmark val-
ues to enable monitoring of system performance. Setting a sound,
crystal clear and definite standard helps both the performer and
monitors to check the performance status and its progress with
time. Based on the domain of comparison, various types of bench-
marking are in vogue in industry (Boxwell, 1994; Bendell et al.,
1998) e.g., internal benchmarking compares performance between
different groups or teams within an organization when external
benchmarking compares performance with companies in a specific
industry or across industries. Categorization of performance data
into desired number of levels, fixes the benchmark values on the
basis of present practices in the industry. These values may change
with time. To categorize risk of human errors in various system
activities; RHE, LMD, CE values are divided into three groups, namely
low, medium and high using k-means clustering technique in SPSS.
k-means clustering is a good choice for grouping homogeneous
data set as it is robust, computationally fast, conceptually simple
and relatively efficient, especially for big data clustering and small
number of cluster. Here the proposed number of cluster is limited
P. Kumar et al. / Safety Science 85 (2016) 88–98 91
5. to 3 only and volumes of data grow explosively with the addition
of new data set from more number of mines and for larger dura-
tion. The method follows an iterative process which considers
the distance of each data point from the centroids of k-groups. A
point will go to the nearer centroid cluster and finally distributed
accordingly. A simplified algorithm of the k-means clustering is
presented in Fig. 2.
Following k-means clustering algorithm RHE, LMD and CE data are
divided into three clusters, namely low, medium and high. Note
that clustering only divides data into required number of groups,
but if it has to be used further as a benchmarking tool, demarcation
of cluster boundaries is important.
Support vector machine (SVM) can play an important role to
construct decision boundaries between these homogeneous data
point clusters. The pioneer study of SVM tool has been given by
Vapnik and his co-researchers in 1960s and then Boser et al.
(1992) have introduced it as a tool of Artificial Intelligence (AI)
for machine and statistical learning processes. A linear SVM
behaves like a classifier that constructs a model hyper plane such
that the given data classes are separated with equal margin.
4.1. A brief overview of support vector machine
This section introduces the basic theory of hyper plane con-
struction using SVM with linear kernel which divides two data
classes through hyper plane in multidimensional case and a line
in a two dimensional plane. From Fig. 3 it is obvious that more than
one boundary line may exist between the two classes. Linear SVM
classifier learns the best separating decision line between these
classes and the optimized values of the intercept and gradient give
the cluster boundary.
Let us consider the given training data {(x1, y1), (x2, y2),. . .,
(xn, yn)} 2 X Â {±1}. Here the domain X is any non-empty set and
yi are respective labels for class-I (+1) and class-II (À1) respec-
tively. The labels ‘+1’ or ‘À1’ are used for ease of mathematical
representation of data that belong to class-I (level +1) and those
belong to class-II (level À1) respectively. These data are scattered
according to unknown probability distribution in the Cartesian
plane. In SVM, with the help of a dummy boundary line between
two data clusters, one tries to find out the intercept and gradient
of the actual boundary line. SVM is known as widest street
Table 2
Average values of human error rate per year (RHE), Lost man-days per error (LMD) and Criticality Index of Error (CE) for various types of errors in different mining activities at Mine-
I.
Error types Activity
Drilling blasting Loading/unloading Transportation Supporting Maintenance Miscellaneous
RHE LMD CE RHE LMD CE RHE LMD CE RHE LMD CE RHE LMD CE RHE LMD CE
Slip 1.14 31.5 35.91 2.65 14 37.10 2.15 13.44 28.90 5.88 22.16 130.30 0.59 10.4 6.14 4.47 26.16 116.94
Lapse Nil Nil Nil 0.47 37 17.39 Nil Nil Nil 0.12 6 0.72 0.11 32 3.52 0.47 18.25 8.58
KBM 0.35 4.67 1.63 0.23 7.5 1.73 0.11 34 3.74 0.35 16.33 5.72 0.47 8.25 3.88 0.59 8 4.72
RBM 0.59 7.2 4.25 3.29 16.92 55.67 0.71 8.5 6.04 2 16.53 33.06 1.12 52 58.24 2.24 19.74 44.22
Violation 0.12 34 4.08 0.11 3 0.33 Nil Nil Nil 0.35 70 24.50 Nil Nil Nil Nil Nil Nil
Is there any
alteration/change
in cluster points
End
Input No of clusters and
initial coordinates of K
centroids
Recalculate the centroid of
each clusters
Find the distances of each
data points from K
centroids
Form K clusters of data
points w,r.t the distance
from centroids
Start
Finalize data set of K
clusters
Yes
No
Prepared input database
Fig. 2. Algorithm for k-mean clustering.
92 P. Kumar et al. / Safety Science 85 (2016) 88–98
6. approach; because it generates the decision boundary in such a
way that separation of both types of data from it, the street, should
be as wide as possible. Data points lie closest on both sides of the
decision boundary line play the major role to maximize the margin
of data points from the boundary and are called support vectors to
decide the position of the decision boundary line.
Let A be any vector normal to the hypothetical decision line
from the origin and x is an unknown vector. The projection A Á x
of x to the normal vector A will be parallel to the decision line.
Therefore the equation for decision line could be Ax + b = 0, here
b is a real number. Say, Ax þ b P 1 and Ax þ b 6 À1 are the equa-
tions of boundary for class-I and class-II respectively.
Multiplying both the boundary equations with yi
yiðAx þ bÞ P yi P 1 8i ð3Þ
Therefore, the width of street is,
ðxþ À xÀÞ
A
!
kAk
8i ð4Þ
Here x+ and xÀ are closest data points of both sides and A
!
is the nor-
mal vector to the decision line; therefore, A
!
kAk
is the unit vector along
this normal vector.
From Eqs. (3) and (4), the width of street is 2
kAk
.
To maximize the width of the street and taking mathematical
convenience, we get the constraint optimization problem:
Minimize
1
2
kAk2
Subject to yiðAx þ bÞ P 1 8i
The Lagrangian function to this problem is
LðA; b; aÞ ¼
1
2
AT
A þ
Xn
i
ai½1 À yiðAx þ bÞŠ ð5Þ
Subject to
yiðAx þ bÞ P 1 8i ð6Þ
Eqs. (5) and (6) are mathematical problem considered under Quad-
ratic Programming Problem (QPP) which can be solved using K–T
condition concept and thus the decision boundary parameters ‘A’
and ‘b’ are obtained.
4.2. MATLAB syntax for SVM
Cluster boundaries were obtained using the SVM toolbox of
MATLAB software. To draw a separation boundary line between
two groups of data points, one labels data points of cluster-I as
Lower (L or À1) and cluster-II as Upper (U or +1). Data are then
arranged on excel spreadsheet format into three columns in which
second and third columns contain coordinates of both the clusters
and first column contains attribute value e.g., ‘L’ or ‘U’. A stepwise
SVM tool syntax in MATLAB is given below:
Step 1. Maintain groups (+1 (U) and À1 (L)) for training data.
Step 2. Import prepared training data from Excel sheet to
MATLAB Editor prompt using syntax data = xlsread
(‘filename.xlsx’, sheet no.).
Step 3. Provide specific address with respect to Excel sheet rows
and columns A = data(1:end, 1:2).
Step 4. Provide address for respective attributes of above train-
ing data B = textdata(1:end, 1).
Step 5. Train SVM classifier by using a linear kernel and plot
grouped data svmStruct = svmtrain(A, B, ‘showplot’,
true).
The above syntax will draw linear boundary between cluster-I and
cluster-II. Similar syntax is used to draw boundary between other
clusters. Following the above steps, linear separation boundaries
were demarcated between the clusters of error criticality, human
error rate and lost man-days.
Separation boundaries for error criticality data points are
y = .09x + 14.4 for low and medium risky zone and y = À.19x
+ 47.3 for medium and high risky zone. Human error rate data have
y = À.001x + .87 and y = .002x + 2.37 separation boundaries
between low–medium and medium–high groups of error rates
respectively, while for lost man-days separation boundaries are
y = 25.94 for low–medium groups and y = 44.50 for medium–high
groups. All of these separation boundaries intersect the vertical
axis into two points within the domain of collected data as shown
in Table 3. To have conservative estimates for initiating interven-
tions over safety issues, we recommend the lower values for cate-
Ax+B=
-1
Ax+B=
1
Support
vectors
Data class-I (+1)
Data class-II (-1)
Margin=2/IIAII
Decision boundary (Ax+B= 0)
x
A
(x+-x-)
A/IIAII
x-
x+
Fig. 3. Existence of decision boundary between two data types.
P. Kumar et al. / Safety Science 85 (2016) 88–98 93
7. gorization of levels of error criticality, human error rate, and lost
man-days, as given in Table 3.
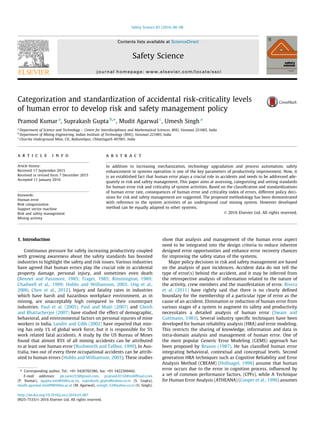
5. Human error based risk management model development
Safety and risk management plan aims to reduce human error
rate by allowing improvement in response and mitigating the
impact of error. Estimating criticality level of human error risk in
different system activities helps in resource allocation for manag-
ing risk. Risk of human error in a system can be expressed in terms
of rate of the human error and lost man-days. A standard risk-crit-
icality diagram of human errors is useful to study, analyze and
review the criticality level and present status of risk in operation of
a system. With the result of the preceding analysis, one can pre-
pare a risk-criticality diagram of human error risk in underground
coal mining activities in India. Here, human error rate has been
plotted along x-axis and categorized into three levels, i.e., error rate
less than 0.81/year (low), between 0.81–2.37 (medium) and
greater than 2.37/year (high). Similarly lost man-days have been
plotted along y-axis and categorized into three levels, i.e., lost
man-days less than 25.94 per error (low), between 25.94–44.50
per error (medium) and greater than 44.50 per error (high). This
risk matrix divides the error rate vs. lost man-days plane (risk
plane) into 9-cells. Each cell carries a set of information much help-
ful in risk management in system activities based on its co-
ordinates, i.e., RHE and LMD values and cell number. However, this
information is partial and based on the effect of individual param-
eter and therefore, devised interventions for safety and risk man-
agement are implicitly effective. Superimposition of criticality
levels on the same plane further divides the cells that provide
much needed and more specific information leading to the devel-
opment of explicit and effective intervention for safety and risk
critical system activities. Since the criticality of an error in an activ-
ity is the product of error rate and lost man-days, independent
information on error rate and loss man days incompletely apprises
about the criticality of any incident. A less probable (low error rate)
incident may be more severe (due to high lost man-days) and vice
versa. But zonalization of risk plane based on error criticality val-
ues (CE) shows more complete information of the risk and safety
level. Different zones in the risk-criticality diagram as shown in
Fig. 4, illustrate the joint effect of error rate and lost man-days.
Based on the result of the SVM and levels of criticality values as
given in Table 3, the boundaries between low and medium critical-
ity zones and medium and high criticality zones have been drawn
taking x à y ¼ 14:4 and x à y ¼ 35:2 respectively. This results a set
of 18 risk-critical zones, namely RC111, RC112, RC113, RC121,
RC131, RC211, RC212, RC213, RC221, RC222, RC231, RC313,
RC322, RC312, RC331, RC323, RC332 and RC333, each carries a
set of information much helpful to guide the future course of action
for risk and safety management.
6. Development of risk and safety management policy for
human error
Human error based risk and safety management address the
reduction strategies for error rate and impact of error.
6.1. Method for reduction of error rate
Reduction policies aim to reduce and/or prevent committing
human errors as well as recovery of error before it ends up in an
incidence in a particular context. These policies may be grouped
into exclusion, prevention and error recovery.
6.1.1. Exclusion strategies
Exclusion strategies eliminate the chances of human error and
make the event ‘error proof’. This is normally recommended for
the potential human error that may lead to catastrophic conse-
quences. The technical system might be a fallback system interven-
ing only if the operator makes a mistake, e.g., an automatic braking
system to prevent over-speeding. The human operator can act as a
fallback system for a technical system too, e.g., driving on sight
because of a failure of a track clear detection device. Automatic
contrivance as a safety device in a mine winding system prevents
over-speeding and over-winding and ensures slow banking. Inter-
locking of motors of main auxiliary fan and overlapping fan is nec-
essary to exclude the chance of accidental switch on of overlap fan
when the main auxiliary fan is switched off.
6.1.2. Prevention strategies
These strategies are the next tier down from exclusion one. This
may be adopted when the occurrence and impact of the human
error is not so high. In other words, the risk of human error is
not critical and it is unjustified to make the event human ‘error
proof’ from the investment point. A more economical approach
to reduce the occurrence of error is to make it difficult to commit
that identified error.
6.1.3. Error detection and recovery
Unsafe behavior of human being is one of the most pressing
threats to the safety for technical systems. Error detection aims
at making errors apparent as fast and as clearly as possible and
Table 3
Demarcation of boundary values for categorization of human error rate per year (RHE), lost man-days per error (LMD) and Criticality Index of Error (CE).
Variables Vertical intercepts of the decision boundaries
between
Range values for different levels
Low & medium Medium & high Low Medium High
Lost man-days [25.94, 25.94] [44.50, 44.50] 625.94 25.94–44.50 P44.50
Human error rate [0.87, 0.81] [2.37, 2.502] 60.81 0.81–2.37 P2.37
Criticality [14.4, 20.1], [35.2, 47.3] 614.4 14.4–35.2 P35.2
0
10
20
30
40
50
60
70
0 0.5 1 1.5 2 2.5 3
Lostman-dayspererror
mine-I
mine-II
mine-III
Error rate per year
RC313
Line y=25.94
RC111
Line y=44.50
Linex=2.37
Linex=.81
RC332 RC333
RC212
RC221
RC121
RC231
RC323
RC112
RC131 RC113
RC312
RC 222
RC331
RC213
RC322
RC211
Fig. 4. Risk-criticality diagram of human error risk model.
94 P. Kumar et al. / Safety Science 85 (2016) 88–98
8. therefore enabling recovery. An error can be detected by the per-
son that committed the error (self-monitoring), or cued by the
environment, or detected by another person. Error recovery aims
at making it easy to rapidly recover the system to its safe state after
an error has been committed. Examples include the introduction of
error reduction techniques such as rechecking critical activities by
a competent second person such as supervisor. Error detection and
correction is not an easy task, especially in case of human being.
Individual’s mental model to solve a problem even in wrong
respect (Lewis and Norman, 1986) has played a major role behind
the occurrence of errors. According to Reason (1990), Kontogiannis
and Malakis (2009) errors are not detected sometimes because
people are willing to accept only a rough agreement between the
actual state of the world and their current theory about it.
Specific context and concept are another issue for occurrence of
errors. Reported studies show the association between a specific
type of error and contributing factors and there have many sugges-
tions for managing these. Following section details the suggested
approaches for managing various types of errors.
Slips: A workplace environment in which equipments are not
working properly or harsh physical conditions, e.g., darkness, glare
and noisy environment can play as boosting factors for slips. To
reduce slip error some suggestions are listed below:
Slip errors occur through the absence of necessary attention
checks that are needed at fixed intervals to ensure that things
are running as intended. Removal or harnessing the sources of
attention distraction are effective means to reduce the rate of
slips.
Post-attention check is active in case when error cue signal gen-
erates to detect it. In some cases the generated signal cannot be
captured immediately. In this case one should apply more effec-
tive way to mitigating it.
Slip errors can be detected by monitoring the feedback from
each response and checking it against some correct response.
Sometimes our body automatically generates responses in
reflex that may not produce desired output. A conscious mind
produces corrective reflexes through awareness of what is being
done and what is currently intended.
It is also needed to design for guide emergency action at various
steps e.g., when errors lead to a blocking of further progress.
These are called error forcing conditions, ‘‘Something that pre-
vents the behaviour from continuing until the problem has been
corrected” (Lewis and Norman, 1986). A forcing function is most
valuable to prevent slip when it does not come too late.
Lapses type: Short term memory lapses are the cause of omis-
sion of an intended action due to memory failure. Familiar situa-
tion or overconfidence are the main factors for lapses type errors.
Following recommendations are suggested for designing typical
control measures.
Comparison of input and desired output, and implementation of
immediate feedback rule for any application are the useful tech-
niques for recovery of lapses.
Creation of some key paths so that one can capture a wrong
movement immediately after its execution.
High variable tasks have more chances of occurrence of lapses
errors as compared to automatic pattern tasks.
Fatigued and pressured personnel are expected to do more
lapses error (Moore-Ede, 1993).
Effective supervision plays an important role to detect lapses
errors.
RBM: Rule-based error is failure to correctly implement the
familiar procedures. Inadequate coordination between workers or
the personal repertoire is the actual cause behind the occurrence
of rule based error. Lack of well documented and poorly designed
procedures may be the cause for this error. Typical control mea-
sures are listed below:
Self-monitoring of performance is the most effective technique
for the reduction of RBM.
Adoption of effective training scheme is an important means to
cope up with these errors.
To avoid opting wrong process some error forcing conditions
can also be implemented.
Implementing process should be properly designed according to
the scenario.
Development of standard operating procedures (SOPs) for all
activities and strict adherence to SOPs are effective steps.
KBM: Knowledge-based error occurs in a situation which is
unfamiliar or a new problem for which no rules or routine exists.
Knowledge based mistake is much harder to detect as compared
to skill based error. Following steps may be beneficial to control
KBM.
It is needed to develop the capability of decision making and
diagnosis of a situation within the workers for detecting knowl-
edge based mistake at work.
A clear goal with efficient strategy is essential to manage KBM,
which needs a good homework.
Concentrated effort on research and development will
strengthen the repertoire of knowledge and troubleshooting
capabilities.
Violation: Violations are an intentional deviation from proce-
dures or good practice (Shappell and Wiegmann, 2000). There
may be various causes e.g., fatigue (mentally and physically), night
shift work, production pressure, adoption of shortcut, etc. Typical
control measures are as follows:
Delegating the power of decision making only to the personnel
as per the need of task procedures.
Maintaining comfortable physical environment e.g., control of
darkness, glare, and excessive noise, etc.
Control fatigue due to year-end production pressure and night
shift work by eliminating unrealistic work load.
Manage availability of well designed equipment and tools
deficiencies.
Clarifying the issues of personnel sometimes may be personal.
These are the strategies for reduction of human error rate, but
this alone is not effective enough to manage criticality values
within desired levels and need to be coupled with the controlled
impact of error.
6.2. Method for minimization of the effect of human error
The impact of human error is reduced by incorporating features
such as protecting barriers that prevent or weaken the power of
unexpected consequences (Hollnagel, 2009) resulted from flow of
energy or mass. Techniques to minimize the impact of failures by
the introduction of safety barriers are commonly termed as ‘fail-
safe strategy’.
6.2.1. Fail-safe strategies
These strategies are intended to make the event fault tolerant.
They prevent potential hazards from occurring in the event of
human error. These are invoked to mitigate the consequences of
human error by introducing safety barriers instead of trying to
P. Kumar et al. / Safety Science 85 (2016) 88–98 95
9. prevent or eliminate human error occurrence. Based on the sever-
ity (depends primarily on the type and amount of hazardous
energy release) of consequences, multi-layers barriers, i.e.,
defense-in-depth principle are to be adopted. The protecting barri-
ers buffer the system elements, likely influenced by the incidences
caused by human errors in various system activities and minimize
the consequences. Active barriers deter the consequences and pas-
sive barriers absorb them. They take the form of interface design,
standard operating procedures (SOPs) and organizational rules,
personal protective equipment, etc. For example, fan drifts are
equipped with explosion doors which blow open to the atmo-
sphere in the event of high explosion pressure and protect the sur-
face fans from any damage. The catch plate fitted in the headgear
held the cage in the event of over wind and prevents from any
catastrophic consequences.
6.3. Development of a framework for risk and safety management
policy decisions
Monitoring the rate of incident/accident and the loss statistics
reflects the safety status of an organization as well as the level of
risk in its operation. Retroactive analysis of the incidences helps
to identify activities and personnel requires attention following
the risk management policy as detailed in Table 4. In Fig. 4 risk-
criticality plane has been divided into 18 zones. Location of a point
with respect to these zones helps to frame risk and safety manage-
ment policy decisions. Zones RC131, RC121, RC111, RC112, and
RC113 have a low criticality level due to very low error rate or con-
sequences or both. Six zones, namely RC211, RC231, RC221, RC222,
RC212 and RC213 fall into the category of medium criticality level.
Rest 7-zones i.e., RC331, RC332, RC322, RC312, RC313, RC323 and
RC333 either have a high criticality level when the error rate is
very high or have considerable consequences or both.
7. Result and discussion
Human error plays a lead role in an incident/accident. The
methodology discussed above acts as guiding tool to safety
enhancement through human error management. It is a two-step
approach. Firstly, target system tasks are identified through
activity-wise classification of data and then error-wise classifica-
tion guide in the design of effective interventions. The proposed
model assesses the gravity of an error simply through the product
of error rate and lost man-days. This is a specific approach of risk
assessment through retrospective analysis of incidents and can
find easy implemented in industry once its risk criticality diagram
is standardized. The findings of the analysis of collected data are
presented below.
Risk-criticality diagram presented in Fig. 4 and the result are
based on the example data set. Therefore, result and discussion
presented here are merely of the case study and not necessarily
generalized. The size and shape of the criticality zones will change
with varying sets of data. This risk-criticality diagram helps to
identify the risk-critical system activity that will be targeted for
intervention design. The points lie under the first parabolic curve
in the risk-criticality diagram (Fig. 4) are considered within safe
zone. Therefore associated mining activities in the related mines
have minimal safety issues and much attention is not needed from
Table 4
Recommended risk and safety management policy based on present status.
Zone Characteristic Risk and safety management policy
RC111 Error rates as well as consequences are low Follow present policy of risk and safety management
RC112 Medium level consequences are compensated by very low
error rate
No appreciable change in ongoing risk and safety management policy
RC121 Although consequences are of medium level, the error rate is
very low
Stick to the present risk and safety management policy
RC113 Have high error rate with negligible consequences Keep an eye on the error rate, otherwise follow present policy of risk and safety management
RC131 Have negligible error rate with high consequences Observe the situation and in case of no appreciable changes in error rate, stick to the
followed risk and safety management policy
RC211 Error rate and consequences both are marginally at lower level
and jointly produce medium level criticality
Keep a watch on the system activities and continue with the ongoing risk and safety
management policy
RC212 Although the consequences are of low level, it has significant
error rates
Be cautious and if possible adopt methods for reduction of error rate
RC221 Error rate is low but has significant consequences Be cautious and if possible shift to fail-safe strategies for risk and safety management
RC222 Error rate and consequences both are marginally at medium
level and they jointly produce medium level criticality
Although immediate change is not required be alert and keep plans ready for required
changes in the risk and safety management policy in near future
RC231 Low error rate with high consequences results medium level
criticality
Ready to follow some fail-safe strategies before things go beyond control
RC213 Although error rate is high low consequence helps to be in
control
Situations are inclined for a change in risk and safety management policy adopting strategies
such as exclusion or prevention or recovery of error or a combination of these whichever is
deemed suitable
RC331 High criticality is induced by huge consequences when the rate
of error is low
Risk and safety management policy needs a change and incorporates fail-safe strategies to
minimize the consequences
RC322 The effect of medium error rate is fortified with the visible
consequences
Adopt one or more error rate reduction techniques such as exclusion strategies, prevention
strategies or error recovery strategies and manage consequences using some protecting
barriers. Improvement in safety status is expected with this changed policy
RC312 The combined effect of medium error rate and marginally low
consequences results high criticality
As error rate is the main determinant of high criticality, changed risk and safety management
policy should be error rate reduction oriented
RC313 High criticality may be induced by high error rate when
consequences are low
Changed risk and safety management policy must be centered to adopt error rate reduction
strategies such as exclusion or prevention or recovery of error or a combination of these
whichever is deemed to be applicable
RC332 High criticality level reflects dominance of massive
consequence in case of medium error rate
Changed policy should focus on fail-safe strategies followed by exclusion strategies,
prevention strategies or recovery of error strategies
RC323 Unusually high error rate results high criticality Immediate change in policy is essential. Inclusion of exclusion strategies, prevention
strategies and recovery of error strategies is recommended. Due importance should be given
to the fail-safe strategies also
RC333 Extremely high criticality level shared by too high error rate
with huge consequences
Risk and safety management policy must change on urgent basis and implement effective
strategies for reduction of error rate and consequences
96 P. Kumar et al. / Safety Science 85 (2016) 88–98
10. a safety aspect. Fig. 5 shows that 21%, 29% and 20% of the reported
incidences in mine-I, mine-II, and mine-III respectively are not risk
critical. This indicates mostly safe (70% of reported mining inci-
dences are of low risk category) mining practices in underground
coal mines in India. On the contrary, continuous monitoring (12%
of mining activities are within criticality zone-II), especially where
manual loading and tramming still continues, is needed for better
safety performance. Analysis shows that 11%, 5% and 3% activities
of mine-I, mine-II, and mine-III respectively are accident prone.
Further improvement of safety status is only possible through
immediate interference in less than 20% of loading, drilling, sup-
porting, maintenance activities that contribute slightly less than
one-fifth of the reported incidences/accidents.
The proposed model also helps to compare the safety status of
different mines. From Figs. 4 and 5 it is clear that mine-III is com-
paratively safer (only 3% of the incidences are of criticality grade-
high) than the other two. Mine-I is the most unsafe (11% incidences
have high criticality value) among these three. Further investiga-
tion reveals the presence of a number of error opportunities like
adverse geological condition, mostly manual mining operations,
and undue negligence to safety in mine-I is the cause of unsafe
mining practices. On the other hand, high degree of mechanization,
comparatively benign working environment and large production
target of mine-II and mine-III have drawn management attention
toward safety.
Table 5 presents an activity-wise and error mode-wise classifi-
cation of data. This information is the guiding tools for selecting
the nature of those interventions which can effectively manage
human errors in various system activities. It shows that slips are
present in all types of activities and are the predominant type of
error behind 14% of critical and 6% of medium risky incidences.
Abundant sources of ‘attentional precapture’, adverse workplace
environment and distraction of mind are the primary causes of
slips in mining activities. RBM in loading, maintenance and miscel-
laneous activity accounts 6% critical incidence. Poor visibility, hot
and humid environment, slippery floor, space restriction, and
unavailability of proper tools are the major hindrance to mainte-
nance in mines. Therefore an immediate change of the safety and
risk management policy is required for the management of these
errors and the new policy should focus on the prevention, detec-
tion and recovery of slips in mining activities. Lapses are uncom-
mon in mining activities. They are the principle cause of 3%
warning level incidences in loading when RBM accounts 2% in sup-
porting and miscellaneous activities. This implies some changes
are necessary to manage these errors. Violations of statutory rules
and regulations are not a matter of concern of safety and risk
aspect. They contribute only 2% of medium level critical incidences
in supporting jobs. This is a good sign of mass awareness of safety
rules. Similarly, mistakes (both knowledge-based and rule-based)
are not the major contributory errors in mining incidences except
Fig. 5. Safety status of different activities in mines I, II, III and the overall status.
Table 5
Error-wise criticality status in various activities.
Error types with level of criticality System activity (%)
Drilling Loading Trans. Supporting Maint. Misc.
Slip Lower risky 0 3 0 3 2 0
Medium risky 2 0 2 0 2 0
High risky 2 2 3 2 2 3
Lapse Lower risky 3 2 3 3 5 3
Medium risky 0 3 0 0 0 0
High risky 0 0 0 0 0 2
KBM Lower risky 3 2 5 3 5 3
Medium risky 0 0 0 0 0 0
High risky 0 0 0 0 0 0
RBM Lower risky 3 3 3 2 3 2
Medium risky 0 0 0 2 0 2
High risky 0 0 2 0 2 2
Violation Lower risky 2 3 2 0 3 0
Medium risky 0 0 0 2 0 0
High risky 0 0 0 0 0 0
P. Kumar et al. / Safety Science 85 (2016) 88–98 97
11. a few stray incidences. Low risk incidences occur by mistakes
mainly due to ignorance and lack of proper training facility.
8. Conclusion and limitation
Human error based risk analysis will assist in designing error
free work environments. Developed risk-criticality model helps
to identify the activity-specific error types that have a safety con-
cern. This is very important in risk and safety management to
choose the right intervention and implement it at the right place
and to the right people. Due to implementation of safety and risk
management policy guided prescribed strategies will improve the
safety status of the system. Developed model is generic in nature;
this removes the industry specific restriction and finds intra-
domain application. Categorization of risk and safety level and
development of standards helps to monitor the safety status of
the system. Developed methodology is an amalgamation of the
engineering and psychological knowledge essential to develop
much needed holistic HRA model. This system based approach to
safety and risk management in mines will be helpful in mitigating
the accidents occurring in the workplaces and simultaneously
improving the health and safety of underground mine workers.
The reliability of the proposed model depends much on the vol-
ume and accuracy of the data. Many times, it happens that
reported incidences do not present true picture and statistics. Fur-
thermore, sometimes a part of the population does not respond i.e.,
accident occur, but not reported or causes not reported. All of these
embed uncertainty in results. The reliability of the proposed
methodology is based on the collected data and in case if they do
not represent the safety scenario of the case study mine, the rec-
ommendations may not produce the desired result. Therefore, in
case of fresh and complete data, the given approach may prove
to be one of the most effective approaches.
Acknowledgments
The authors gratefully acknowledge the wholehearted support
from Professor B. L. Tripathi, Department of English, BHU for edit-
ing the manuscript. The authors also acknowledge the learned
reviewers for their valuable suggestions. The overwhelming sup-
port from the people of the case study mines is duly acknowledged.
References
Bendell, T., Boulter, L., Goodstadt, P., 1998. Benchmarking for Competitive
Advantage. Pitman Publishing, London, UK.
Bennet, J.D., Passmore, D.L., 1985. Probability of death, disability, and restricted
work activity in United States underground bituminous coal mines. JSR (1975–
1981) 15 (2), 69–76.
Boser, B.E., Guyon, I.M., Vapnik, V., 1992. Training algorithm for optimal margin
classifiers. In: Fifth Annual Workshop on Computational Learning Theory, pp.
144–152.
Boxwell Jr., Robert J., 1994. Benchmarking for Competitive Advantage. McGraw-Hill
Inc., New York, p. 225.
Chadwell, B., Leverenz, F.L., Rose, S.E., 1999. Contribution of human factors to
incidents in the petroleum refining industry. In: 33rd Annual Loss Prevention
Symposium. AICE, Houston, Texas, USA.
Chen, H., Qi, H., Long, R., Zhang, M., 2012. Research on 10-year tendency of China
coal mine accidents and the characteristics of human factors. Saf. Sci. 50, 745–
750.
Cooper, S.E., Ramey-Smith, A.M., Wreathall, J., Parry, G.W., Bley, D.C., Luckas, W.J.,
Taylor, J.H., Barriere, M.T., 1996. A Technique for Human Error Analysis
(ATHEANA). Brookhaven National Laboratory, Upton, NY NUREG/CR-6350.
Ghosh, A.K., Bhattacherjee, A., 2007. Predictors of occupational injuries among coal
miners: a causal analysis. Min. Technol. 116 (1), 16–24 (Trans. Inst. of Materials,
Minerals and Mining, UK and Australian Inst. of Mining and Metallurgy).
HMSO, 1993. The Cost of Accidents at Work. HMSO, London.
Hobbs, A., Williamson, A., 2003. Associations between errors and contributing
factors in aircraft maintenance. Hum. Factors 45 (2), 186–201 (Summer 2003).
Hollnagel, E., 1998. Cognitive Reliability and Error Analysis Methods (CREAM).
Elsevier Science Ltd., Amsterdam.
Hollnagel, E., 2009. Barriers and Accident Prevention. Ashgate Publishing Company,
Burlington, USA.
Khan, F., Amyotte, P., DiMattia, D., 2006. HEPI: a new tool for human error
probability calculation for offshore operation. Saf. Sci. 44, 313–334.
Khanzode, V.V., Maiti, J., Ray, P.K., Tewari, V.K., 2010. Injury severity assessment for
underground coalmine workers. Appl. Ergon. 41, 242–250.
Kontogiannis, T., Malakis, S., 2009. A proactive approach to human error detection
and identification in aviation and air traffic control. Saf. Sci. 47, 693–706.
Landre, J.D., Gibb, G., 2002. A mutual interest in finding out exactly why accidents
happen has led the mining and aviation industry to common ground. Flight Saf.
Aust., 34–37
Lewis, C., Norman, D.A., 1986. Designing for Error: User Centered System Design,
Hillsdale.
Mach, E., 1976. Knowledge and Error. Reidel Publishing Company, Dordrecht.
Maiti, J., 2010. Development of worksystem safety capability index (WSCI). Saf. Sci.
48, 1369–1379.
Maiti, J., Khanzode, V.V., Ray, P.K., 2009. Severity analysis of Indian coal mine
accidents – a retrospective study for 100 years. Saf. Sci. 47, 1033–1042.
Moore-Ede, M., 1993. The Twenty-four Hour Society. Addison-Wesley, Reading, MA.
Mossink, J., Greef, M.D., 2002. Inventory of Socioeconomic Costs of Work Accidents.
European Agency for Safety and Health at Work.
Mottiar, Z., 2004. Feasibility Study on Estimation of Costs of Workplace Accidents,
Work related Ill-Health and Non-Injury Incidents in Ireland.
Paul, P.S., Maiti, J., Dasgupta, S., Forjuoh, S.N., 2005. An epidemiological study of
injury in mines: implication for safety promotion. Int. J. Injury Control Saf.
Promot. 12, 157–165.
Paul, P.S., Maiti, J., 2007. The role of behavioural factors on work injuries in mines.
Saf. Sci. 45, 449–471.
Peters, G.A., Peters, B.J., 2006. Human Error: Causes and Control. Taylor Francis.
Rasmussen, J., 1983. Skills, rules and knowledge: signals, signs and symbols, and
other distinctions in human performance models. IEEE Trans. Syst. Man Cybern.
13, 257–266.
Reason, J.T., 1987. Generic error-modeling system (GEMS): a cognitive framework
for locating human error forms. In: Rasmussen, J., Duncan, K., Leplat, J. (Eds.),
New Technology and Human Error. John Wiley, London.
Reason, J.T., 1984. Lapses of attention. In: Parasuraman, R., Davies, R. (Eds.),
Varieties of Attention. Academic Press, New York.
Reason, J.T., 1990. Human Error. Cambridge University Press, Cambridge, England.
Rimmington, J., 1989. Annual Report of the Health and Safety Executive. HMSO,
London.
Rivera, S.S., Baziuk, P.A., NúñezMcLeod, J.E., 2011. Fuzzy uncertainty in human
reliability analysis. In: Proceedings of the World Congress on Engineering,
London, UK, p. 11.
Rushworth, A.M., Tallbot, C.F., 1999. Investigating the Causes of Transport and
Tramming Accidents on Coal Mines. Safety in Mine Research Advisory
Committee.
Sanders, M.S., McCormick, E.J., 1997. Human Factors in Engineering and Design,
seventh ed. McGraw-Hill, New York.
Shappell, S.A., Wiegmann, D.A., 2000. The Human Factors analysis and Classification
System-HFACS. Final Report: Department of Transportation, USA.
Sheridan, T., 2008. Risk, human error, and system resilience: fundamental ideas.
Hum. Factors: J. Hum. Factors Ergon. Soc. 50 (3), 418–426.
Swain, A.D., 1989. Comparative Evaluation of Methods for Human Reliability
Analysis (GRS-71). Gesellschaft fur Reaktorsichereheit, Garching, FRG.
Swain, A.D., Guttmann, H.E., 1983. Handbook of Human Reliability Analysis with
Emphasis on Nuclear Power Plant Applications, Washington, DC: USNRC,
NUREG/CR-1278.
Trager, T.A., 1985. Case Study Report on Loss of Safety System Function Events,
AEOD/C504. US Nuclear Regulatory Commission, Washington, DC.
Ung, S.T., Williams, V., Chen, H.S., Bonsall, S., Wang, J., 2006. Human error
assessment and management in port operations using fuzzy AHP. Mar.
Technol. Soc. J. 40 (1), 61–73.
98 P. Kumar et al. / Safety Science 85 (2016) 88–98