Analyzing Metrics Over Time and Compared to Peers
•
0 likes•214 views

The document outlines a process for analyzing key metrics over time and in comparison to others. It includes taking a snapshot of the current metric, analyzing its trend over time, benchmarking it against peer metrics, and consolidating the assessment by comparing trends and trajectories both over time and to other metrics. Graphs are provided to illustrate trends and trajectories.

Recommended
Recommended
More Related Content
More from Paul Askew
More from Paul Askew (12)
Recently uploaded
Recently uploaded (20)
Analyzing Metrics Over Time and Compared to Peers
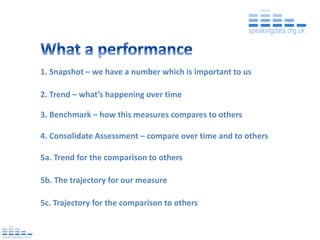
- 1. 1. Snapshot – we have a number which is important to us 2. Trend – what’s happening over time 3. Benchmark – how this measures compares to others 4. Consolidate Assessment – compare over time and to others 5a. Trend for the comparison to others 5b. The trajectory for our measure 5c. Trajectory for the comparison to others
- 2. 1. Snapshot – we have a number which is important to us Value 160 140 120 100 80 60 40 20 0 t-9 t-8 t-7 t-6 t-5 t-4 t-3 t=2 t-1 t=now t+1 t+2 t+3 t+4 Time
- 3. 2. Trend – what’s happening over time Value 160 140 120 100 80 60 40 20 0 t-9 t-8 t-7 t-6 t-5 t-4 t-3 t=2 t-1 t=now t+1 t+2 t+3 t+4 Time
- 4. 3. Benchmark – how this measures compares to others Value 160 140 120 100 80 60 40 20 0 t-9 t-8 t-7 t-6 t-5 t-4 t-3 t=2 t-1 t=now t+1 t+2 t+3 t+4 Time
- 5. 4. Consolidate Assessment – compare over time and to others
- 6. 5a. Trend for the comparison to others Value 160 140 120 100 80 60 40 20 0 t-9 t-8 t-7 t-6 t-5 t-4 t-3 t=2 t-1 t=now t+1 t+2 t+3 t+4 Time
- 7. 5b. The trajectory for our measure Value 160 140 120 100 80 60 40 20 0 t-9 t-8 t-7 t-6 t-5 t-4 t-3 t=2 t-1 t=now t+1 t+2 t+3 t+4 Time
- 8. 5c. Trajectory for the comparison to others Value 160 140 120 100 80 60 40 20 0 t-9 t-8 t-7 t-6 t-5 t-4 t-3 t=2 t-1 t=now t+1 t+2 t+3 t+4 Time