SlideShare a Scribd company logo
1 of 7
Download to read offline
ISSN 2349-7807
International Journal of Recent Research in Commerce Economics and Management (IJRRCEM)
Vol. 4, Issue 2, pp: (8-14), Month: April - June 2017, Available at: www.paperpublications.org
Page | 8
Paper Publications
Effect of Stock Market Listing on Financial
Performance of Companies Listed in Nairobi
Securities Exchange
Wilbert Kiplangat Kurgat
Daystar University, Kenya
Abstract: This study is on the effect of stock market listing on financial performance of companies listed in Nairobi
Securities Exchange (NSE). The specific objectives of the study determining how the nature of business industry and
size of companies affected their financial performance, how government policy effected through Capital Markets
Authority (CMA) influenced financial performance of companies listed in NSE, how management of the companies
listed in NSE affected their financial performance, and how availability of information influenced the financial
performance of companies listed in NSE. The Population of the study as well as the target population was a census of
all 61 listed companies at the Nairobi Securities Exchange (NSE) as at 31st
December 2012. This study established that
in general stock market listing affects different profitability ratios in different ways. Some improve as a result of stock
market listing while others deteriorate.
Keywords: Nairobi Securities Exchange (NSE), Listing, Return on Assets (ROA), Return on Equity (ROE).
1. INTRODUCTION
Trading in securities in Kenya started way back in the 1920s through call-over systems. The NSE started in 1954 as a
voluntary association of stock brokers and was registered under the Societies Act after getting clearance from London Stock
Exchange. After independence there were changes. Nineteen sixty-six (1966) was taken as the base year and 100 points were
used in the trading. But after 1991 it started using 20 share index and geometric mean.
There were many quoted companies by 1990s quoted companies representing different sectors namely the Agricultural,
commercial and services; finance & investment &; Industrial & Allied sectors in Alternative Investment Market. Trading on
the stock exchange has become a fashionable tool for raising capital. Investors have become increasingly aware of the
potential of the Nairobi Stock Exchange (Kihumba, 1993).
There is lack of public awareness at the NSE. However, CMA was constituted and segmentation of the NSE started in 2001
in order to encourage companies to trade in the NSE. There has been -0.83% growth in the NSE since its inception. In 2001
the government through CMA decided to introduce market segmentation at the NSE in order to enable as many companies as
possible to list at the NSE. The following are the segments:
i. Main Investment Market Segment (MIMS)
ii. Alternative Investment Market Segment (AIMS)
iii. Fixed Investment Securities Market Segment (FISMS)
Studies into this segmentation concludes that it has affected the prices of securities significantly (Chepng’ar, 2006; Ngugi,
2003)).
ISSN 2349-7807
International Journal of Recent Research in Commerce Economics and Management (IJRRCEM)
Vol. 4, Issue 2, pp: (8-14), Month: April - June 2017, Available at: www.paperpublications.org
Page | 9
Paper Publications
The stock exchange currently runs on an electronic trading platform known as the automated trading system and is open daily
for a six-hour trading period. The stock exchange’s main market index is the NSE 20 Share Index and also has an aggregate
index known as the NASI All Share Index. The exchange trades in ordinary equity, preference shares and treasury bonds and
has four companies cross-listed on regional stock markets. Within the last few years the Nairobi bourse has grown from a
market capitalization of Ksh112.59 billion ($1.42 B) in 2002 to Ksh853.88 billion ($12.38 B) in 2008 (it hit a peak of
Ksh1.28 trillion ($18.53 B) in June 2008 (NSE Handbook, 2006).
The stock market has increasingly become an avenue for bridging the requirements for both investors and borrowers. From
early nineties many firms have been raising new equity through stock market for the first time. The role of raising capital by
going public cannot be underplayed. A public offer if properly executed has the potential of raising large sums that would
otherwise not be possible through borrowing. Going public offers a relatively cheap source of capital for investment and
working capital requirements compared to the traditional intermediaries. It is, therefore, important to evaluate the effect that
listing of a company at the Nairobi Stock Exchange has on its financial performance.
Previous researches (Jumba, 2002; Maina, 2005) have concentrated on the underpricing of IPOs. These two studies looked at
changes in prices after IPOs and concluded that IPOs are followed by initial high returns hence are underpriced. A recent
study by Weche (2005) on the pre and post privatization on financial performance of companies listed through the NSE
covered only previously state owned enterprises. Not all quoted companies were state owned enterprises prior to their listing
since there are many quoted companies which were privately owned before going public. For instance between 1984 and
2000, there were sixteen IPOs of which thirteen were issues by private companies while three were issues by the government
as part of the privatization programmes. Weche’s results of profitability and decrease in the leverage levels apply only to the
previously state owned firms prior to their listing. Weche’s study was therefore limited.
Going public may affect the firms’ performance. Pagano, Panetta, and Zingales (1998) in their study found that profitability
declines after IPO then increases gradually after the first year. The study also established that companies deleverage
immediately after IPO. From such studies, it is apparent that most research studies in the area have been done in developed
markets with very little evidence for emerging markets, particularly Kenya. This study, therefore, tries to bridge this gap by
investigating the effect of listing companies at the NSE on their financial performance.
2. METHODOLOGY
This study is an exploratory study and it utilizes survey method. A survey is an attempt to collect data from members of a
population in order to determine the current status of that population with respect to one or more variables. Survey is
therefore a self-report study which requires the collection of quantifiable information from the sample (Mugenda and
Mugenda, 2003).
The data for the study was collected from websites of the Companies and the Capital Market Authority Library where all
financial reports of companies listed are stored so that the public can have access to them whenever they need them. The
target populations of the study are the 61 firms listed in Nairobi Securities Exchange as at close of 31st
December 2012
trading period. Purposive sampling was used by the researcher.
The data that was used in this study is secondary data that was collected based on the annual financial statements reports
released by the companies which have listed there shares at the Nairobi Securities Exchange as at 31st
December 2012. The
data was analyzed and reported quantitatively using descriptive and inferential statistics.
3. FINDINGS
3.1 Introduction:
These are the findings of the study on the survey of companies listed at the NSE between 1993 and 2012. The findings have
been summarized in tables to give the general background information of the companies studied and graphs to show the trend
of financial performance.
ISSN 2349-7807
International Journal of Recent Research in Commerce Economics and Management (IJRRCEM)
Vol. 4, Issue 2, pp: (8-14), Month: April - June 2017, Available at: www.paperpublications.org
Page | 10
Paper Publications
3.2 Return on Assets:
Table 1: Return on Assets
Year 1 % Year 2 % Year 3% Year 4 % Year 5 % Year 6 %
Cmc 2.00 1.70 1.50 3.90 4.80 5.40
Firestone 27.00 27.00 6.00 45.00 47.00 46.00
Mumias 0.271 1.31 7.66 0.684 -2.39 8.65
Kengen 4.80 2.20 2.30 2.40 4.50 1.90
Scan Group 7.14 10.22 14.51 13.94 8.37 10.20
Equity 2.50 2.00 3.00 3.60 5.00 4.20
Access Kenya Group 2.37 15.40 5.86 13.00 13.60 6.40
Eveready 32.70 38.10 32.90 19.70 3.30 4.20
Average 9.85 12.24 9.22 12.78 10.52 10.87
Table 2: Average Returns on Assets
Average Return on Asset
Before Listing % After Listing %
CMC Motor 1.70 4.70
Firestone 20.00 46.00
Mumias 3.08 2.10
Kengen 3.10 8.80
Scan Group 10.60 10.80
Equity Bank 2.50 4.30
Access Kenya 7.88 11.00
Eveready 3.46 9.07
Average ROA 10.44 11.39
ROA is an indicator of how profitable a company is relative to its total assets. ROA gives an idea as to how
efficient management is using its assets to generate earnings. CMC recorded a steady increase after listing over next three
years under study. Firestone recorded a sharp increase in the first year after listing then a relatively stable ratio in the next two
year under study. Mumias decreases in the first two years after listing having a negative ratio then increases in the last year of
study. Kengen and Equity recorded a stable ratio in the first year after listing then a slight increase in the second year
followed by a decrease in the third year. Scangroup recorded a stable ratio in the first year after listing then a decrease in the
second year followed by a slight increase in the third year under study. As a result its average remained relatively stable with
only an increase of 0.2% after listing. Access Kenya recorded a sharp increase in the first year after listing followed by a
steady increase in the second year and a relatively sharp decrease in the third year under study. Eveready decrease sharply in
the first two year after listing in the years under study then records a slight increase in the third year after listing in the years
under study. On average the companies studied exhibited a slight increase in the return on assets from 10.44% before listing
to 11.39% after listing.
ISSN 2349-7807
International Journal of Recent Research in Commerce Economics and Management (IJRRCEM)
Vol. 4, Issue 2, pp: (8-14), Month: April - June 2017, Available at: www.paperpublications.org
Page | 11
Paper Publications
3.3 Return on Equity:
Figure 1: Return on Equity Graph
Table 3: Average Return on Equity
Average Return On Equity
Before Listing % After Listing %
CMC Motor 3.80 15.43
Firestone 41.20 47.00
Mumias 5.90 3.84
Kengen 7.10 4.73
Scan Group 67.31 22.21
Equity Bank 17.43 17.07
Access Kenya 9.55 16.20
Eveready 68.13 13.53
Average ROE 29.65 17.50
-40.00%
-20.00%
0.00%
20.00%
40.00%
60.00%
80.00%
100.00%
year 1 year2 year 3 year 4 year 5 year 6
R
e
t
u
r
n
o
n
E
q
u
i
t
y
YEARS
Return on Equity graph
Cmc
Fireston
e
Mumias
Kengen
Scangro
up
Equity
Acesske
nya
Everead
y
Average
ISSN 2349-7807
International Journal of Recent Research in Commerce Economics and Management (IJRRCEM)
Vol. 4, Issue 2, pp: (8-14), Month: April - June 2017, Available at: www.paperpublications.org
Page | 12
Paper Publications
ROE is the amount of net income returned as a percentage of shareholders equity. Return on equity measures a corporation's
profitability by revealing how much profit a company generates with the money shareholders have invested. CMC recorded a
steady increase in the ROE after listing. Firestone, Kengen and Scan group exhibited a decrease immediately after listing
which continued for the next two years under study. Mumias performance decreased in the first two years after listing
exhibiting a negative ratio, in the second year it increased in the following year; however, the average returns on equity after
listing of 3.84% is lower than the average of 5.90% before listing. Equity’s ratio decreases immediately after listing then
increases in the following years under study. Access Kenya exhibits a seismological pattern where it decreases sharply after
listing then increases slightly followed by a decrease in the last year of study. Eveready decreases sharply after listing for the
following two years followed by a relative stability in the last year. In average, the companies under study recorded a
decrease after listing from 29.65% to 17.50%.
3.4 Net Profit Margin:
Figure 2: Net Profit Margin Graph
0.00%
10.00%
20.00%
30.00%
40.00%
50.00%
60.00%
year 1 year2 year 3 year 4 year 5 year 6
N
e
t
p
r
o
f
i
t
M
a
r
g
i
n
YEARS
Net Profit Margin
Cmc
Firestone
Mumias
Kengen
Scangroup
Equity
Acesskenya
Eveready
Average
ISSN 2349-7807
International Journal of Recent Research in Commerce Economics and Management (IJRRCEM)
Vol. 4, Issue 2, pp: (8-14), Month: April - June 2017, Available at: www.paperpublications.org
Page | 13
Paper Publications
Profit margin, net margin, net profit margin or net profit ratio all refer to a measure of profitability. It is calculated by finding
the net profit as a percentage of the revenue. The study showed that CMC’s net profit margin increased slightly immediately
after it was listed. The increase continued for the next three years under study. However for firestone, the net profit margin
decreased immediately after listing which continued for the next three years under study, Eveready follows the same pattern
except that the decline started before the listing. Mumias decreased immediately after listing for one year and then increased
in the following years under study. Kengen exhibited a seismological pattern after listing where it remains relatively stable
for one year after listing, then deteriorates from an increase to a decline in the following years. As a result the average net
profit margin of 22.23% decreases to 21.03% after the company was listed. Scan group recorded a decline immediately after
listing then rises slightly in the last year under study. As a result its average rises from 4.12% to 5.78% after listing. Equity’s
and Access Kenya net profit margin increased after listing then declined in the next two years under study. However the
average of all the companies studied increased from 9.98% before listing to 13.91% after listing.
3.5 Asset Turnover:
Figure 3: Asset turnover graph
Asset turnover is a financial ratio that measures the efficiency of a company's use of its assets in generating sales revenue or
sales income to the company. CMC and Mumias records a decrease in asset turnover immediately after listing then increases
steadily in the following two years under the period of study. Firestone increases in the first two years after listing then
0.00%
50.00%
100.00%
150.00%
200.00%
250.00%
300.00%
350.00%
year 1 year2 year 3 year 4 year 5 year 6
A
s
s
e
t
T
u
r
n
o
v
e
r
YEARS
Asset Turnover Graph
Cmc
Firestone
Mumias
Kengen
Scangroup
Equity
Acesskenya
Eveready
Average
ISSN 2349-7807
International Journal of Recent Research in Commerce Economics and Management (IJRRCEM)
Vol. 4, Issue 2, pp: (8-14), Month: April - June 2017, Available at: www.paperpublications.org
Page | 14
Paper Publications
drastically declines. Kengen and Equity exhibit a slight decrease one year after listing then increases slightly and remained
stable in the last year of study. Scan group portrays a seismological pattern where it increases immediately after listing then
decrease and in the last year under study remains stable. Scan Group performance decreased from 289.70% to 192% after
listing. Access Kenya drastically decreases immediately after listing then slightly increases followed by a slight decrease in
the last year of study. This causes its average to decrease to 93.30% after listing from 218.5% before listing. Eveready
decreases immediately after listing then increases in the next year followed by a decrease in the last year of study. This causes
the average after listing to decrease from 263.30% before listing to 185.70%. On average, the companies studied exhibited a
consistent decrease in the asset turnover which resulted to decrease from 145.92% before listing to 104.90% after listing.
4. CONCLUSION
This study implemented four profitability ratios; ROE, ROA, asset turnover and net profit margin. The results show that the
average ROA increased from 10.44% before listing to 11.39% after listing. This implies that the assets’ ability to generate
profit increases as a result of stock market listing. This is an indicator of an increase in financial performance. The second
measure was ROE. The average ROE of the companies under study decreased from 29.65% before listing to 17.5% after
listing. This shows deterioration in the profits earned by company using the shareholders investments. The third measure is
net profit margin. On average the studied companies recorded an increase from 9.98% before listing to 13.91% after listing.
This shows an improvement in the companies’ ability to control cost as a result of stock market listing. The last measure is
asset turnover. On average the studied companies decreased from 145.92% before listing to 104.9% after listing. This shows
that the companies’ asset ability to generate revenue decreases as a result of stock market listing.
REFERENCES
[1] Chepng’ar, R. K. (2006). A survey of the factors that account for the dismal listing at the Nairobi Stock Exchange.
MBA Thesis, University of Nairobi.
[2] Jumba, N. (2002). Initial public offer performance in Kenya. Unpublished MBA Project, University of Nairobi.
[3] Kihumba, J. (1993). Investor newsletter. Investment Promotion Centre Publication.
[4] Mugenda, A. G. and Mugenda, O. M. (2003). Research methods: quantitative and qualitative approaches. Nairobi:
ACTS Press.
[5] Nairobi Securities Exchange (NSE). (2006). Handbook.
[6] Ngugi, R. W. (2003). Development of NSE: a historical perspective. KIPPRA Discussion Paper no. 27.
[7] Pagano, M.; Panetta, F. and Zingale, L. (1998). Why do companies go public? An Empirical analysis. Journal of
Finance vol.53
[8] Weche, O. (2005). Pre and post financial performance of firm privatized through NSE. Unpublished MBA Project,
University of Nairobi.

More Related Content

What's hot

Macroeconomic determinants of stock market development in emerging markets
Macroeconomic determinants of stock market development in emerging marketsMacroeconomic determinants of stock market development in emerging markets
Macroeconomic determinants of stock market development in emerging marketsAlexander Decker
 
F423944
F423944F423944
F423944aijbm
 
FDI in Examination of China and India
FDI in Examination of China and IndiaFDI in Examination of China and India
FDI in Examination of China and IndiaRoni Bhowmik
 
Effect of Voluntary Disclosure on Corporate Performance of Quoted Manufacturi...
Effect of Voluntary Disclosure on Corporate Performance of Quoted Manufacturi...Effect of Voluntary Disclosure on Corporate Performance of Quoted Manufacturi...
Effect of Voluntary Disclosure on Corporate Performance of Quoted Manufacturi...ijtsrd
 
Mandatory and Voluntary Disclosure of Annual Report on Investor Reaction
Mandatory and Voluntary Disclosure of Annual Report on Investor ReactionMandatory and Voluntary Disclosure of Annual Report on Investor Reaction
Mandatory and Voluntary Disclosure of Annual Report on Investor ReactionHendra Gunawan
 
Trends in Commercial Policies in an Emerging Economy - CHINA
Trends in Commercial Policies in an Emerging Economy - CHINATrends in Commercial Policies in an Emerging Economy - CHINA
Trends in Commercial Policies in an Emerging Economy - CHINARutuja Chudnaik
 
E392430
E392430E392430
E392430aijbm
 
Doing business in_korea_eng_2015
Doing business in_korea_eng_2015Doing business in_korea_eng_2015
Doing business in_korea_eng_2015Frédéric Claveau
 
India Thailand Trade relation by Dr. Aasim Hussain
India Thailand Trade relation by Dr. Aasim Hussain India Thailand Trade relation by Dr. Aasim Hussain
India Thailand Trade relation by Dr. Aasim Hussain bhopal39
 
C472428.pdf
C472428.pdfC472428.pdf
C472428.pdfaijbm
 
Banking sector development and economic growth slides for presentation edited
Banking sector development and economic growth slides for presentation editedBanking sector development and economic growth slides for presentation edited
Banking sector development and economic growth slides for presentation editedComrade Ibrahim Gani
 
Tax Incentives and Foreign Direct Investment in Nigeria
Tax Incentives and Foreign Direct Investment in NigeriaTax Incentives and Foreign Direct Investment in Nigeria
Tax Incentives and Foreign Direct Investment in Nigeriaiosrjce
 
Honors Thesis Presentation - "An Analysis of Emerging Markets"
Honors Thesis Presentation - "An Analysis of Emerging Markets"Honors Thesis Presentation - "An Analysis of Emerging Markets"
Honors Thesis Presentation - "An Analysis of Emerging Markets"dre101
 
10.1.1.194.4505
10.1.1.194.450510.1.1.194.4505
10.1.1.194.4505bubberjung
 
Fundamental and technical analysis
Fundamental and technical analysisFundamental and technical analysis
Fundamental and technical analysisAashishKhatkar2
 
The trilemma as a framework for understanding China and India’s recent moneta...
The trilemma as a framework for understanding China and India’s recent moneta...The trilemma as a framework for understanding China and India’s recent moneta...
The trilemma as a framework for understanding China and India’s recent moneta...Hiram Ruiz
 
Impact of Accounting Information on Stock Price Volatility (A Study of Select...
Impact of Accounting Information on Stock Price Volatility (A Study of Select...Impact of Accounting Information on Stock Price Volatility (A Study of Select...
Impact of Accounting Information on Stock Price Volatility (A Study of Select...inventionjournals
 
Financial liberalization on broad money
Financial liberalization on broad moneyFinancial liberalization on broad money
Financial liberalization on broad moneyAlexander Decker
 

What's hot (20)

Macroeconomic determinants of stock market development in emerging markets
Macroeconomic determinants of stock market development in emerging marketsMacroeconomic determinants of stock market development in emerging markets
Macroeconomic determinants of stock market development in emerging markets
 
F423944
F423944F423944
F423944
 
FDI in Examination of China and India
FDI in Examination of China and IndiaFDI in Examination of China and India
FDI in Examination of China and India
 
Effect of Voluntary Disclosure on Corporate Performance of Quoted Manufacturi...
Effect of Voluntary Disclosure on Corporate Performance of Quoted Manufacturi...Effect of Voluntary Disclosure on Corporate Performance of Quoted Manufacturi...
Effect of Voluntary Disclosure on Corporate Performance of Quoted Manufacturi...
 
Chapter
ChapterChapter
Chapter
 
Mandatory and Voluntary Disclosure of Annual Report on Investor Reaction
Mandatory and Voluntary Disclosure of Annual Report on Investor ReactionMandatory and Voluntary Disclosure of Annual Report on Investor Reaction
Mandatory and Voluntary Disclosure of Annual Report on Investor Reaction
 
Trends in Commercial Policies in an Emerging Economy - CHINA
Trends in Commercial Policies in an Emerging Economy - CHINATrends in Commercial Policies in an Emerging Economy - CHINA
Trends in Commercial Policies in an Emerging Economy - CHINA
 
E392430
E392430E392430
E392430
 
Japans economy
Japans economyJapans economy
Japans economy
 
Doing business in_korea_eng_2015
Doing business in_korea_eng_2015Doing business in_korea_eng_2015
Doing business in_korea_eng_2015
 
India Thailand Trade relation by Dr. Aasim Hussain
India Thailand Trade relation by Dr. Aasim Hussain India Thailand Trade relation by Dr. Aasim Hussain
India Thailand Trade relation by Dr. Aasim Hussain
 
C472428.pdf
C472428.pdfC472428.pdf
C472428.pdf
 
Banking sector development and economic growth slides for presentation edited
Banking sector development and economic growth slides for presentation editedBanking sector development and economic growth slides for presentation edited
Banking sector development and economic growth slides for presentation edited
 
Tax Incentives and Foreign Direct Investment in Nigeria
Tax Incentives and Foreign Direct Investment in NigeriaTax Incentives and Foreign Direct Investment in Nigeria
Tax Incentives and Foreign Direct Investment in Nigeria
 
Honors Thesis Presentation - "An Analysis of Emerging Markets"
Honors Thesis Presentation - "An Analysis of Emerging Markets"Honors Thesis Presentation - "An Analysis of Emerging Markets"
Honors Thesis Presentation - "An Analysis of Emerging Markets"
 
10.1.1.194.4505
10.1.1.194.450510.1.1.194.4505
10.1.1.194.4505
 
Fundamental and technical analysis
Fundamental and technical analysisFundamental and technical analysis
Fundamental and technical analysis
 
The trilemma as a framework for understanding China and India’s recent moneta...
The trilemma as a framework for understanding China and India’s recent moneta...The trilemma as a framework for understanding China and India’s recent moneta...
The trilemma as a framework for understanding China and India’s recent moneta...
 
Impact of Accounting Information on Stock Price Volatility (A Study of Select...
Impact of Accounting Information on Stock Price Volatility (A Study of Select...Impact of Accounting Information on Stock Price Volatility (A Study of Select...
Impact of Accounting Information on Stock Price Volatility (A Study of Select...
 
Financial liberalization on broad money
Financial liberalization on broad moneyFinancial liberalization on broad money
Financial liberalization on broad money
 

Similar to Effect of Stock Market Listing on Financial Performance of Companies Listed in Nairobi Securities Exchange

Modeling the effect of capital market empirical evidence from nigeria.
Modeling the effect of capital market empirical evidence from nigeria.Modeling the effect of capital market empirical evidence from nigeria.
Modeling the effect of capital market empirical evidence from nigeria.Alexander Decker
 
Stock market and economic growth the nigerian experience
Stock market and economic growth the nigerian experienceStock market and economic growth the nigerian experience
Stock market and economic growth the nigerian experienceAlexander Decker
 
Stock prices, capital market development and nigeria’s economic
Stock prices, capital market development and nigeria’s economicStock prices, capital market development and nigeria’s economic
Stock prices, capital market development and nigeria’s economicAlexander Decker
 
79e4150c0054648ae2
79e4150c0054648ae279e4150c0054648ae2
79e4150c0054648ae2Aria Putra
 
Effect of financial liberalization on the performance of informal capital market
Effect of financial liberalization on the performance of informal capital marketEffect of financial liberalization on the performance of informal capital market
Effect of financial liberalization on the performance of informal capital marketAlexander Decker
 
H375863
H375863H375863
H375863aijbm
 
Capital Market and Economic Growth Nexus: Evidence from Nigeria
Capital Market and Economic Growth Nexus: Evidence from NigeriaCapital Market and Economic Growth Nexus: Evidence from Nigeria
Capital Market and Economic Growth Nexus: Evidence from Nigeriaiosrjce
 
Do government expenditure and debt affect stock market development in nigeria
Do government expenditure and debt affect stock market development in nigeriaDo government expenditure and debt affect stock market development in nigeria
Do government expenditure and debt affect stock market development in nigeriaAlexander Decker
 
International Journal of Humanities and Social Science Invention (IJHSSI)
International Journal of Humanities and Social Science Invention (IJHSSI)International Journal of Humanities and Social Science Invention (IJHSSI)
International Journal of Humanities and Social Science Invention (IJHSSI)inventionjournals
 
Cash Flow Activities and Stock Returns Evidence from Nigerian Consumer Goods ...
Cash Flow Activities and Stock Returns Evidence from Nigerian Consumer Goods ...Cash Flow Activities and Stock Returns Evidence from Nigerian Consumer Goods ...
Cash Flow Activities and Stock Returns Evidence from Nigerian Consumer Goods ...ijtsrd
 
Stock Market Investment Incentives: A Gift or a Motivator? Evidence from Lite...
Stock Market Investment Incentives: A Gift or a Motivator? Evidence from Lite...Stock Market Investment Incentives: A Gift or a Motivator? Evidence from Lite...
Stock Market Investment Incentives: A Gift or a Motivator? Evidence from Lite...Business, Management and Economics Research
 
Impact of profitability, bank and macroeconomic factors on the market capital...
Impact of profitability, bank and macroeconomic factors on the market capital...Impact of profitability, bank and macroeconomic factors on the market capital...
Impact of profitability, bank and macroeconomic factors on the market capital...inventionjournals
 
Working capital management and the performance of selected quoted manufacturi...
Working capital management and the performance of selected quoted manufacturi...Working capital management and the performance of selected quoted manufacturi...
Working capital management and the performance of selected quoted manufacturi...Alexander Decker
 

Similar to Effect of Stock Market Listing on Financial Performance of Companies Listed in Nairobi Securities Exchange (20)

Modeling the effect of capital market empirical evidence from nigeria.
Modeling the effect of capital market empirical evidence from nigeria.Modeling the effect of capital market empirical evidence from nigeria.
Modeling the effect of capital market empirical evidence from nigeria.
 
F4114248.pdf
F4114248.pdfF4114248.pdf
F4114248.pdf
 
Stock market and economic growth the nigerian experience
Stock market and economic growth the nigerian experienceStock market and economic growth the nigerian experience
Stock market and economic growth the nigerian experience
 
Emerging Stock Markets and Performance of IPOs: An Application to the Regiona...
Emerging Stock Markets and Performance of IPOs: An Application to the Regiona...Emerging Stock Markets and Performance of IPOs: An Application to the Regiona...
Emerging Stock Markets and Performance of IPOs: An Application to the Regiona...
 
Stock prices, capital market development and nigeria’s economic
Stock prices, capital market development and nigeria’s economicStock prices, capital market development and nigeria’s economic
Stock prices, capital market development and nigeria’s economic
 
79e4150c0054648ae2
79e4150c0054648ae279e4150c0054648ae2
79e4150c0054648ae2
 
Effect of financial liberalization on the performance of informal capital market
Effect of financial liberalization on the performance of informal capital marketEffect of financial liberalization on the performance of informal capital market
Effect of financial liberalization on the performance of informal capital market
 
H375863
H375863H375863
H375863
 
Capital Market and Economic Growth Nexus: Evidence from Nigeria
Capital Market and Economic Growth Nexus: Evidence from NigeriaCapital Market and Economic Growth Nexus: Evidence from Nigeria
Capital Market and Economic Growth Nexus: Evidence from Nigeria
 
Do government expenditure and debt affect stock market development in nigeria
Do government expenditure and debt affect stock market development in nigeriaDo government expenditure and debt affect stock market development in nigeria
Do government expenditure and debt affect stock market development in nigeria
 
International Journal of Humanities and Social Science Invention (IJHSSI)
International Journal of Humanities and Social Science Invention (IJHSSI)International Journal of Humanities and Social Science Invention (IJHSSI)
International Journal of Humanities and Social Science Invention (IJHSSI)
 
IMPACT OF STOCK EXCHANGE MARKET TO THE ECONOMIC GROWTH IN TANZANIA
IMPACT OF STOCK EXCHANGE MARKET TO THE ECONOMIC GROWTH IN TANZANIAIMPACT OF STOCK EXCHANGE MARKET TO THE ECONOMIC GROWTH IN TANZANIA
IMPACT OF STOCK EXCHANGE MARKET TO THE ECONOMIC GROWTH IN TANZANIA
 
Cash Flow Activities and Stock Returns Evidence from Nigerian Consumer Goods ...
Cash Flow Activities and Stock Returns Evidence from Nigerian Consumer Goods ...Cash Flow Activities and Stock Returns Evidence from Nigerian Consumer Goods ...
Cash Flow Activities and Stock Returns Evidence from Nigerian Consumer Goods ...
 
Stock Market Investment Incentives: A Gift or a Motivator? Evidence from Lite...
Stock Market Investment Incentives: A Gift or a Motivator? Evidence from Lite...Stock Market Investment Incentives: A Gift or a Motivator? Evidence from Lite...
Stock Market Investment Incentives: A Gift or a Motivator? Evidence from Lite...
 
Impact of profitability, bank and macroeconomic factors on the market capital...
Impact of profitability, bank and macroeconomic factors on the market capital...Impact of profitability, bank and macroeconomic factors on the market capital...
Impact of profitability, bank and macroeconomic factors on the market capital...
 
The Influences of Company's Internal Factors and Macroeconomics against the S...
The Influences of Company's Internal Factors and Macroeconomics against the S...The Influences of Company's Internal Factors and Macroeconomics against the S...
The Influences of Company's Internal Factors and Macroeconomics against the S...
 
Tinuoye Olajumoke Fatima
Tinuoye Olajumoke FatimaTinuoye Olajumoke Fatima
Tinuoye Olajumoke Fatima
 
IPO publication
IPO publicationIPO publication
IPO publication
 
Working capital management and the performance of selected quoted manufacturi...
Working capital management and the performance of selected quoted manufacturi...Working capital management and the performance of selected quoted manufacturi...
Working capital management and the performance of selected quoted manufacturi...
 
Pattern Of Relationship Between Macro Economics, Capital Structure, Profitabi...
Pattern Of Relationship Between Macro Economics, Capital Structure, Profitabi...Pattern Of Relationship Between Macro Economics, Capital Structure, Profitabi...
Pattern Of Relationship Between Macro Economics, Capital Structure, Profitabi...
 

Recently uploaded

Independent Call Girl Number in Kurla Mumbai📲 Pooja Nehwal 9892124323 💞 Full ...
Independent Call Girl Number in Kurla Mumbai📲 Pooja Nehwal 9892124323 💞 Full ...Independent Call Girl Number in Kurla Mumbai📲 Pooja Nehwal 9892124323 💞 Full ...
Independent Call Girl Number in Kurla Mumbai📲 Pooja Nehwal 9892124323 💞 Full ...Pooja Nehwal
 
Dividend Policy and Dividend Decision Theories.pptx
Dividend Policy and Dividend Decision Theories.pptxDividend Policy and Dividend Decision Theories.pptx
Dividend Policy and Dividend Decision Theories.pptxanshikagoel52
 
Best VIP Call Girls Noida Sector 18 Call Me: 8448380779
Best VIP Call Girls Noida Sector 18 Call Me: 8448380779Best VIP Call Girls Noida Sector 18 Call Me: 8448380779
Best VIP Call Girls Noida Sector 18 Call Me: 8448380779Delhi Call girls
 
VIP Call Girls in Saharanpur Aarohi 8250192130 Independent Escort Service Sah...
VIP Call Girls in Saharanpur Aarohi 8250192130 Independent Escort Service Sah...VIP Call Girls in Saharanpur Aarohi 8250192130 Independent Escort Service Sah...
VIP Call Girls in Saharanpur Aarohi 8250192130 Independent Escort Service Sah...Suhani Kapoor
 
High Class Call Girls Nashik Maya 7001305949 Independent Escort Service Nashik
High Class Call Girls Nashik Maya 7001305949 Independent Escort Service NashikHigh Class Call Girls Nashik Maya 7001305949 Independent Escort Service Nashik
High Class Call Girls Nashik Maya 7001305949 Independent Escort Service NashikCall Girls in Nagpur High Profile
 
Lundin Gold April 2024 Corporate Presentation v4.pdf
Lundin Gold April 2024 Corporate Presentation v4.pdfLundin Gold April 2024 Corporate Presentation v4.pdf
Lundin Gold April 2024 Corporate Presentation v4.pdfAdnet Communications
 
Chapter 2.ppt of macroeconomics by mankiw 9th edition
Chapter 2.ppt of macroeconomics by mankiw 9th editionChapter 2.ppt of macroeconomics by mankiw 9th edition
Chapter 2.ppt of macroeconomics by mankiw 9th editionMuhammadHusnain82237
 
Quantitative Analysis of Retail Sector Companies
Quantitative Analysis of Retail Sector CompaniesQuantitative Analysis of Retail Sector Companies
Quantitative Analysis of Retail Sector Companiesprashantbhati354
 
Monthly Market Risk Update: April 2024 [SlideShare]
Monthly Market Risk Update: April 2024 [SlideShare]Monthly Market Risk Update: April 2024 [SlideShare]
Monthly Market Risk Update: April 2024 [SlideShare]Commonwealth
 
Bladex Earnings Call Presentation 1Q2024
Bladex Earnings Call Presentation 1Q2024Bladex Earnings Call Presentation 1Q2024
Bladex Earnings Call Presentation 1Q2024Bladex
 
VIP Call Girls Service Dilsukhnagar Hyderabad Call +91-8250192130
VIP Call Girls Service Dilsukhnagar Hyderabad Call +91-8250192130VIP Call Girls Service Dilsukhnagar Hyderabad Call +91-8250192130
VIP Call Girls Service Dilsukhnagar Hyderabad Call +91-8250192130Suhani Kapoor
 
Instant Issue Debit Cards - School Designs
Instant Issue Debit Cards - School DesignsInstant Issue Debit Cards - School Designs
Instant Issue Debit Cards - School Designsegoetzinger
 
Russian Call Girls In Gtb Nagar (Delhi) 9711199012 💋✔💕😘 Naughty Call Girls Se...
Russian Call Girls In Gtb Nagar (Delhi) 9711199012 💋✔💕😘 Naughty Call Girls Se...Russian Call Girls In Gtb Nagar (Delhi) 9711199012 💋✔💕😘 Naughty Call Girls Se...
Russian Call Girls In Gtb Nagar (Delhi) 9711199012 💋✔💕😘 Naughty Call Girls Se...shivangimorya083
 
Interimreport1 January–31 March2024 Elo Mutual Pension Insurance Company
Interimreport1 January–31 March2024 Elo Mutual Pension Insurance CompanyInterimreport1 January–31 March2024 Elo Mutual Pension Insurance Company
Interimreport1 January–31 March2024 Elo Mutual Pension Insurance CompanyTyöeläkeyhtiö Elo
 
Log your LOA pain with Pension Lab's brilliant campaign
Log your LOA pain with Pension Lab's brilliant campaignLog your LOA pain with Pension Lab's brilliant campaign
Log your LOA pain with Pension Lab's brilliant campaignHenry Tapper
 
call girls in Nand Nagri (DELHI) 🔝 >༒9953330565🔝 genuine Escort Service 🔝✔️✔️
call girls in  Nand Nagri (DELHI) 🔝 >༒9953330565🔝 genuine Escort Service 🔝✔️✔️call girls in  Nand Nagri (DELHI) 🔝 >༒9953330565🔝 genuine Escort Service 🔝✔️✔️
call girls in Nand Nagri (DELHI) 🔝 >༒9953330565🔝 genuine Escort Service 🔝✔️✔️9953056974 Low Rate Call Girls In Saket, Delhi NCR
 
Dharavi Russian callg Girls, { 09892124323 } || Call Girl In Mumbai ...
Dharavi Russian callg Girls, { 09892124323 } || Call Girl In Mumbai ...Dharavi Russian callg Girls, { 09892124323 } || Call Girl In Mumbai ...
Dharavi Russian callg Girls, { 09892124323 } || Call Girl In Mumbai ...Pooja Nehwal
 
Vip B Aizawl Call Girls #9907093804 Contact Number Escorts Service Aizawl
Vip B Aizawl Call Girls #9907093804 Contact Number Escorts Service AizawlVip B Aizawl Call Girls #9907093804 Contact Number Escorts Service Aizawl
Vip B Aizawl Call Girls #9907093804 Contact Number Escorts Service Aizawlmakika9823
 
VIP Kolkata Call Girl Serampore 👉 8250192130 Available With Room
VIP Kolkata Call Girl Serampore 👉 8250192130  Available With RoomVIP Kolkata Call Girl Serampore 👉 8250192130  Available With Room
VIP Kolkata Call Girl Serampore 👉 8250192130 Available With Roomdivyansh0kumar0
 
Q3 2024 Earnings Conference Call and Webcast Slides
Q3 2024 Earnings Conference Call and Webcast SlidesQ3 2024 Earnings Conference Call and Webcast Slides
Q3 2024 Earnings Conference Call and Webcast SlidesMarketing847413
 

Recently uploaded (20)

Independent Call Girl Number in Kurla Mumbai📲 Pooja Nehwal 9892124323 💞 Full ...
Independent Call Girl Number in Kurla Mumbai📲 Pooja Nehwal 9892124323 💞 Full ...Independent Call Girl Number in Kurla Mumbai📲 Pooja Nehwal 9892124323 💞 Full ...
Independent Call Girl Number in Kurla Mumbai📲 Pooja Nehwal 9892124323 💞 Full ...
 
Dividend Policy and Dividend Decision Theories.pptx
Dividend Policy and Dividend Decision Theories.pptxDividend Policy and Dividend Decision Theories.pptx
Dividend Policy and Dividend Decision Theories.pptx
 
Best VIP Call Girls Noida Sector 18 Call Me: 8448380779
Best VIP Call Girls Noida Sector 18 Call Me: 8448380779Best VIP Call Girls Noida Sector 18 Call Me: 8448380779
Best VIP Call Girls Noida Sector 18 Call Me: 8448380779
 
VIP Call Girls in Saharanpur Aarohi 8250192130 Independent Escort Service Sah...
VIP Call Girls in Saharanpur Aarohi 8250192130 Independent Escort Service Sah...VIP Call Girls in Saharanpur Aarohi 8250192130 Independent Escort Service Sah...
VIP Call Girls in Saharanpur Aarohi 8250192130 Independent Escort Service Sah...
 
High Class Call Girls Nashik Maya 7001305949 Independent Escort Service Nashik
High Class Call Girls Nashik Maya 7001305949 Independent Escort Service NashikHigh Class Call Girls Nashik Maya 7001305949 Independent Escort Service Nashik
High Class Call Girls Nashik Maya 7001305949 Independent Escort Service Nashik
 
Lundin Gold April 2024 Corporate Presentation v4.pdf
Lundin Gold April 2024 Corporate Presentation v4.pdfLundin Gold April 2024 Corporate Presentation v4.pdf
Lundin Gold April 2024 Corporate Presentation v4.pdf
 
Chapter 2.ppt of macroeconomics by mankiw 9th edition
Chapter 2.ppt of macroeconomics by mankiw 9th editionChapter 2.ppt of macroeconomics by mankiw 9th edition
Chapter 2.ppt of macroeconomics by mankiw 9th edition
 
Quantitative Analysis of Retail Sector Companies
Quantitative Analysis of Retail Sector CompaniesQuantitative Analysis of Retail Sector Companies
Quantitative Analysis of Retail Sector Companies
 
Monthly Market Risk Update: April 2024 [SlideShare]
Monthly Market Risk Update: April 2024 [SlideShare]Monthly Market Risk Update: April 2024 [SlideShare]
Monthly Market Risk Update: April 2024 [SlideShare]
 
Bladex Earnings Call Presentation 1Q2024
Bladex Earnings Call Presentation 1Q2024Bladex Earnings Call Presentation 1Q2024
Bladex Earnings Call Presentation 1Q2024
 
VIP Call Girls Service Dilsukhnagar Hyderabad Call +91-8250192130
VIP Call Girls Service Dilsukhnagar Hyderabad Call +91-8250192130VIP Call Girls Service Dilsukhnagar Hyderabad Call +91-8250192130
VIP Call Girls Service Dilsukhnagar Hyderabad Call +91-8250192130
 
Instant Issue Debit Cards - School Designs
Instant Issue Debit Cards - School DesignsInstant Issue Debit Cards - School Designs
Instant Issue Debit Cards - School Designs
 
Russian Call Girls In Gtb Nagar (Delhi) 9711199012 💋✔💕😘 Naughty Call Girls Se...
Russian Call Girls In Gtb Nagar (Delhi) 9711199012 💋✔💕😘 Naughty Call Girls Se...Russian Call Girls In Gtb Nagar (Delhi) 9711199012 💋✔💕😘 Naughty Call Girls Se...
Russian Call Girls In Gtb Nagar (Delhi) 9711199012 💋✔💕😘 Naughty Call Girls Se...
 
Interimreport1 January–31 March2024 Elo Mutual Pension Insurance Company
Interimreport1 January–31 March2024 Elo Mutual Pension Insurance CompanyInterimreport1 January–31 March2024 Elo Mutual Pension Insurance Company
Interimreport1 January–31 March2024 Elo Mutual Pension Insurance Company
 
Log your LOA pain with Pension Lab's brilliant campaign
Log your LOA pain with Pension Lab's brilliant campaignLog your LOA pain with Pension Lab's brilliant campaign
Log your LOA pain with Pension Lab's brilliant campaign
 
call girls in Nand Nagri (DELHI) 🔝 >༒9953330565🔝 genuine Escort Service 🔝✔️✔️
call girls in  Nand Nagri (DELHI) 🔝 >༒9953330565🔝 genuine Escort Service 🔝✔️✔️call girls in  Nand Nagri (DELHI) 🔝 >༒9953330565🔝 genuine Escort Service 🔝✔️✔️
call girls in Nand Nagri (DELHI) 🔝 >༒9953330565🔝 genuine Escort Service 🔝✔️✔️
 
Dharavi Russian callg Girls, { 09892124323 } || Call Girl In Mumbai ...
Dharavi Russian callg Girls, { 09892124323 } || Call Girl In Mumbai ...Dharavi Russian callg Girls, { 09892124323 } || Call Girl In Mumbai ...
Dharavi Russian callg Girls, { 09892124323 } || Call Girl In Mumbai ...
 
Vip B Aizawl Call Girls #9907093804 Contact Number Escorts Service Aizawl
Vip B Aizawl Call Girls #9907093804 Contact Number Escorts Service AizawlVip B Aizawl Call Girls #9907093804 Contact Number Escorts Service Aizawl
Vip B Aizawl Call Girls #9907093804 Contact Number Escorts Service Aizawl
 
VIP Kolkata Call Girl Serampore 👉 8250192130 Available With Room
VIP Kolkata Call Girl Serampore 👉 8250192130  Available With RoomVIP Kolkata Call Girl Serampore 👉 8250192130  Available With Room
VIP Kolkata Call Girl Serampore 👉 8250192130 Available With Room
 
Q3 2024 Earnings Conference Call and Webcast Slides
Q3 2024 Earnings Conference Call and Webcast SlidesQ3 2024 Earnings Conference Call and Webcast Slides
Q3 2024 Earnings Conference Call and Webcast Slides
 

Effect of Stock Market Listing on Financial Performance of Companies Listed in Nairobi Securities Exchange

  • 1. ISSN 2349-7807 International Journal of Recent Research in Commerce Economics and Management (IJRRCEM) Vol. 4, Issue 2, pp: (8-14), Month: April - June 2017, Available at: www.paperpublications.org Page | 8 Paper Publications Effect of Stock Market Listing on Financial Performance of Companies Listed in Nairobi Securities Exchange Wilbert Kiplangat Kurgat Daystar University, Kenya Abstract: This study is on the effect of stock market listing on financial performance of companies listed in Nairobi Securities Exchange (NSE). The specific objectives of the study determining how the nature of business industry and size of companies affected their financial performance, how government policy effected through Capital Markets Authority (CMA) influenced financial performance of companies listed in NSE, how management of the companies listed in NSE affected their financial performance, and how availability of information influenced the financial performance of companies listed in NSE. The Population of the study as well as the target population was a census of all 61 listed companies at the Nairobi Securities Exchange (NSE) as at 31st December 2012. This study established that in general stock market listing affects different profitability ratios in different ways. Some improve as a result of stock market listing while others deteriorate. Keywords: Nairobi Securities Exchange (NSE), Listing, Return on Assets (ROA), Return on Equity (ROE). 1. INTRODUCTION Trading in securities in Kenya started way back in the 1920s through call-over systems. The NSE started in 1954 as a voluntary association of stock brokers and was registered under the Societies Act after getting clearance from London Stock Exchange. After independence there were changes. Nineteen sixty-six (1966) was taken as the base year and 100 points were used in the trading. But after 1991 it started using 20 share index and geometric mean. There were many quoted companies by 1990s quoted companies representing different sectors namely the Agricultural, commercial and services; finance & investment &; Industrial & Allied sectors in Alternative Investment Market. Trading on the stock exchange has become a fashionable tool for raising capital. Investors have become increasingly aware of the potential of the Nairobi Stock Exchange (Kihumba, 1993). There is lack of public awareness at the NSE. However, CMA was constituted and segmentation of the NSE started in 2001 in order to encourage companies to trade in the NSE. There has been -0.83% growth in the NSE since its inception. In 2001 the government through CMA decided to introduce market segmentation at the NSE in order to enable as many companies as possible to list at the NSE. The following are the segments: i. Main Investment Market Segment (MIMS) ii. Alternative Investment Market Segment (AIMS) iii. Fixed Investment Securities Market Segment (FISMS) Studies into this segmentation concludes that it has affected the prices of securities significantly (Chepng’ar, 2006; Ngugi, 2003)).
  • 2. ISSN 2349-7807 International Journal of Recent Research in Commerce Economics and Management (IJRRCEM) Vol. 4, Issue 2, pp: (8-14), Month: April - June 2017, Available at: www.paperpublications.org Page | 9 Paper Publications The stock exchange currently runs on an electronic trading platform known as the automated trading system and is open daily for a six-hour trading period. The stock exchange’s main market index is the NSE 20 Share Index and also has an aggregate index known as the NASI All Share Index. The exchange trades in ordinary equity, preference shares and treasury bonds and has four companies cross-listed on regional stock markets. Within the last few years the Nairobi bourse has grown from a market capitalization of Ksh112.59 billion ($1.42 B) in 2002 to Ksh853.88 billion ($12.38 B) in 2008 (it hit a peak of Ksh1.28 trillion ($18.53 B) in June 2008 (NSE Handbook, 2006). The stock market has increasingly become an avenue for bridging the requirements for both investors and borrowers. From early nineties many firms have been raising new equity through stock market for the first time. The role of raising capital by going public cannot be underplayed. A public offer if properly executed has the potential of raising large sums that would otherwise not be possible through borrowing. Going public offers a relatively cheap source of capital for investment and working capital requirements compared to the traditional intermediaries. It is, therefore, important to evaluate the effect that listing of a company at the Nairobi Stock Exchange has on its financial performance. Previous researches (Jumba, 2002; Maina, 2005) have concentrated on the underpricing of IPOs. These two studies looked at changes in prices after IPOs and concluded that IPOs are followed by initial high returns hence are underpriced. A recent study by Weche (2005) on the pre and post privatization on financial performance of companies listed through the NSE covered only previously state owned enterprises. Not all quoted companies were state owned enterprises prior to their listing since there are many quoted companies which were privately owned before going public. For instance between 1984 and 2000, there were sixteen IPOs of which thirteen were issues by private companies while three were issues by the government as part of the privatization programmes. Weche’s results of profitability and decrease in the leverage levels apply only to the previously state owned firms prior to their listing. Weche’s study was therefore limited. Going public may affect the firms’ performance. Pagano, Panetta, and Zingales (1998) in their study found that profitability declines after IPO then increases gradually after the first year. The study also established that companies deleverage immediately after IPO. From such studies, it is apparent that most research studies in the area have been done in developed markets with very little evidence for emerging markets, particularly Kenya. This study, therefore, tries to bridge this gap by investigating the effect of listing companies at the NSE on their financial performance. 2. METHODOLOGY This study is an exploratory study and it utilizes survey method. A survey is an attempt to collect data from members of a population in order to determine the current status of that population with respect to one or more variables. Survey is therefore a self-report study which requires the collection of quantifiable information from the sample (Mugenda and Mugenda, 2003). The data for the study was collected from websites of the Companies and the Capital Market Authority Library where all financial reports of companies listed are stored so that the public can have access to them whenever they need them. The target populations of the study are the 61 firms listed in Nairobi Securities Exchange as at close of 31st December 2012 trading period. Purposive sampling was used by the researcher. The data that was used in this study is secondary data that was collected based on the annual financial statements reports released by the companies which have listed there shares at the Nairobi Securities Exchange as at 31st December 2012. The data was analyzed and reported quantitatively using descriptive and inferential statistics. 3. FINDINGS 3.1 Introduction: These are the findings of the study on the survey of companies listed at the NSE between 1993 and 2012. The findings have been summarized in tables to give the general background information of the companies studied and graphs to show the trend of financial performance.
  • 3. ISSN 2349-7807 International Journal of Recent Research in Commerce Economics and Management (IJRRCEM) Vol. 4, Issue 2, pp: (8-14), Month: April - June 2017, Available at: www.paperpublications.org Page | 10 Paper Publications 3.2 Return on Assets: Table 1: Return on Assets Year 1 % Year 2 % Year 3% Year 4 % Year 5 % Year 6 % Cmc 2.00 1.70 1.50 3.90 4.80 5.40 Firestone 27.00 27.00 6.00 45.00 47.00 46.00 Mumias 0.271 1.31 7.66 0.684 -2.39 8.65 Kengen 4.80 2.20 2.30 2.40 4.50 1.90 Scan Group 7.14 10.22 14.51 13.94 8.37 10.20 Equity 2.50 2.00 3.00 3.60 5.00 4.20 Access Kenya Group 2.37 15.40 5.86 13.00 13.60 6.40 Eveready 32.70 38.10 32.90 19.70 3.30 4.20 Average 9.85 12.24 9.22 12.78 10.52 10.87 Table 2: Average Returns on Assets Average Return on Asset Before Listing % After Listing % CMC Motor 1.70 4.70 Firestone 20.00 46.00 Mumias 3.08 2.10 Kengen 3.10 8.80 Scan Group 10.60 10.80 Equity Bank 2.50 4.30 Access Kenya 7.88 11.00 Eveready 3.46 9.07 Average ROA 10.44 11.39 ROA is an indicator of how profitable a company is relative to its total assets. ROA gives an idea as to how efficient management is using its assets to generate earnings. CMC recorded a steady increase after listing over next three years under study. Firestone recorded a sharp increase in the first year after listing then a relatively stable ratio in the next two year under study. Mumias decreases in the first two years after listing having a negative ratio then increases in the last year of study. Kengen and Equity recorded a stable ratio in the first year after listing then a slight increase in the second year followed by a decrease in the third year. Scangroup recorded a stable ratio in the first year after listing then a decrease in the second year followed by a slight increase in the third year under study. As a result its average remained relatively stable with only an increase of 0.2% after listing. Access Kenya recorded a sharp increase in the first year after listing followed by a steady increase in the second year and a relatively sharp decrease in the third year under study. Eveready decrease sharply in the first two year after listing in the years under study then records a slight increase in the third year after listing in the years under study. On average the companies studied exhibited a slight increase in the return on assets from 10.44% before listing to 11.39% after listing.
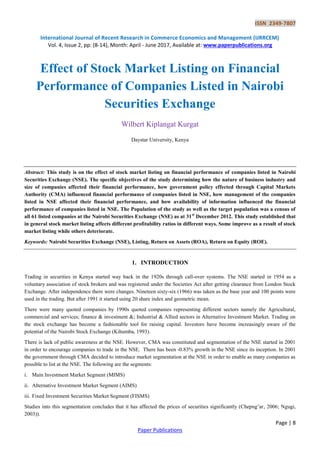
  • 4. ISSN 2349-7807 International Journal of Recent Research in Commerce Economics and Management (IJRRCEM) Vol. 4, Issue 2, pp: (8-14), Month: April - June 2017, Available at: www.paperpublications.org Page | 11 Paper Publications 3.3 Return on Equity: Figure 1: Return on Equity Graph Table 3: Average Return on Equity Average Return On Equity Before Listing % After Listing % CMC Motor 3.80 15.43 Firestone 41.20 47.00 Mumias 5.90 3.84 Kengen 7.10 4.73 Scan Group 67.31 22.21 Equity Bank 17.43 17.07 Access Kenya 9.55 16.20 Eveready 68.13 13.53 Average ROE 29.65 17.50 -40.00% -20.00% 0.00% 20.00% 40.00% 60.00% 80.00% 100.00% year 1 year2 year 3 year 4 year 5 year 6 R e t u r n o n E q u i t y YEARS Return on Equity graph Cmc Fireston e Mumias Kengen Scangro up Equity Acesske nya Everead y Average
  • 5. ISSN 2349-7807 International Journal of Recent Research in Commerce Economics and Management (IJRRCEM) Vol. 4, Issue 2, pp: (8-14), Month: April - June 2017, Available at: www.paperpublications.org Page | 12 Paper Publications ROE is the amount of net income returned as a percentage of shareholders equity. Return on equity measures a corporation's profitability by revealing how much profit a company generates with the money shareholders have invested. CMC recorded a steady increase in the ROE after listing. Firestone, Kengen and Scan group exhibited a decrease immediately after listing which continued for the next two years under study. Mumias performance decreased in the first two years after listing exhibiting a negative ratio, in the second year it increased in the following year; however, the average returns on equity after listing of 3.84% is lower than the average of 5.90% before listing. Equity’s ratio decreases immediately after listing then increases in the following years under study. Access Kenya exhibits a seismological pattern where it decreases sharply after listing then increases slightly followed by a decrease in the last year of study. Eveready decreases sharply after listing for the following two years followed by a relative stability in the last year. In average, the companies under study recorded a decrease after listing from 29.65% to 17.50%. 3.4 Net Profit Margin: Figure 2: Net Profit Margin Graph 0.00% 10.00% 20.00% 30.00% 40.00% 50.00% 60.00% year 1 year2 year 3 year 4 year 5 year 6 N e t p r o f i t M a r g i n YEARS Net Profit Margin Cmc Firestone Mumias Kengen Scangroup Equity Acesskenya Eveready Average
  • 6. ISSN 2349-7807 International Journal of Recent Research in Commerce Economics and Management (IJRRCEM) Vol. 4, Issue 2, pp: (8-14), Month: April - June 2017, Available at: www.paperpublications.org Page | 13 Paper Publications Profit margin, net margin, net profit margin or net profit ratio all refer to a measure of profitability. It is calculated by finding the net profit as a percentage of the revenue. The study showed that CMC’s net profit margin increased slightly immediately after it was listed. The increase continued for the next three years under study. However for firestone, the net profit margin decreased immediately after listing which continued for the next three years under study, Eveready follows the same pattern except that the decline started before the listing. Mumias decreased immediately after listing for one year and then increased in the following years under study. Kengen exhibited a seismological pattern after listing where it remains relatively stable for one year after listing, then deteriorates from an increase to a decline in the following years. As a result the average net profit margin of 22.23% decreases to 21.03% after the company was listed. Scan group recorded a decline immediately after listing then rises slightly in the last year under study. As a result its average rises from 4.12% to 5.78% after listing. Equity’s and Access Kenya net profit margin increased after listing then declined in the next two years under study. However the average of all the companies studied increased from 9.98% before listing to 13.91% after listing. 3.5 Asset Turnover: Figure 3: Asset turnover graph Asset turnover is a financial ratio that measures the efficiency of a company's use of its assets in generating sales revenue or sales income to the company. CMC and Mumias records a decrease in asset turnover immediately after listing then increases steadily in the following two years under the period of study. Firestone increases in the first two years after listing then 0.00% 50.00% 100.00% 150.00% 200.00% 250.00% 300.00% 350.00% year 1 year2 year 3 year 4 year 5 year 6 A s s e t T u r n o v e r YEARS Asset Turnover Graph Cmc Firestone Mumias Kengen Scangroup Equity Acesskenya Eveready Average
  • 7. ISSN 2349-7807 International Journal of Recent Research in Commerce Economics and Management (IJRRCEM) Vol. 4, Issue 2, pp: (8-14), Month: April - June 2017, Available at: www.paperpublications.org Page | 14 Paper Publications drastically declines. Kengen and Equity exhibit a slight decrease one year after listing then increases slightly and remained stable in the last year of study. Scan group portrays a seismological pattern where it increases immediately after listing then decrease and in the last year under study remains stable. Scan Group performance decreased from 289.70% to 192% after listing. Access Kenya drastically decreases immediately after listing then slightly increases followed by a slight decrease in the last year of study. This causes its average to decrease to 93.30% after listing from 218.5% before listing. Eveready decreases immediately after listing then increases in the next year followed by a decrease in the last year of study. This causes the average after listing to decrease from 263.30% before listing to 185.70%. On average, the companies studied exhibited a consistent decrease in the asset turnover which resulted to decrease from 145.92% before listing to 104.90% after listing. 4. CONCLUSION This study implemented four profitability ratios; ROE, ROA, asset turnover and net profit margin. The results show that the average ROA increased from 10.44% before listing to 11.39% after listing. This implies that the assets’ ability to generate profit increases as a result of stock market listing. This is an indicator of an increase in financial performance. The second measure was ROE. The average ROE of the companies under study decreased from 29.65% before listing to 17.5% after listing. This shows deterioration in the profits earned by company using the shareholders investments. The third measure is net profit margin. On average the studied companies recorded an increase from 9.98% before listing to 13.91% after listing. This shows an improvement in the companies’ ability to control cost as a result of stock market listing. The last measure is asset turnover. On average the studied companies decreased from 145.92% before listing to 104.9% after listing. This shows that the companies’ asset ability to generate revenue decreases as a result of stock market listing. REFERENCES [1] Chepng’ar, R. K. (2006). A survey of the factors that account for the dismal listing at the Nairobi Stock Exchange. MBA Thesis, University of Nairobi. [2] Jumba, N. (2002). Initial public offer performance in Kenya. Unpublished MBA Project, University of Nairobi. [3] Kihumba, J. (1993). Investor newsletter. Investment Promotion Centre Publication. [4] Mugenda, A. G. and Mugenda, O. M. (2003). Research methods: quantitative and qualitative approaches. Nairobi: ACTS Press. [5] Nairobi Securities Exchange (NSE). (2006). Handbook. [6] Ngugi, R. W. (2003). Development of NSE: a historical perspective. KIPPRA Discussion Paper no. 27. [7] Pagano, M.; Panetta, F. and Zingale, L. (1998). Why do companies go public? An Empirical analysis. Journal of Finance vol.53 [8] Weche, O. (2005). Pre and post financial performance of firm privatized through NSE. Unpublished MBA Project, University of Nairobi.