![Omnitele on HSPA Evolution
Achieving the maximum performance of baseline HSDPA
The results are presented with two KPIs, namely Cell throughput and User data rate. KPIs can be summarised as follows:
Cell throughput shows what data throughput a cell can transmit on average in downlink. It represents the user throughput in
a case when only one user is active in the cell. User data rate takes into account the traffic model and queuing effects so that
it represents the average data rate experienced by an arbitrary user. The latter KPI is important in forecasting future capacity
needs since strong traffic growth has significant effect on user perceived data rates.
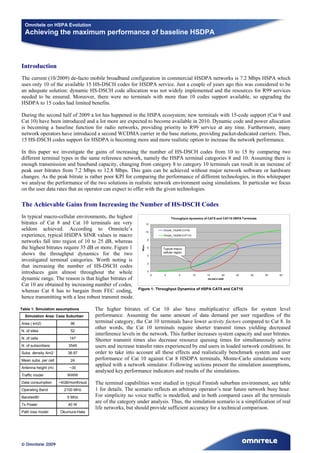
Key Results – Cat 10 outperforms Cat 8 by factor of 20%
As said, increasing the number of HS-DSCH codes is not
Average Throughput of HSPA CAT8 and CAT10 in
only a peak bitrate enhancement, which is also clearly
Macro-cellular Suburban
visible in the results. About 19 % gain for Cat 10 over Cat 3500
8 can be observed in average cell throughput, the absolute 3000
CAT8
3002 CAT10
values being around 3 and 2.5 Mbps correspondingly. The 2500
average user data rates are naturally slightly less: 2.3 Mbps 2521
2000 2325
[kbps]
on average for Cat 10 and 1.9 Mbps for Cat 8, resulting in 1500
1906
22 % gain for Cat 10 over Cat 8. Investigating the cell 1000
throughput distributions (see Figure 3) of the two 500
simulation cases also reveals interesting results. For Cat 8 0
there are virtually no cells serving above 3 Mbps whereas Cell Throughput User Datarate
with Cat 10 significant amount of samples fall into region
Figure 2: Simulated Throughput of HSPA CAT8 and CAT10
above 3.5 Mbps.
Summary and Conclusions
In this paper we presented some key results
Cell Throughput Distribution of HSPA
from a case study carried out to identify the CAT8 and CAT10 in Macro-cellular Suburban
gains available from increasing the number of 20.00% 100.00 %
HS-DSCH codes in the network from 10 to 15 18.00% 90.00 %
codes. Simulations indicate roughly 20 % 16.00% CAT8
80.00 %
14.00% CAT10 70.00 %
performance increase in the system capacity CAT8 Cumulative
12.00% 60.00 %
and slightly more in user bitrates. The 10.00% CAT10 Cumulative 50.00 %
achievable real life performance gain will 8.00% 40.00 %
most likely be slightly less though, as 6.00% 30.00 %
changing the whole terminal base to Cat 10 4.00% 20.00 %
devices will not be rapid and voice traffic will 2.00% 10.00 %
limit the achievable data rates. Another factor 0.00% 0.00 %
1050
1250
1450
1650
1850
2050
2250
2450
2650
2850
3050
3250
3450
3650
3850
4050
4250
4450
4650
4850
5050
to point out is that the results presented can
[kbps]
not be generalised to be applicable in any
arbitrary network. A cellular network is a Figure 3: Throughput distribution of HSPA CAT8 and CAT10
complex environment where everything relates to everything else. For networks with higher SINR, for example within areas
where a well designed micro cellular network exists, the achieved gain is likely to be higher than the simulation results. The
overall feasibility of using additional HS-DSCH codes also depends on the cost of required hardware implementation
(baseband and transmission capacity) and the cost and speed of the terminal base update. Still, considering new terminal
types entering the market all the time, and rather moderate network upgrades required, we see that in many cases there are
clear benefits for operators to upgrade their network to 15 HSDPA codes.
Omnitele Background
Omnitele Ltd. is a pioneer within the wireless industry with twenty years of leading edge network and business consulting
experience worldwide. Omnitele was founded in 1988 to set up the first GSM operator in the world and is owned by Finnish
national telecom operators and an external investor. Omnitele’s strengths lie in mobile network planning and development,
technical consulting and operator business development. We aim to increase and improve overall operator performance and
quality of services, and we thrive to provide best solutions for deploying new technologies. Omnitele mobile broadband
strategy consultancy services include analyses with realistic technology simulations and well educated terminal penetration
and data traffic modelling. Combined with the key economical inputs, Omnitele has created a leading edge model for mobile
broadband profitability analysis.
Published November 2009
For more information, please contact:
Karri Virkajärvi, Vice President, Marketing and Sales
firstname.lastname@omnitele.fi
www.omnitele.fi
© Omnitele 2009](data:image/gif;base64,R0lGODlhAQABAIAAAAAAAP///yH5BAEAAAAALAAAAAABAAEAAAIBRAA7)
Recommended
More Related Content
What's hot
What's hot (20)
Viewers also liked
Viewers also liked (20)
Similar to Achieving The Maximum Performance Of Baseline Hsdpa
Similar to Achieving The Maximum Performance Of Baseline Hsdpa (20)
Achieving The Maximum Performance Of Baseline Hsdpa
- 1. Omnitele on HSPA Evolution Achieving the maximum performance of baseline HSDPA Introduction The current (10/2009) de-facto mobile broadband configuration in commercial HSDPA networks is 7.2 Mbps HSPA which uses only 10 of the available 15 HS-DSCH codes for HSDPA service. Just a couple of years ago this was considered to be an adequate solution: dynamic HS-DSCH code allocation was not widely implemented and the resources for R99 services needed to be ensured. Moreover, there were no terminals with more than 10 codes support available, so upgrading the HSDPA to 15 codes had limited benefits. During the second half of 2009 a lot has happened in the HSPA ecosystem; new terminals with 15-code support (Cat 9 and Cat 10) have been introduced and a lot more are expected to become available in 2010. Dynamic code and power allocation is becoming a baseline function for radio networks, providing priority to R99 service at any time. Furthermore, many network operators have introduced a second WCDMA carrier in the base stations, providing packet-dedicated carriers. Thus, 15 HS-DSCH codes support for HSDPA is becoming more and more realistic option to increase the network performance. In this paper we investigate the gains of increasing the number of HS-DSCH codes from 10 to 15 by comparing two different terminal types in the same reference network, namely the HSPA terminal categories 8 and 10. Assuming there is enough transmission and baseband capacity, changing from category 8 to category 10 terminals can result in an increase of peak user bitrates from 7.2 Mbps to 12.8 Mbps. This gain can be achieved without major network software or hardware changes. As the peak bitrate is rather poor KPI for comparing the performance of different technologies, in this whitepaper we analyse the performance of the two solutions in realistic network environment using simulations. In particular we focus on the user data rates that an operator can expect to offer with the given technologies. The Achievable Gains from Increasing the Number of HS-DSCH Codes In typical macro-cellular environments, the highest Throughput dynamics of CAT8 and CAT10 HSPA Terminals bitrates of Cat 8 and Cat 10 terminals are very 12 seldom achieved. According to Omnitele’s 10 10code_16QAM (CAT8) experience, typical HSDPA SINR values in macro 15code_16QAM (CAT10) 8 networks fall into region of 10 to 25 dB, whereas Mbps the highest bitrates require 35 dB or more. Figure 1 6 Typical macro- cellular region shows the throughput dynamics for the two 4 investigated terminal categories. Worth noting is 2 that increasing the number of HS-DSCH codes introduces gain almost throughout the whole 0 -5 0 5 10 15 20 25 30 35 40 dynamic range. The reason is that higher bitrates of HS-DSCH SINR Cat 10 are obtained by increasing number of codes, Figure 1: Throughput Dynamics of HSPA CAT8 and CAT10 whereas Cat 8 has to bargain from FEC coding, hence transmitting with a less robust transmit mode. Table 1: Simulation assumptions The higher bitrates of Cat 10 also have multiplicative effects for system level Simulation Area: Case Suburban performance. Assuming the same amount of data demand per user regardless of the Area ( km2) 96 terminal category, the Cat 10 terminals have lower activity factors compared to Cat 8. In other words, the Cat 10 terminals require shorter transmit times yielding decreased N. of sites 52 interference levels in the network. This further increases system capacity and user bitrates. N. of cells 147 Shorter transmit times also decrease resource queuing times for simultaneously active N. of subscribers 3549 users and increase transfer rates experienced by end users in loaded network conditions. In Subs. density /km2 36.97 order to take into account all these effects and realistically benchmark system and user Mean subs. per cell 24 performance of Cat 10 against Cat 8 HSDPA terminals, Monte-Carlo simulations were applied with a network simulator. Following sections present the simulation assumptions, Antenna height (m) ~30 analysed key performance indicators and results of the simulations. Traffic model WWW Data consumption ~4GB/month/sub The terminal capabilities were studied in typical Finnish suburban environment, see table Operating Band 2100 MHz 1 for details. The scenario reflects an arbitrary operator’s near future network busy hour. Bandwidth 5 MHz For simplicity no voice traffic is modelled, and in both compared cases all the terminals are of the category under analysis. Thus, the simulation scenario is a simplification of real Tx Power 40 W life networks, but should provide sufficient accuracy for a technical comparison. Path loss model Okumura-Hata © Omnitele 2009
- 2. Omnitele on HSPA Evolution Achieving the maximum performance of baseline HSDPA The results are presented with two KPIs, namely Cell throughput and User data rate. KPIs can be summarised as follows: Cell throughput shows what data throughput a cell can transmit on average in downlink. It represents the user throughput in a case when only one user is active in the cell. User data rate takes into account the traffic model and queuing effects so that it represents the average data rate experienced by an arbitrary user. The latter KPI is important in forecasting future capacity needs since strong traffic growth has significant effect on user perceived data rates. Key Results – Cat 10 outperforms Cat 8 by factor of 20% As said, increasing the number of HS-DSCH codes is not Average Throughput of HSPA CAT8 and CAT10 in only a peak bitrate enhancement, which is also clearly Macro-cellular Suburban visible in the results. About 19 % gain for Cat 10 over Cat 3500 8 can be observed in average cell throughput, the absolute 3000 CAT8 3002 CAT10 values being around 3 and 2.5 Mbps correspondingly. The 2500 average user data rates are naturally slightly less: 2.3 Mbps 2521 2000 2325 [kbps] on average for Cat 10 and 1.9 Mbps for Cat 8, resulting in 1500 1906 22 % gain for Cat 10 over Cat 8. Investigating the cell 1000 throughput distributions (see Figure 3) of the two 500 simulation cases also reveals interesting results. For Cat 8 0 there are virtually no cells serving above 3 Mbps whereas Cell Throughput User Datarate with Cat 10 significant amount of samples fall into region Figure 2: Simulated Throughput of HSPA CAT8 and CAT10 above 3.5 Mbps. Summary and Conclusions In this paper we presented some key results Cell Throughput Distribution of HSPA from a case study carried out to identify the CAT8 and CAT10 in Macro-cellular Suburban gains available from increasing the number of 20.00% 100.00 % HS-DSCH codes in the network from 10 to 15 18.00% 90.00 % codes. Simulations indicate roughly 20 % 16.00% CAT8 80.00 % 14.00% CAT10 70.00 % performance increase in the system capacity CAT8 Cumulative 12.00% 60.00 % and slightly more in user bitrates. The 10.00% CAT10 Cumulative 50.00 % achievable real life performance gain will 8.00% 40.00 % most likely be slightly less though, as 6.00% 30.00 % changing the whole terminal base to Cat 10 4.00% 20.00 % devices will not be rapid and voice traffic will 2.00% 10.00 % limit the achievable data rates. Another factor 0.00% 0.00 % 1050 1250 1450 1650 1850 2050 2250 2450 2650 2850 3050 3250 3450 3650 3850 4050 4250 4450 4650 4850 5050 to point out is that the results presented can [kbps] not be generalised to be applicable in any arbitrary network. A cellular network is a Figure 3: Throughput distribution of HSPA CAT8 and CAT10 complex environment where everything relates to everything else. For networks with higher SINR, for example within areas where a well designed micro cellular network exists, the achieved gain is likely to be higher than the simulation results. The overall feasibility of using additional HS-DSCH codes also depends on the cost of required hardware implementation (baseband and transmission capacity) and the cost and speed of the terminal base update. Still, considering new terminal types entering the market all the time, and rather moderate network upgrades required, we see that in many cases there are clear benefits for operators to upgrade their network to 15 HSDPA codes. Omnitele Background Omnitele Ltd. is a pioneer within the wireless industry with twenty years of leading edge network and business consulting experience worldwide. Omnitele was founded in 1988 to set up the first GSM operator in the world and is owned by Finnish national telecom operators and an external investor. Omnitele’s strengths lie in mobile network planning and development, technical consulting and operator business development. We aim to increase and improve overall operator performance and quality of services, and we thrive to provide best solutions for deploying new technologies. Omnitele mobile broadband strategy consultancy services include analyses with realistic technology simulations and well educated terminal penetration and data traffic modelling. Combined with the key economical inputs, Omnitele has created a leading edge model for mobile broadband profitability analysis. Published November 2009 For more information, please contact: Karri Virkajärvi, Vice President, Marketing and Sales firstname.lastname@omnitele.fi www.omnitele.fi © Omnitele 2009