Downloaded 13 times
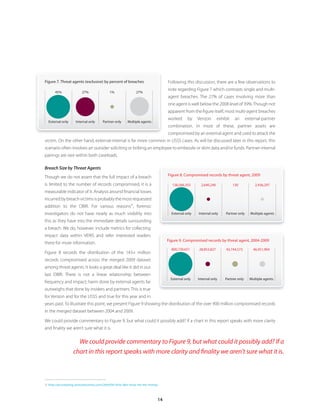
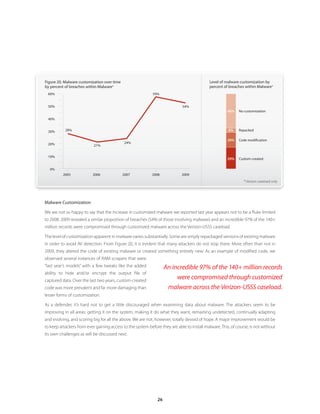
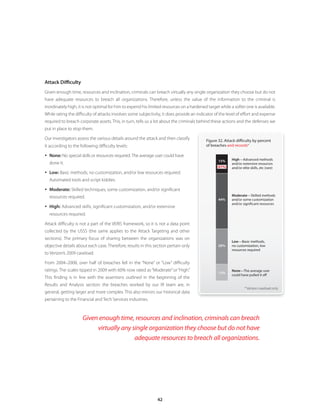
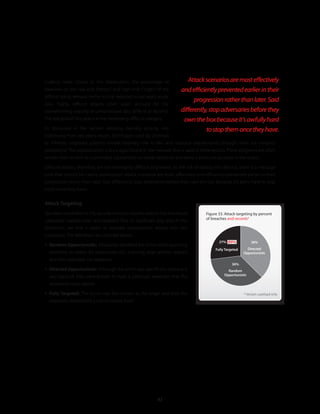
![The percentage of fully targeted attacks in our dataset (27%) is consistent with last year’s report (28%), which means the
majority of breach victims continue to be targets of opportunity. This is both good news and bad news. Good for those in
our profession who’s job difficulty levels correlate highly with criminal determination. Bad because it means many of us have
made ourselves targets when we otherwise might not have been. Doubly bad because when targeted attacks are successful,
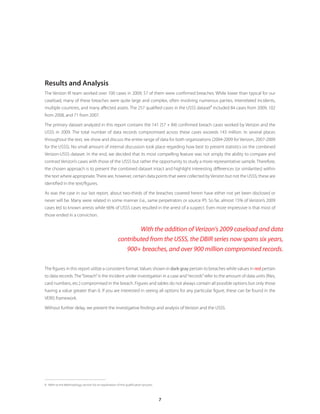
they can be quite lucrative for the attacker. In 2009, targeted attacks accounted for 89% of records compromised. Laying this
information side by side with data points in the Attack Difficulty section, one begins to get
the message many criminals are hearing: find a juicy target (even if well-protected), apply
We still believe
your resources, work hard, and you’ll reap the reward. We need to change that message.
that one of the
Though the same overall proportion, random and directed opportunistic attacks have
fundamental self- fluctuated somewhat in the last year. As discussed in last year’s report, we encounter many
assessments every breaches that seem neither truly random nor fully targeted—particularly in the Retail and
Hospitality industries. In a very common example, the attacker exploits Software X at Brand
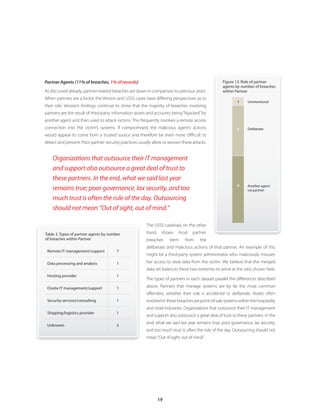
organization should
A Stores and later learns that Brand B Stores also runs Software X. An attack is then directed
undertake is to at Brand B Stores but only because of a known exploitable weakness. We don’t believe the
determine whether dip in directed opportunistic attacks stems from changes in the threat environment. Rather,
it is more likely due to the lower percentage of retailers and breaches that involve
they are a Target of
compromised partner assets within our 2009 caseload.
Choice or Target of We still believe that one of the fundamental self-assessments every organization should
Opportunity. undertake is to determine whether they are a Target of Choice or Target of Opportunity. The
security media hype machine would like us to believe that we’re all Targets of Choice and
there’s nothing we can do to stop the new [insert whatever you like here] threat. This simply isn’t true and is not a healthy line
of reasoning for security management. Consider instead questions like these: Do you have information the criminals want?
How badly do they want it? How can they profit from it? How far would they go to obtain it? How difficult would it be for
them to get it if they started trying today? What could you do to decrease the chances they will choose you or increase the
work required to overcome your defenses? Not answering such questions honestly and properly can result in serious
exposure on one hand and serious overspending on the other.
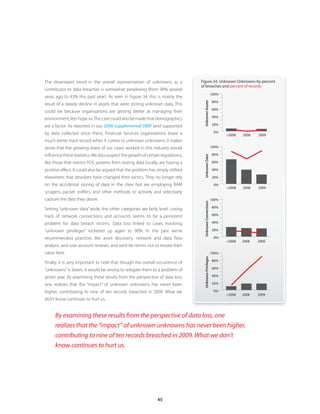
Unknown Unknowns
Past DBIRs have shown a strong correlation between security incidents and a victim’s lack of knowledge about their operating
environment, particularly with regard to the existence and status of information assets. Though the numbers are down in
2009, the year can hardly be called an exception. In nearly half of Verizon’s cases, investigators observed what we not so
affectionately call “unknown unknowns.” These are classified as meeting at least one of the following conditions:
y Assets unknown or unclaimed by the organization (or business group affected)
y Data the organization did not know existed on a particular asset
y Assets that had unknown network connections or accessibility
y Assets that had unknown user accounts or privileges
44](https://image.slidesharecdn.com/rp2010-data-breach-reportenxg-100901104944-phpapp01/85/Rp-2010-data-breach-report-en_xg-45-320.jpg)


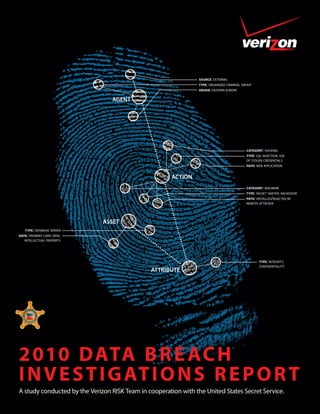
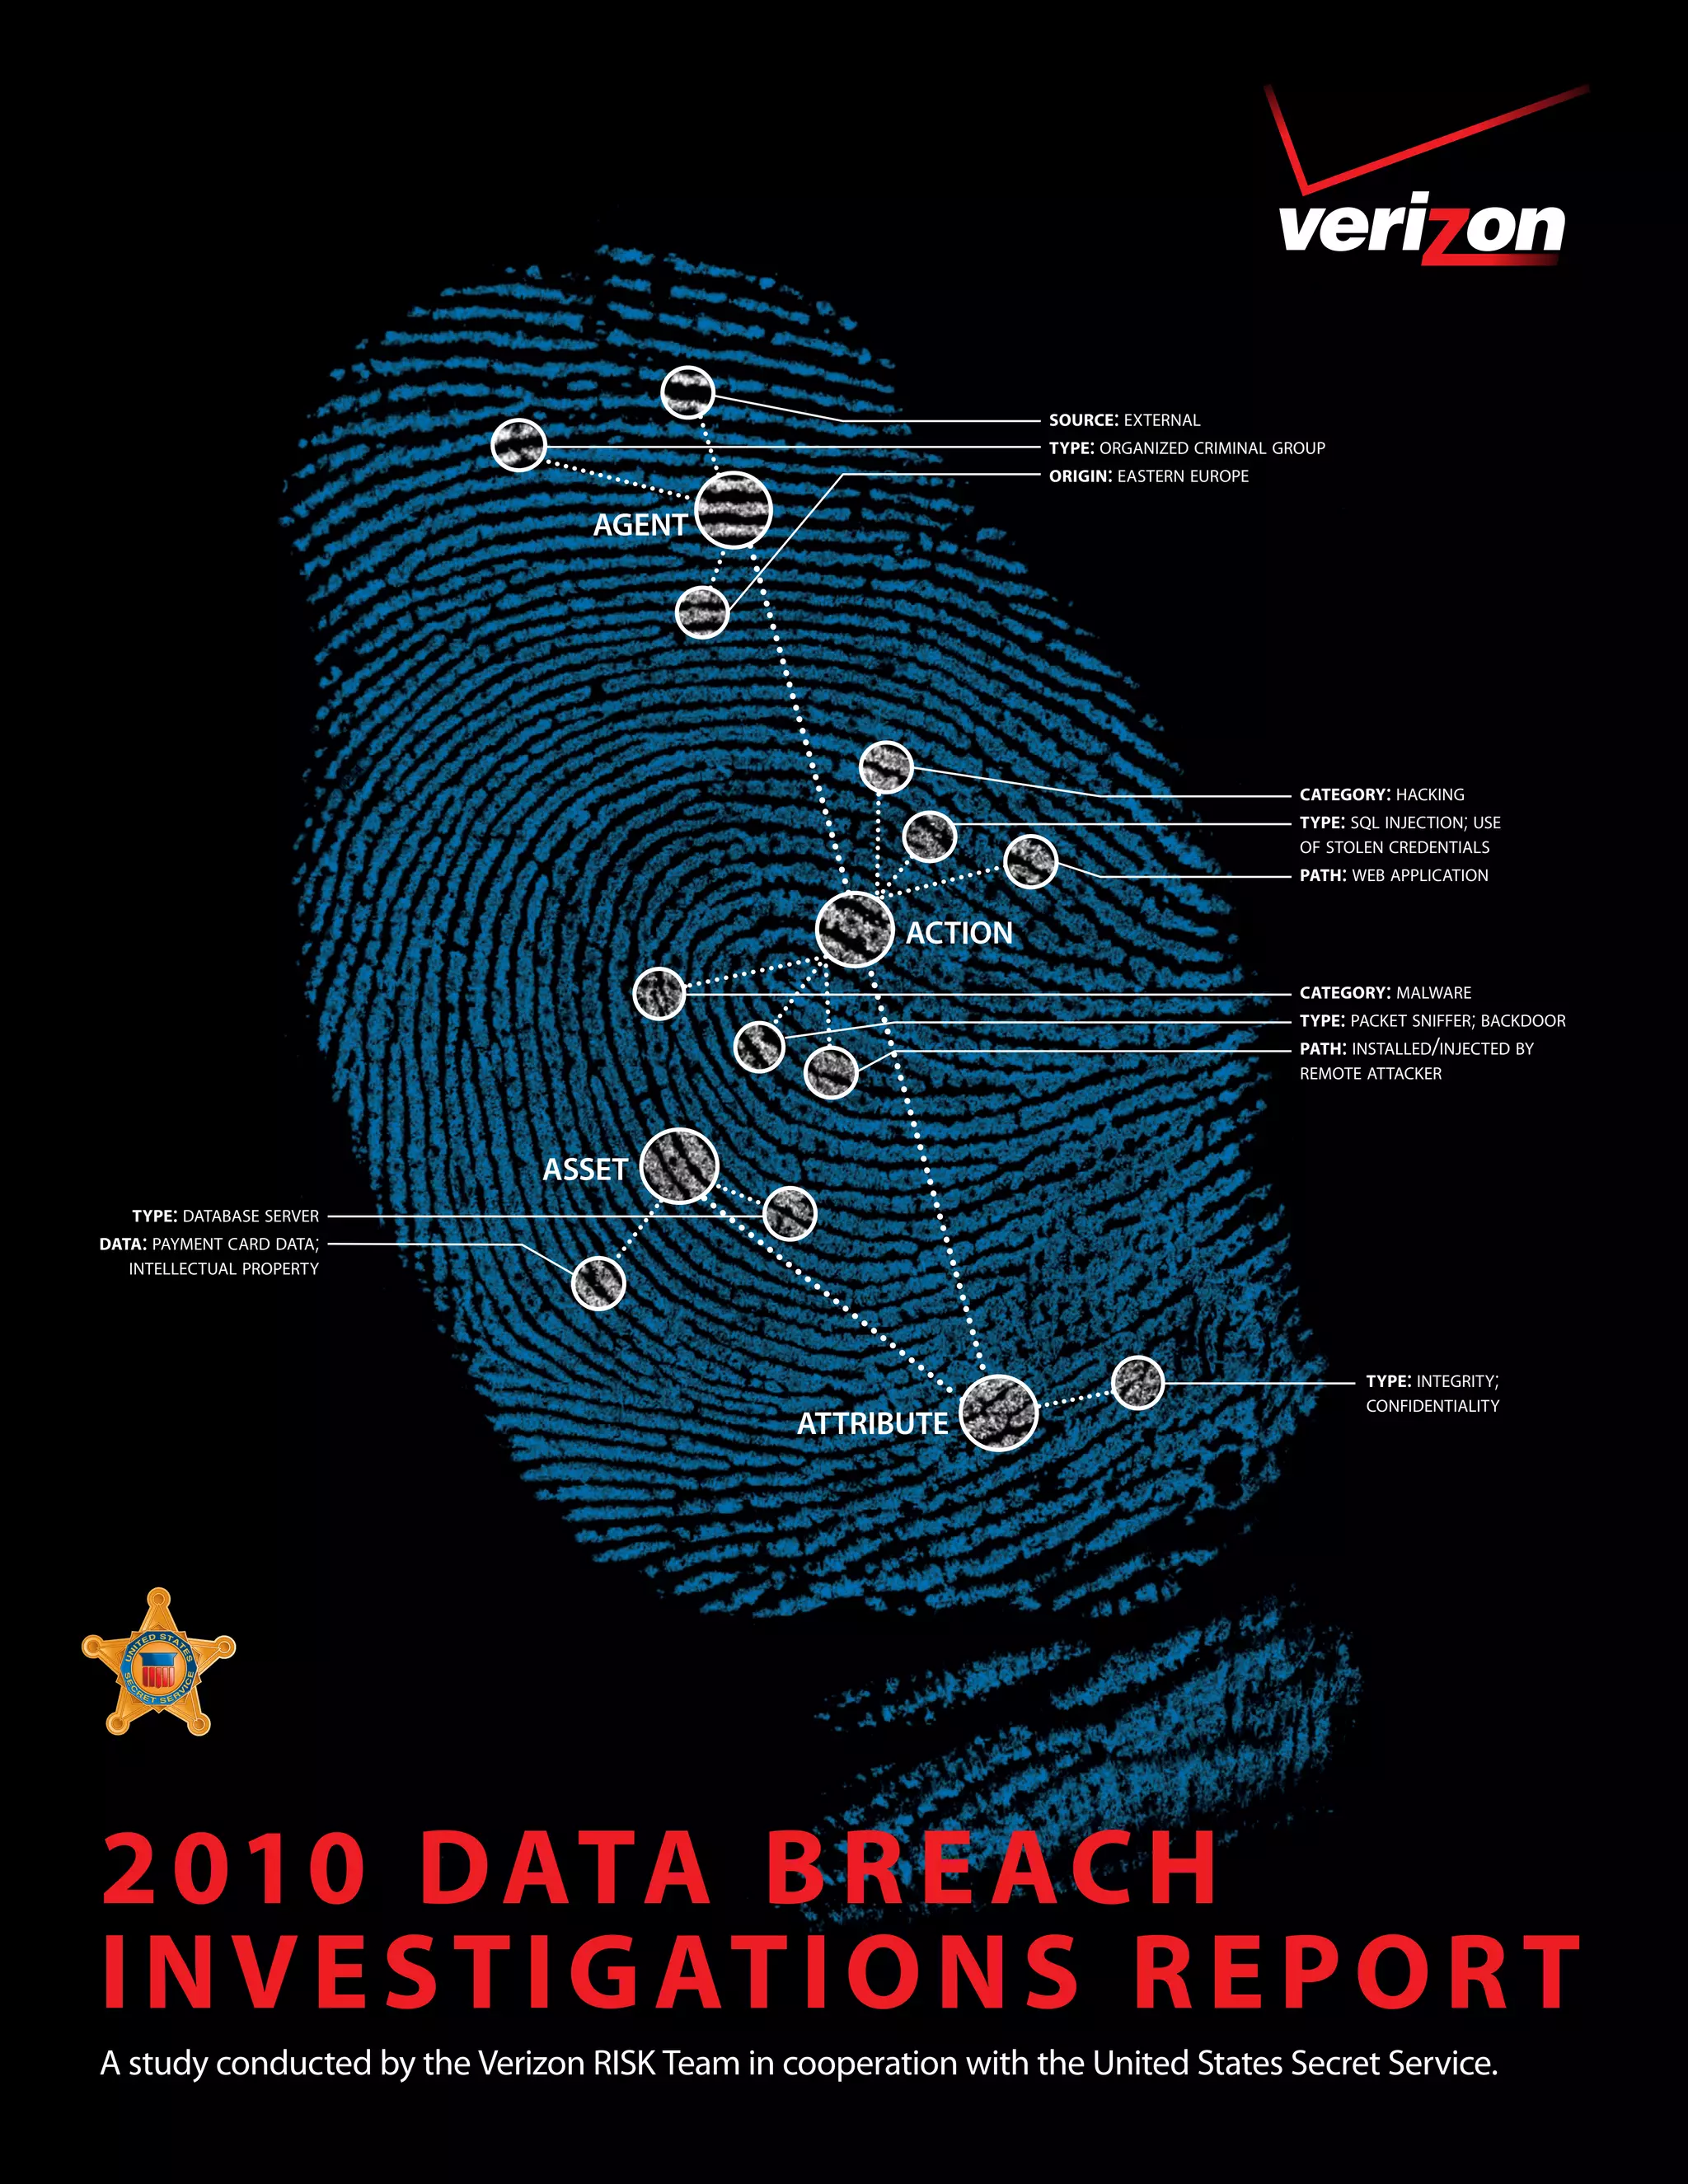
Eastern European organized criminal group hacked a database server to steal payment card data and intellectual property using SQL injection and stolen credentials. They installed malware like packet sniffers and backdoors on the server to extract the data over time. The 2010 Data Breach Investigations Report from Verizon and the United States Secret Service analyzed hundreds of data breaches from the previous year and found hacking by external actors to be the most common cause, with malware and stolen credentials frequently used to compromise servers and steal confidential information.


![2011 Data Breach Investigations[1]](https://cdn.slidesharecdn.com/ss_thumbnails/2011databreachinvestigations1-1303740328305-phpapp02-thumbnail.jpg?width=640&height=640&fit=bounds)


