Lundin Gold April 2024 Corporate Presentation v4.pdf
Alok industries -_icra
1. ICRA EQUITY RESEARCH SERVICE
ALOK INDUSTRIES LIMITED
Initiating Coverage Industry: Textiles September 19, 2011
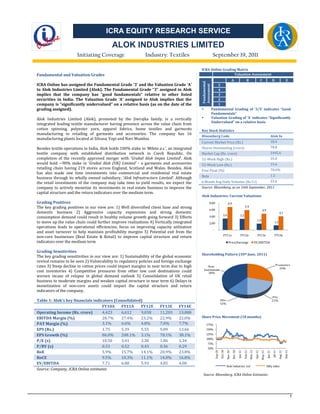
ICRA Online Grading Matrix
Fundamental and Valuation Grades Valuation Assessment
A B C D E
Fundamental
ICRA Online has assigned the Fundamental Grade ‘3’ and the Valuation Grade ‘A’ 5
Assessment
to Alok Industries Limited (Alok). The Fundamental Grade “3” assigned to Alok 4
implies that the company has “good fundamentals” relative to other listed 3
securities in India. The Valuation Grade ‘A’ assigned to Alok implies that the 2
company is “significantly undervalued” on a relative basis (as on the date of the 1
grading assigned). Fundamental Grading of ‘3/5’ indicates “Good
Fundamentals”
Alok Industries Limited (Alok), promoted by the Jiwrajka family, is a vertically Valuation Grading of ‘A’ indicates “Significantly
Undervalued” on a relative basis
integrated leading textile manufacturer having presence across the value chain from
cotton spinning, polyester yarn, apparel fabrics, home textiles and garments Key Stock Statistics
manufacturing to retailing of garments and accessories. The company has 16
Bloomberg Code Alok In
manufacturing plants located at Silvasa, Vapi and Navi Mumbai.
Current Market Price (Rs.) 18.4
Besides textile operations in India, Alok holds 100% stake in ‘Mileta a.s.’, an integrated Shares Outstanding (crore) 78.8
textile company with established distribution network in Czech Republic. On Market Cap (Rs. crore) 1445.6
completion of the recently approved merger with ‘Grabal Alok Impex Limited’, Alok 52-Week High (Rs.) 35.0
would hold ~90% stake in ‘Grabal Alok (UK) Limited’ - a garments and accessories 52-Week Low (Rs.) 15.6
retailing chain having 219 stores across England, Scotland and Wales. Besides, Alok 70.6%
Free Float (%)
has also made one time investments into commercial and residential real estate
Beta 1.2
business through its wholly owned subsidiary, ‘Alok Infrastructure Limited’. Although
the retail investments of the company may take time to yield results, we expect the 6 Month Avg Daily Volumes (Rs Cr) 22.6
company to actively monetize its investments in real estate business to improve the Source: Bloomberg, as on 16th September, 2011
capital structure and the return indicators over the medium term.
Alok Industries: Current Valuations
Grading Positives 8.00 6.9
The key grading positives in our view are: 1) Well diversified client base and strong 5.9
6.00 4.9
domestic business 2) Aggressive capacity expansions and strong domestic 4.1
3.4 3.3
consumption demand could result in healthy volume growth going forward 3) Efforts 4.00
1.9
to move up the value chain could further improve realizations 4) Vertically integrated 2.00 1.3
operations leads to operational efficiencies; focus on improving capacity utilisation
-
and asset turnover to help maintain profitability margins 5) Potential exit from the
FY11a FY12e FY13e FY14e
non-core businesses (Real Estate & Retail) to improve capital structure and return
indicators over the medium term Price/Earnings EV/EBITDA
Grading Sensitivities
Shareholding Pattern (30th June, 2011)
The key grading sensitivities in our view are: 1) Sustainability of the global economic
revival remains to be seen 2) Vulnerability to regulatory policies and foreign exchange
Promoters
rates 3) Steep decline in cotton prices could impact margins in near term due to high Non-
29%
Institutions
cost inventories 4) Competitive pressures from other low cost destinations could 38%
worsen incase of relapse in global demand outlook 5) Consolidation of UK retail
business to moderate margins and weaken capital structure in near term 6) Delays in
monetization of non-core assets could impact the capital structure and return
indicators of the company.
FIIs
Table 1: Alok’s key financials indicators (Consolidated) DIIs 21%
12%
FY10A FY11A FY12E FY13E FY14E
Operating Income (Rs. crore) 4,423 6,612 9,038 11,203 13,888
EBITDA Margin (%) 28.7% 27.4% 23.2% 22.9% 22.0% Share Price Movement (18 months)
PAT Margin (%) 3.1% 6.6% 4.8% 7.0% 7.7% 175%
EPS (Rs.) 1.75 5.39 5.55 9.89 13.66 150%
EPS Growth (%) 86.0% 208.1% 3.1% 78.1% 38.1% 125%
100%
P/E (x) 10.50 3.41 3.30 1.86 1.34
75%
P/BV (x) 0.53 0.52 0.43 0.36 0.29 50%
RoE 5.9% 15.7% 14.1% 20.9% 23.8%
Oct-10
Mar-11
Sep-10
Sep-11
May-11
Feb-11
Dec-10
Apr-11
Jan-11
Jul-11
Aug-11
Jun-11
Nov-10
RoCE 9.5% 10.3% 11.1% 14.0% 16.8%
EV/EBITDA 7.71 6.88 5.93 4.85 4.08
Alok Industries Ltd Nifty index
Source: Company, ICRA Online estimates
Source: Bloomberg, ICRA Online Estimates
1
2. ICRA Equity Research Service Alok Industries Limited
INVESTMENT SUMMARY
Diversified and integrated nature of operations with strong domestic business
Alok Industries : Revenue Break-up (FY11) Alok Industries : Revenue Break-up (FY11)
Garments Spinning &
3% Trading
9%
Exports
Sales %
Polyester 35%
26%
Domestic
Apparel Sales %
Home Fabric 65%
Textiles 47%
15%
Source: Company; ICRA Online Estimates
While the near term outlook for the domestic textile industry remains uncertain due to renewed fears of global
economic slowdown, volatility in cotton prices and exchange rate fluctuations; we expect the large diversified players
like Alok to be better placed due to integrated operations and relatively strong domestic business. Alok’s textile
operations are vertically integrated with in-house spinning, weaving, knitting, designing, processing and garmenting
units making it one of the few large scale organised players in India. For its apparel fabrics and home textiles segment,
backward integration into manufacturing of cotton yarn (spinning) and in-house processing of grey fabric for fashion
wear / technical textiles has enabled the company to garner higher operating margins. Apart from presence across the
cotton value chain, the company also has presence in synthetic fibre through its polyester texturising capacity,
backwardly integration into Partially Oriented Yarn (POY). Further, large scale of operations enables procurement
efficiency through bulk raw material purchases and diversified client base enables stable demand and better
realizations even during uncertain times.
Capacity expansions and strong domestic consumption demand could result in healthy revenue growth;
Improving capacity utilisation / asset turnover and focus on value-added products to maintain profitability
Alok is currently undergoing capacity expansions accoss its spinning, apparel fabric and home textiles segments.
Besides, we expect the company to aggressively expand its polyester yarn capacity from ~200,000 MTPA in FY11 to
~500,000 MTPA in FY12e and ~900,000 MTPA in FY14e; inorder to leverage upon the rapidly increasing manmade
fibre demand due to limited land availability for cultivation of natural fibres, high dependence on agro-climatic
conditions and higher domestic spending in the price sensitive rural markets. As a result, polyester division will
emerge as the largest revenue contributor for Alok with revenues increasing from 25% of Alok’s overall sales in FY11
to 42% of sales in FY14e. Overall, aggressive capacity expansions across business segments (more so in polyester
division) along with continuing strong domestic consumption demand are expected to result in a healthy 28% CAGR
in the consolidated revenues for the company over the FY11-FY14e period.
2
3. ICRA Equity Research Service Alok Industries Limited
Exhibit 1: Installed Capacities
Units FY09a FY10a FY11a FY12e FY13e FY14e
Spinning '000 MT 33.3 58.5 69.0 80.0 80.0 80.0
('000 Spindles) 252.1 300.1 343.8 411.8 411.8 411.8
Rotors 936 3,792 3,792 5,680 5,680 5,680
Apparel Fabrics
Processing Woven Mn. Mtrs 105.0 105.0 105.0 126.0 126.0 126.0
Weaving Mn. Mtrs 70.0 93.0 93.0 170.0 170.0 170.0
Knits '000 MT 18.2 18.2 18.2 25.0 25.0 25.0
Home Textiles
Processing Mn. Mtrs 82.5 82.5 82.5 105.0 105.0 105.0
Weaving Mn. Mtrs 47.0 68.0 68.0 92.0 92.0 92.0
Terry Towels '000 MT - 6.7 6.7 13.4 13.4 13.4
Polyester Yarn
Drawn Texturised yarn (DTY) '000 MT 77.0 114.0 114.0 170.0 170.0 170.0
Fully Drawn Yarn (FDY) '000 MT - - 70.0 70.0 70.0 70.0
Partially Oriented Yarn (POY) '000 MT 182.5 182.5 200.0 500.0 700.0 900.0
Garments Mn. Pcs. 15.0 22.0 22.0 22.0 22.0 22.0
Source: Company; ICRA Online Estimates
Although the company has industry leading operating margins, the company plans to further improve capacity
utilizations and optimise product portfolio by focusing on higher value-added products such as yarn-dyed fabrics and
technical textiles. Yarn-dyed fabrics are used in fashionable shirting / womenswear and command better prices than
its current range of products, while technical textiles owing to their specialised nature carry higher margins than the
conventional textiles. Besides, competition is relatively moderate in the technical textiles segment as there are few
established domestic players in this import dependent segment. In polyester yarn segment, Alok’s fresh capacity
additions are aimed at higher value-added yarns such as cationic, dope-dyed, bright and black-dyed yarns. Overall,
despite the steep correction in raw material prices, we expect the company to maintain ~34% EBITDA margins in
apparel fabrics, ~28% in home textiles and ~18% polyester segments. With increasing contributions from polyester
business, overall EBITDA margins are expected to decline by ~4% over the next three years, although the return
indicators are expected to improve considerably due to higher asset turnover and RoCEs in polyester segment.
Potential exit from the non-core businesses (Real Estate & Retail) could improve capital structure; return
indicators to get futher fillip from with increasing contribution from polyester segment
Alok had entered the real estate business and invested ~Rs. 1,500 crore in FY07 to take advantage of the real estate
boom witnessed during 2004-2008. These investments however did not yield desired results and the management is
now pursuing monetisation of these investments and exit the real estate business to improve the capital structure of
the company going forward. Besides, the retail ventures (‘H&A’ & ‘Store Twenty One’) too being B2C businesses have
different and complex business models from Alok’s core spinning, weaving, processing based B2B businesses. These
investments, although require significant management time and energy, currently contribute little to the overall
profitability. Hence, the management may look at exiting the retail ventures too at an appropriate time, inorder to
improve the financial profile and focus on the core profitable businesses of apparel fabrics, home textiles and
polyester yarn. Besides, the large capital expenditures incurred across segments over past five years are expected to
stabilize and improve the return indicators for the company going forward. Again, the overall return indicators are
expected to improve with increasing contribution from polyester segment, as the latter is less working capital
intensive and higher asset turnover (~2.5 times) in comparison to cotton based businesses (~0.5 times).
3
4. ICRA Equity Research Service Alok Industries Limited
Competition remains intense across segments; international competition could worsen incase of renewed
economic slowdown
In the apparel fabric segment, Alok is present in mid to premium segment where price competition pressures remain
high owing to fragmented nature of industry and consumer price consciousness in the domestic markets. In the home
textiles segment, Alok is mainly present in the exports markets (>95% revenues) where it continues to face stiff
competition from Chinese manufacturers with higher economies of scale and from manufacturers based out of other
low cost destinations like Pakistan. In the polyester yarn segment, domestically the company faces competition from
larger and fully integrated players like Reliance Industries; while internationally Alok faces stiff competition from
chinese manufacturers that account for close to 70% of global production capacity. While increasing domestic
demand, rising finance cost and reducing labour cost arbitrage in China are likely to aid long-term prospects for
leading Indian manufacturers like Alok; faultering global economic growth and weakening discretionary spendings
could intensify competitive pressures due to lower capacity utilizations over the near term.
Exhibit 2: Intense competitive pressures across segments
Key Segments Key Competitors
Competitors from the organized segment include Arvind Mills, Vardhman Textiles, Nahar
Apparel Fabrics
Industrial Enterprises and Bombay Rayon Fashions
Abhishek Industries, Indo Count Industries, Himatsingka Seide, Bombay Dyeing and Welspun
Home Textiles India are some of the major Indian players in the bed linen segment.
Stiff competition with manufacturers based out of China and Pakistan
Competition from established domestic players like Reliance Industries, JBF Industries, Indo
Rama Synthetic, Garden Silk Mills, Futura Polyesters and Century Enka
Polyester Yarn
Competition from Chinese polyester yarn manufacturers that dominate the global polyester
market with ~ 70% market share
Source: Company; ICRA Online Estimates
Besides, the merger of Grabal Alok Impex Ltd and thereby consolidation of Grabal Alok UK (retail business)
could moderate margins and weaken capital structure at the consolidated level
Exhibit 3: Estimated Merger Impact Alok’s board of directors have recently approved the
FY12e proposal for amalgamation of Grabal Alok Impex Limited
Alok (Ex Grabal Alok UK) (GAlok), engaged in manufacturing wide range of
Revenues (Rs Cr) 8,012 embroidered fabrics. GAlok had reported ~Rs. 235 crore
EBITDA (Rs Cr) 2,057 revenues with ~21% EBITDA margins in FY11. Besides,
EBITDA Margin (%) 25.7% since GAlok holds 48.7% in Grabal Alok (UK) Limited
(GAUKL), Alok’s effective shareholding in this UK based
Grabal Alok UK retail chain will increase from ~41.3% to ~90%, making it a
Revenues (Rs Cr) 1,026
subsidiary of Alok Industries.
EBITDA (Rs Cr) 41
EBITDA Margin (%) 4.0%
We expect the consolidatation of GAUKL to adversely impact
the financials of Alok industries in near term, as the retail
Alok (Consolidated)
chain has recently achieved EBITDA breakeven and is yet to
Revenues (Rs Cr) 9,038
EBITDA (Rs Cr) 2,098 breakeven at net profit levels. Considering the weak outlook
EBITDA Margin (%) 23.2% for retail sales in UK, we have assumed ~9% revenue growth
and ~4% EBITDA margins for GAUKL in FY12e. Overall, the
EBITDA Margin Impact -2.5% merger is expected to reduce the consolidated EBITDA
Source: Company; ICRA Online Estimates margins by ~2.5% and weaken the capital structure by
additional debt burden of ~Rs. 600 crore, in the near term.
4
5. ICRA Equity Research Service Alok Industries Limited
Valuation seems quite attractive even after factoring the near term headwinds
Despite the near term headwinds faced by the textile industry, Alok’s current valuation multiples (~3.3 times FY12
earnings, ~0.43 times FY12 book value) seems quite attractive considering Alok’s integrated and diversified business
model with lower dependence on textile exports. The valuation multiples are are expected to further moderate
rapidly from the FY12e levels due to strong earnings growth over the next three years contributed by large capacity
additions and improvement in the capital structure through exit from non-core businesses. Overall, we expect the
company to report a robust 28% CAGR revenue growth and 36% CAGR EPS growth over the FY11a-FY14e period,
aided by robust capacity expansions and healthy domestic consumuption demand going forward. Hence, we assign a
valuation grade of “A” to Alok on a grading scale of ‘A’ to ‘E’, which indicates that the company is “significantly
undervalued” on a relative basis.
Exhibit 4: Relative Valuations Vs Equity Indices:
Alok NIFTY CNX 500 CNX MIDCAP
ICRA Estimates
Industries Ltd INDEX INDEX INDEX
FY12E FY13E FY12E FY13E FY12E FY13E FY12E FY13E
Price/Earnings 3.30 1.86 13.98 11.88 13.27 11.09 11.31 9.39
EV/EBITDA 5.93 4.85 9.48 8.22 9.35 7.92 9.70 7.91
Price /Sales 0.16 0.13 1.58 1.43 1.30 1.16 0.82 0.74
Price /Book Value 0.43 0.36 2.32 2.03 2.09 1.81 1.51 1.31
Price/Cash Flow 1.36 0.99 10.26 8.85 9.53 8.00 7.01 5.76
Source: Bloomberg, ICRA Online Estimates * Bloomberg Consensus Estimates as on 16th September, 2011
Exhibit 5: Relative Valuations Vs Industry Peers:
Alok S. Kumars JBF Provogue Vardhman
ICRA Estimates
Industries Ltd Nationwide Ltd Industries Ltd (India) Ltd Textiles Ltd
FY12E FY13E FY12E FY13E FY12E FY13E FY12E FY13E FY12E FY13E
Price/Earnings 3.30 1.86 3.61 2.43 2.68 2.21 7.96 6.85 3.49 3.38
EV/EBITDA 5.93 4.85 3.94 3.32 3.24 2.88 10.87 9.39 4.57 4.77
Price /Sales 0.16 0.13 0.23 0.19 0.13 0.12 0.57 0.51 0.28 0.29
Price /Book Value 0.43 0.36 0.44 0.36 0.57 0.49 0.46 0.43 0.45 0.41
Price/Cash Flow 1.36 0.99 2.69 NA 1.85 1.62 5.69 4.89 1.89 1.90
Source: Bloomberg, ICRA Online Estimates * Bloomberg Consensus Estimates as on 16th September, 2011
5
6. ICRA Equity Research Service Alok Industries Limited
OPERATING PROFILE
Snapshot:
One of the largest integrated textile companies in India with presence across the value chain from cotton spinning
to manufacturing polyester yarn, apparel fabrics, home textiles and ready-made garments. The company has 16
manufacturing plants located at Silvasa, Vapi and Navi Mumbai.
Besides, Alok holds 100% stake in Mileta a.s., an integrated textile company with established distribution network
in Czech Republic and will hold ~90% stake in Grabal Alok UK Ltd., a leading garments and accessories retailing
chain having 219 stores across England, Scotland and Wales.
Alok also made onetime investments into commercial and residential real estate business through its wholly
owned subsidiary, Alok Infrastructure Limited.
Alok’s textile operations comprise of five divisions that span the entire textile value chain. The company is vertically
integrated with in-house spinning, weaving, processing and garmenting units making it one of the few large scale
integrated and organised players in India. Besides, the company, through its subsidiaries and joint ventures have
entered into retailing of garments and accessories as well as real estate construction businesses. The table below
gives break up of operating revenues and EBITDA margins by business segment on consolidated basis:
Exhibit 6: Segment-wise revenues and margins
Revenues (Rs Cr) FY08a FY09a FY10a FY11a FY12e FY13e FY14e
Spinning & Trading 294 111 327 574 402 409 430
Apparel Fabric 895 1,610 1,943 2,967 3,107 3,585 4,008
Home Textiles 389 499 707 986 1,087 1,263 1,442
Polyester 493 619 1,193 1,664 2,592 3,905 5,864
Garments 100 139 141 175 175 191 210
Others 123 136 111 212 1,675 1,849 1,936
Total 2,294 3,113 4,423 6,578 9,038 11,203 13,888
Revenues Contributions (%) FY08a FY09a FY10a FY11a FY12e FY13e FY14e
Spinning & Trading 13% 4% 7% 9% 4% 4% 3%
Apparel Fabric 39% 52% 44% 45% 34% 32% 29%
Home Textiles 17% 16% 16% 15% 12% 11% 10%
Polyester 21% 20% 27% 25% 29% 35% 42%
Garments 4% 4% 3% 3% 2% 2% 2%
Others 5% 4% 3% 3% 19% 17% 14%
Total 100% 100% 100% 100% 100% 100% 100%
EBITDA Contributions (%) FY08a FY09a FY10a FY11a FY12e FY13e FY14e
Spinning & Trading 5% 1% 3% 4% 2% 2% 1%
Apparel Fabric 54% 66% 56% 57% 50% 47% 44%
Home Textiles 22% 19% 20% 16% 15% 14% 13%
Polyester 16% 13% 18% 17% 22% 27% 33%
Garments 3% 3% 3% 2% 2% 1% 1%
Others -1% -2% 0% 4% 9% 9% 7%
Total 100% 100% 100% 100% 100% 100% 100%
Source: Company; ICRA Online Estimates
6
7. ICRA Equity Research Service Alok Industries Limited
Spinning / Cotton Trading Divison
Snapshot:
Alok’s Cotton Spinning business has lower revenue contribution (~9% in FY11a) as 80-85% cotton yarn
manufactured is utilized for captive consumption by the fabric and home textiles divisions of the company.
Alok has the largest spinning facility in India at a single location (Silvassa); further capacity expansion planned
from 343,840 to 441,840 spindles (58,750 tons) and 3,792 to 5,424 rotors (20,210 tons) in FY12 to support
expansions at the in-house weaving and knitting capacities in the fabric and home textiles segment
Procurement of raw cotton in bulk and during harvest remains crucial to the division’s overall profitability; steep
volatility in cotton prices driven by global demand-supply scenario could squeeze operating margins
Cotton Trading business remains opportunistic as it gains from temperory mispricings in the market, however
EBIDTA margin remain lower due to the trading nature of business
Lower revenue contribution as 80 to 85% of cotton yarn produced is used for captive consumption; EBIDTA
margins lowered by cotton trading activity
Alok has an in-house spinning unit for cotton yarn, which not only mitigates the risk of reliance on outside supplier
but also enhances margins through the value chain. Besides, the division also trades in raw cotton and cotton yarn to
leverage upon the managment’s deep understanding of domestic and international demand-supply conditions and
gain from temperory mispricings seen the market.
In FY11, the spinning and cotton trading division accounted for Rs. 574 crore or ~9% of operating income for the
company. Volumes and hence revenue generated by spinning & cotton trading activity increased by ~75% in FY11,
primarily on account of low base effect in the previous years and increase in cotton trading activity to encash upon the
rise in cotton prices in the open market.
Exhibit 7: Spinning & Cotton Trading Division – Key Operating Indicators
Product mix Compact yarn, dyed yarn, blended yarn and organic cotton from coarse to fine counts
Primarily captive consumption by fabric and home textiles division (~75 to 80%)
Target segment 18 to 25% of cotton yarn production is sold to traders, distributors and manufacturing units in
the domestic as well as export markets
Highlights Largest capacity at a single location in India (Silvassa)
Volatility in raw cotton costs due to uncertain demand-supply situation
Industry Scenario Sustained high prices could result in further substitution by polyester
Steep fall could result in company left holding high cost inventories
The company does not generate significant revenue from sale of cotton yarn as large part of the
produce is utilized for captive consumption.
Competition Cotton trading operations of the company are opportunistic, primarily to benefit from spurt in
cotton prices and the company remains a very small player in the said segment.
Thus competition from other spinning mills and cotton traders is not applicable to the company
44,980 tons ring spun yarn (343,840 spindles)
Current Capacity
13,520 tons open-ended yarn (3,792 rotors)
Capacity expansion for ring spun yarn to 58,750 tons (411,840 spindles) and open-ended yarn
to 22,250 tons (5,680 rotors) at total cost of Rs. 400 crore in a phased manner till FY12.
Future plans Expansion to be funded through term loans Rs. 315 crore and internal accruals of Rs. 85.0 crore.
Expanded capacity too will be used primarily for captive consumption for fabric and home
textiles segment
Source: Company; ICRA Online Research
7
8. ICRA Equity Research Service Alok Industries Limited
Bulk buying during harvest season leads to high inventories risks; however, trading operations gains in case
of favourable price movements
Alok mitigates the risk of cotton price fluctuations to an extent by purchasing cotton in bulk quantities during the
buying season; when the quality, availability and costs are favourable. Alok procures raw cotton from the open
market, primarily from states of Gujarat, Maharshtra and Andhra Pradesh; though there are no long-term contracts. It
maintains an average nine months inventory of raw cotton primarily for yarn manufacturing resulting in high
inventory holding period. In rising cotton price scenario, the company gains as the benefits of low cost inventory may
not be completely passed on to the customers; however the situation reverses and margins decline if the raw cotton
prices fall steeply in short duration leading to high cost inventories.
Capacity expansions to aid growth in spinning reveneus in FY12, Cotton trading revenues and margins are
expected to moderate after a strong performance over the last two years
Alok is expanding its spinning capacity for manufactring ring-spun yarn to 58,750 tons (411,840 spindles) and open-
ended yarn to 22,250 tons (5,680 rotors) at total cost of Rs. 400 crore in a phased manner till FY12. The expanded
capacities too are expected to be used primarily for captive consumption, while open market sales may continue upto
the tune of ~10-15% annually. Besides, we expect the growth in cotton trading revenues and overall margins for the
division to moderate marginally, after a strong performance over the last two years.
Exhibit 8: Spinning & Cotton Trading Division – Key Financial Indicators
Key Estimates FY09a FY10a FY11a FY12e FY13e FY14e
Spinning Capacity MT 33,300 58,500 69,040 80,000 80,000 80,000
Cotton Yarn Sales* MT 8,348 10,259 10,356 9,600 8,000 8,000
Cotton Yarn Revenues* Rs Cr 59.1 71.6 101.1 70.3 61.5 64.6
Growth % 21% 41% -30% -13% 5%
Trading Revenues Rs Cr 52.0 255.5 473.2 331.2 347.8 365.2
Growth % 392% 85% -30% 5% 5%
Total Revenues Rs Cr 111.1 327.1 574.3 401.6 409.3 429.8
Growth % 194% 76% -30% 2% 5%
Source: Company; ICRA Online Research * Cotton Yarn Sales refers to open market sales post captive consumption
8
9. ICRA Equity Research Service Alok Industries Limited
Fabric Division
Snapshot:
Key business segment for the company contributing ~45% to revenues and ~57% to EBDITA in FY11
One of the largest and most profitable fabric manufacturer in the country with revenues of ~Rs. 2,967 crore and
EBITDA of Rs. 1,080 crore in FY11
Higher value addition through processing of grey fabric, with inputs from in-house designing team, differentiates
the company’s fashion wear and technical textile product range; presence in high-end fabric effectively eliminates
competition from unorganised market
Growth momentum to continue going forward due to the planned increase in annual weaving capacity to 170.0
million meters, knitting capacity to 25,000 MT and processing capacity to 126.0 million meters by FY12
While the dependence on the fabric division is expected to reduce going forward in the wake of large capacity
enhancement in the polyester division, it is estimated to remain the largest EBIDTA generating segment for Alok
Exhibit 9: Fabric Division – Key Operating Indicators
Diversified product mix with cotton / cotton blends of yarn-dyed / piece-dyed fabrics in knits /
Product mix
woven for daily wear, fashion wear, industrial or technical textiles
Garment converters in India who in turn sell in the domestic as well as export markets
Wholesalers, retailers and traders in the domestic market
Target segment
Garmenting companies and large format retailers in export market
Institutions/corporate customers for technical textiles
One of the largest players in the apparel fabric segment
Alok’s largest revenue segment (47% of FY 11 sales) with high EBDITA margin of 36% on account of
Highlights
in-house spinning, designing and processing capacities; increasing share of value added fabric range;
diversified and quality conscious customer base
India’s fabric production was estimated at 54,966 million sq. meters in 2009, strong growth in recent
years as the Indian fabric industry is becoming increasing more competitive globally
Industry Scenario
The current market size for technical textiles in India is estimated at close to Rs. 40,000 crore with
demand estimated to grow at 11% CAGR to reach about Rs. 66,000 crore by FY 2013
The unorganized / largely fragmented nature of industry makes estimation of market share difficult
Competition Competitors from the organized segment include Arvind Limited, Vardhman Textiles, Nahar
Industrial Enterprises and Bombay Rayon
Processing Capacity of 105.0 million meters
(segregated into three continuous processing lines and one batch processing line)
Current Capacity
Weaving capacity of 93.0 million meters (808 weaving looms)
(p.a.)
Knitting capacity of 18,200 tones
Yarn Dyeing Capacity of 5,000 tones
Processing capacity – 126.0 million meters
Weaving capacity – 170.0 million meters
Future plans
Knitting capacity – 25,000 tones
(capacity p.a.)
Capacity expansion to be completed in FY12 at an estimated cost of Rs. 225.0 crore through external
debt (~80%) and internal accruals (~20%)
Source: Company; ICRA Online Research
9
10. ICRA Equity Research Service Alok Industries Limited
One of the largest fabric manufacturer in India with high end processing capabilities
Alok, one of the largest player in the apparel fabric segment, has presence in yarn-dyed fashion wear fabrics and
technical textile fabrics. The company has an in-house weaving capacity of close to 93.0 million meters (to be
increased to 170.0 mn meters) per annum and knitting capacity of 18,200 tones (to be increased to 25,000 tonnes)
per annum. Entire processing of grey fabric (output from weaving and knitting operations) is carried out at its in-
house facility at Vapi which has an annual processing capacity of 105.0 million meters (to be increased to 126 Mn
meters) per annum. The value addition through processing of grey fabric and the company’s in-house designing team
are crucial high margin generators and differentiator for the company’s fashion wear and technical textile product
range. Besides, Alok has benefited in terms of technology absorption for high-quality yarn-dyed fabrics, which are
used for fashionable shirting and high end women’s wear and command premium prices in the market, through its
acquisition of Mileta.
High competitive pressures due to fragmented nature of industry and price consciousness in the domestic
markets; however, presence in value-added fabrics mitigates competition from the unorganised segment
In the apparel fabric segment, Alok is present in mid to premium segment where price competition pressures remain
high owing to fragmented nature of industry and consumer price consciousness in the domestic markets. Alok
competes with organised players like Vardhaman, Arvind, JCT, Nahar Industries and Bombay Rayon. However,
presence in value-added fabrics mitigates competition from the unorganised players that mainly cater to the
commodity fabric or the economy end of the fabric segment. Current installed weaving and processing capacities of
some of the major competitors is given below:
Exhibit 10: Fabric Division – Competitve Scenario
Company Installed capacity (FY10) Actual production (FY10)*
Weaving Capcity: 93 million meters
(808 weaving looms)
192.3 million meters of woven fabric
Alok Industries Limited Knitting Capacity: 18,200 tonnes
7,200 tons of knitted fabric
Processing Capacity: 105 million
meters
Weaving capacity: 52.8 million
meters (with 453 looms) 83.5 million meters of grey and processed
Nahar Industrial Enterprises
Processing Capacity: 58.4 million fabric
meters
Weaving Capacity: 34 million
meters of woven shirting fabric, 21
29 million meters of woven fabric
Arvind Limited million meters of Khakhi fabric, 33
38 MT of grey fabric
million meters of voiles
Knitting Capacity: 10,000 tonnes
Weaving Capacity: 82 million
meters of fabrics (900 looms)
Vardhman Textiles Limited 108 million meters processed fabric
Prcessing Capacity: 90 million
meters
Weaving Capacity: 220 million 78.2 million meters (large part of capacity was
Bombay Rayon Fashions
meters under commissioned in FY10)
Source: Company Websites; ICRA Online Research *Actual production includes production through third party contractors outsourced production)
10
11. ICRA Equity Research Service Alok Industries Limited
Technical textiles to gain focus in wake of increasing demand and potential for higher EBIDTA margin
Unlike conventional textile industry, the technical textile industry (market size estimated to reach Rs. 66,000 crore by
FY13e) is an import intensive industry with few companies in India having expertise to manufacture speciality fabrics
such as fire retardant fabric, water repellent, soil release fabric and high visibility fabric. These are widely used in
industrial, aerospace, military, marine, medical, construction, transportation and high technology applications. Alok is
in talks with several international players for technology tie-ups and plans to considerably increase exposure to this
segment to gain from the lower competitive pressures and garner higher margins from the same.
Reputed and diversified customer base helps mitigate client specific risks; strong backward integration helps
minimize the impact of yarn price fluctuations
The apparel fabric division has a highly diversified and reputed customer base which includes garmenting companies
like Shahi Exports and Madura Garments in domestic market (~65-70%), garmenting companies in international
market (~15-20%), institutional sales to armed forces and government organisation (~5-7%) and work wear or
technical textiles (~5-10%). The company manufactures fabric primarily against orders which helps mitigate the risk
of unsold inventory, while the pricing takes into account prevailing market price of raw material (yarn) and foreign
currency rate for exports. Besides, strong backward integration with in-house cotton and polyester yarn production
helps minimize the impact of any adverse fluctuations in yarn prices.
Strong revenue growth expectations on account of healthy domestic demand and capacity augmentation;
margins expected to be maintained through migration to high value-added and fashion fabrics
The apparel fabric division has witnessed strong growth over the years driven by increase in volumes on the back of
healthy demand and capacity augmentation. The segment generates EBDITA margin of close to 36% on account of
backward integration into yarn production, high-end processing and increasing presence in the fashion wear and
technical fabric. Going forward, the shifting production base to Asian countries like India, along with increasing
demand for higher quality fashion apparel and ready-to-wear apparels in India, is likely to benefit established textile
majors like Alok. Besides, the focus on technical textiles along with increasing share of yarn-dyed fashion wear fabrics
is likely to drive realizations and revenue growth for the company. Operating margins too are estimated to remain
strong despite volatile raw material prices as the company, being a large integrated player, benefits from economies of
scale and has demonstrated its ability to pass on increase in input costs to its customers. Overall, we expect the
division to report ~11% CAGR revenue and 34-35% EBITDA margins over the FY12e-FY14e period.
Exhibit 11: Fabric Division – Key Financial Indicators
Key Estimates FY09a FY10a FY11a FY12e FY13e FY14e
Installed Capacities
Processing Woven Mn Mtrs 105 105 105 126 126 126
Weaving Mn Mtrs 70 93 93 170 170 170
Knits MT 18,200 18,200 18,200 25,000 25,000 25,000
Production
Woven fabrics Mn Mtrs 168 205 240 275 306 331
Knitted fabric MT 6,693 6,802 9,135 12,789 16,625 19,950
Total Revenues Rs Cr 1,610 1,943 2,967 3,107 3,585 4,008
Growth % 21% 53% 5% 15% 12%
Source: ICRA Online Research
11
12. ICRA Equity Research Service Alok Industries Limited
Home Textiles Division
Snapshot
Home Textiles division accounted for ~15% of overall revenues and 16% of EBITDA in FY11; Integrated
operations & presence in mid-premium export segment enables high margins (31% EBITDA margin in FY11)
Alok is mainly present in the exports markets (>95% revenues) where it continues to face stiff competition from
Chinese manufacturers with higher economies of scale and from manufacturers based out of other low cost
destinations like Pakistan
Presence in the relatively high end home textiles (300 to 500 counts product category) enable higher price
realisation and helps mitigate competition from other low cost manufacturing locations and domestic companies
Established and reputed multinational clientele results in strong customer profile; periodic pricing resets to
protect marings in case increase in input costs
Integrated operations with spinning / processing capabilities enables better control over product quality
Planned increase in processing capacity to 105.0 million meters and terry towel capacity to 13,400 MT to drive
revenue growth going forward
Exhibit 12: Home Textiles Division – Key Operating Indicators
Alok produces wide range of bed sheets sets, comforters, blankets, quilts, curtains and terry towels. Bed sheets
Product mix
account for close to 80% of the division’s sale while bed spreads and terry towel account for 10% each
Export to overseas retailers and brands like Walmart, J.C. Penny, Kohl and Target (exports accounting for ~
Target
95% of overall division’s sales and 45% of total exports of Alok)
segment
Domestic retailers and brands
Largest Indian player in export of bed sheets (Received various export awards from Government of India)
Top five player for terry towels
Highlights
Strong integration with Alok’s spinning division, which supplies close to 80% of its raw material (cotton
yarn) requirement and in-house processing unit enabling control over end product quality
Home Textiles segment is estimated at around US$ 22 - 27 billion, accounting for 5-6% of the total global
textile market
Industry
India currently the largest supplier of terry towels and bed sheets
Scenario
Spend on home textiles is price sensitive in nature with demand vulnerable to economic slowdowns;
however, demand may shift to lower value segment within home textiles
Abhishek Industries, Indo Count Industries, Himatsingka Seide, Bombay Dyeing and Welspun India are some
Competition of the major Indian players in the bed linen segment.
Stiff competition with manufacturers based out of China and Pakistan
Bed sheets – 17.5 million pieces
Current Processing - 105.0 million metres
Capacity Weaving - 68.0 million metres
Terry towels - 6,700 tons
Capacity expansion for processing of fabric to 105.5 million meters, weaving of fabric to 93.0 million metres
and terry towels to 13,400 tons at a cost of Rs. 175.0 crore, to commissioned by FY12.
Future plans
The capacity expansion will be funded through Rs. 140.0 crore external debt & balance through internal
accruals
Source: Company Websites; ICRA Online Research
12
13. ICRA Equity Research Service Alok Industries Limited
Largest home textiles exporter from India with significant presence in high count bed sheets and terry towels
Alok is the largest manufacturer and exporter home textiles from India with Rs. 986 crore in sales in FY11, growing at
36% CAGR over the last three years on account of increase in capacities, diversification in product mix and improved
realisation per unit on account of higher value add products. The product mix consists of 80% bed sheets, while 10%
is bed spreads and rest are terry towels. Around 10% of terry towel products of Alok are yarn-dyed providing higher
margins while the rest is solid or piece dyed. Alok has limited presence in the domestic market mainly consisting of
economy segment (less than 300 thread counts) and dominated by large number of unorganised players. The
company mainly focuses on export markets (>95% of products are exported) with 300 to 500 thread count products,
where competition is moderate and realizations / margins are relatively higher.
Stiff competition from other low cost destinations; however, presence in the relatively higher count helps
mitigate competition
In the home textiles segment, Alok is mainly present in the exports markets (>95% revenues) where it continues to
face stiff competition from Chinese manufacturers with higher economies of scale and from manufacturers based out
of other low cost destinations like Pakistan. However, presence in the relatively high-end home textiles (300 to 500
counts product category) enable higher price realisation and helps mitigate competition from other low cost
manufacturing locations and domestic companies (products from Pakistan are estimated at 8-12 USD/unit FOB value
while that from Alok are priced at 15-20 USD/unit). Besides, the shift in procurement strategy of large global retailers
from high cost US / European destinations to low cost destinations like India and increasing demand for textile
products in China’s domestic market augurs well for the large Indian players like Alok. The installed capacity of
certain organised players is given below:
Exhibit 13: Home Textiles Division – Competitive Scenario
Company Installed Capacity (p.a)
Hanung Toys & Textiles Bed Sheets - 6.85 million pieces
Bed Sheets - 2.96 million Pieces, Weaving Capacity - 15.7 million metres, Processing Capacity - 20.9
Himatsingka Seide
million metres
Abhishek Industries Terry Towels -41,500 tons
Bed Sheets - 17.5 million pieces, Terry towel - 6,700 tons
Alok Industries
Weaving capacity – 92.0 million meter and processing capacity – 105.0 million meters
Welspun Industries Weaving capacity – 45.0 million metres, Terry Towel - 41,500 tons
Source: Company Websites; ICRA Online Research
Established and reputed multinational clientele results in strong customer profile; periodic pricing resets to
protect marings in case increase in input costs
The customer portfolio for the home textiles division includes retail giants like Walmart, Target, Kohl’s and JC Penney
in the export market and Pantaloons in the domestic market. The client portfolio for the company is quite diversified,
with top four to five customers accounting only 40% of revenues for the division. In terms of geographies North &
South American markets comprise ~80% of the total sales, Europe contributing ~15% and domestic customers
accounting for balance 5% of the segment’s revenue. Besides, ~95% of products are sold as private labels in these
markets and only 5% are sold as branded products.
13
14. ICRA Equity Research Service Alok Industries Limited
The company’s customer base consists primarily of organised retailers in the US and European market, where average
spend on and replacement of home textile products is relatively higher than that in the other parts of the world, thus
making it a steady business for retailers. This generates steady order book for large integrated companies like Alok
who can deliver large quantities of higher value add home textile products at reasonable rates and meeting stiff
delivery schedules. Besides, the company has volume-based contracts with its customers where prices are negotiated
every three months based on the input (cotton yarn) prices, thus allowing Alok to hedge its raw material risk.
Capacity enhancements to drive volume growth going forward; however, realizations and margins remain
vulnerable due to significant uncertainities in global demand outlook over the near term
Alok is expanding its Terry Towels capacity, a relatively new segment for the company, from 6,700 MT to 13,400 MT
in FY12. Besides, the company is increasing its in-house weaving capacity from 68.0 to 92.0 million meters per annum
and processing capacity from 82.5 to 105.0 million meters per annum in FY12, inorder to maintain the quality of
finished product. While capacity enhancements are expected to result in robust volume growth going forward, we
expect the operating margins of the division to remain vulnerable to renewed uncertainities over global demand
outlook in the near term. The revenue growth could also be impacted by declining cotton prices and resulting lower
realisations.
However, we expect the price corrections to be buffered by presence in higher count products and high value addition
(i.e. lower raw material costs / realizations) by the division. Besides, the impact on operating margins are expected to
be somewhat mitigated by operating efficiencies resulting from higher economies of scale, integrated nature of
operations, high-end designing capabilities and diversified client base of the company. Overall, we have assumed the
contribution from terry towels to increase to from ~10% in FY11 to ~20% in FY14e and the division to report ~13%
CAGR revenue and 28-29% EBITDA margins over the FY12e-FY14e period.
Exhibit 14: Home Textiles Division – Key Financial Indicators
Key Estimates FY09a FY10a FY11a FY12e FY13e FY14e
Installed Capacities
Processing Mn. Mtrs 82.5 82.5 82.5 105 105 105
Weaving Mn. Mtrs 47 68 68 92 92 92
Terry Towels MT 0 6700 6700 13400 13400 13400
Production
Made-ups '000 Sets 4,073 4,948 5,690 6,401 7,041 7,569
'000
Made-ups 2,456 3,737 4,297 4,835 5,318 5,717
Pieces
Terry towels MT - 1,703 2,555 3,704 5,186 7,001
Total Revenues Rs Cr 499 707 986 1087 1263 1442
Growth % 42% 39% 10% 16% 14%
Source: ICRA Online Research
14
15. ICRA Equity Research Service Alok Industries Limited
Polyester Yarn Division
Snapshot
Polyester Yarn division is the second highest revenue generating segment, with close to 25% revenue
contribution and 17% EBITDA contribution in FY11, the division is expected to become highest revenue
contributor by FY14e on the back of large capacity enhancement being undertaken by the company
Demand scenario likely to remain robust due to increasing substitution of natural fibres; considerable increase in
capacity across sub-segments to meet captive & open market demand to drive volumes growth going forward
Strong competition from Chinese manufacturers, large Indian peers & unorganised domestic texturisers; however
large scale of operations enables supporting high volumes at competitive prices
Relatively moderate EBDITA margins due to commodity nature of business; significant volatility in raw material
(MEG & PTA) prices may dampen profitability margins if not hedged or passed through adequately; however
RoCE is expected to remain relatively healthy due to lower working capital intensity and capex requirements
Exhibit 15: Polyester Yarn Division – Key Operating Indicators
Present mainly in commodity segment; manufactures Partially Oriented Yarn (POY), Fully Drawn Yarn
Product mix
(FDY), Drawn Texturised yarn (DTY)
Target segment Domestic power loom weavers, Direct exports
Highlights Among top three polyester yarn manufacturing company in India
Competition from established domestic players like Reliance Industries Ltd, JBF Industries Ltd,
Garden Silk Mills Ltd, Futura Polyesters Ltd, Indo Rama Synthetic Ltd., Century Enka
Competition
Competition from Chinese polyester yarn manufacturers that dominate the global polyester market
with ~ 70% market share
The global production of Polyester fibre grew by 5.3% in CY10, Polyester Filament Yarn recorded
Industry Scenario strong growth of 5.7% to 19.3 million tons and Polyester Staple Fibre grew by 4.6% to 12.6million
Tons. On the other hand, cotton fibre showed a de-growth of 4.8%.
Current Capacity* POY : 200,000 tons, FDY : 70,000 tons, DTY : 114,000 tons
Capacity expansion for DTY to 170,000 tons per annum and to 500,000 tons for POY at an estimated cost
Future plans
of ~Rs. 860 crore by FY12e
Source: Company; ICRA Online Research *POY - Partially Oriented Yarn; FDY- Fully Drawn Yarn (FDY), DTY - Drawn Texturised yarn;
Strong competition from Chinese manufacturers, large Indian peers & unorganised domestic texturisers;
however large scale of operations enables supporting high volumes at competitive prices
The polyester yarn segment faces competition from larger & fully integrated players like Reliance Industries
domestically and stiff competition from chinese manufacturers (that account for close to 70% of global production)
internationally. However, Reliance Industries is mainly present in Polyester Staple Fibres (~62% market share) and
has lower presence in Polyester Filament Yarn (~29% market share) segment catered by Alok. Besides, increasing
domestic demand, rising finance cost and reducing labour cost arbitrage in China are likely to aid long-term growth
rates for leading Indian manufacturers like Alok over the medium term.
15
16. ICRA Equity Research Service Alok Industries Limited
Exhibit 16: Polyester Yarn Division – Competitive Scenario:
Company Installed Capacity*
Reliance Industries Limited 800,000 tons
Indo Rama Synthetics Limited 303,600 tons
JBF Industries 201,200 tons
Garden Silk Mills Limited 230,400 tons
Alok Industries 200,000 tons
Source: Company Websites; ICRA Online Research
Significant volatility in raw material prices may dampen margins if not hedged or passed through adequately
Purified Terephthalic Acid (PTA) and Mono Ethylene
Polyester Division - Raw Material Price Trend
Glycol (MEG) are the primary raw materials constituting
1800 ~50-70% of the total sales value for polyester yarn. Being
1600 petrochemical products, prices of PTA and MEG fluctuate
1400
1200 in line with fluctuations in crude oil prices in the long
1000 term. Domestic refining companies like Reliance and IOC
800
600 cater to ~75% of Alok’s PTA requirement while the
400 balance is imported. MEG is completely imported by the
200
0 company. Volatility in raw material prices remain a key
challange for the company in view of the commodity
Nov-09
Nov-10
May-10
May-11
Jul-09
Jul-10
Mar-10
Mar-11
Sep-09
Jan-10
Sep-10
Jan-11
nature of the business.
PTA (US$ per ton) MEG (US$ per ton)
Source: EmergingTextiles.com
Polyester Yarn division is expected to become highest revenue contributor by FY14e on the back of large
capacity enhancement being undertaken by the company
Alok’s Continuous Polymerisation plant with 200,000 TPA POY capacity became full operational in FY11. We expect
the division to further expand aggressively ~500,000 TPA in FY12e and ~900,000 TPA in FY14e; inorder to leverage
upon the rapidly increasing artificial fibre demand due to limited land availability for cultivation of natural fibres, high
dependence on agro-climatic conditions and higher domestic spending in the price sensitive rural markets. Besides,
Alok plans to shift from semi-dull polyester yarn to relatively higher end products like bright black/cationic yarns
currently being produced by Reliance Industries, JBF Industries and Indo Rama Synthetics. As a result, we expect the
polyester yarn division to report a robust ~52% CAGR revenue growth and emerge as the largest revenue contributor
for Alok, with its revenue contribution increasing from 25% of Alok’s overall sales in FY11 to 42% of sales in FY14e.
While the EBITDA margins for the division are expected to remain moderate (around ~18%); the division generates
higher ROCE on account of relatively lower working capital intensity / capex requirements and higher asset turnover
(~2.5 times) in comparison to cotton based businesses (~0.5 times).
Exhibit 17: Polyester Yarn Division – Key Financial Indicators
Key Estimates FY09a FY10a FY11a FY12e FY13e FY14e
Installed Capacities
DTY '000 MT 77 114 114 170 170 170
FDY '000 MT 0 0 65.7 65.7 65.7 65.7
POY '000 MT 182.5 182.5 200 500 700 900
16
17. ICRA Equity Research Service Alok Industries Limited
FY09a FY10a FY11a FY12e FY13e FY14e
Production
DTY '000 MT 71 104 108 125 131 137
FDY '000 MT - - 16 36 43 49
POY '000 MT 10 28 56 140 279 488
Total Revenues Rs Cr 619 1193 1664 2592 3905 5864
Growth % 93% 39% 56% 51% 50%
Source: ICRA Online Research Note: DTY - Drawn Texturised yarn; FDY- Fully Drawn Yarn (FDY), POY - Partially Oriented Yarn
Garments Division
Snapshot
Currently low level of activities at Alok’s garmenting division; large part of garmenting activity outsourced
Garment division accounted for close to 3% of total operating income and 2% of EBITDA in FY11
Division unlikely to contribute significantly higher revenues due to lower management focus currently
Garments currently a small division
Garment division of Alok is currently the smallest in terms of revenue and capacities. During FY11 the division
recorded sales of Rs. 175 crore, an increase of 24% over the previous year. Exports contributed to the majority share
of sales for this division. The garments division increased production capacity to 22 million pieces per annum from 15
million pieces per annum in FY09. The capacity utilisation at present constrained as availability of workers at current
factory location of Silvassa is a problem due to transportation issues for workers. Hence, further capacity
enhancement (7 million pieces) was done at Daman where there is ample availability of labor which is expected to
improve capacity utilisation of the segment in future.
Though opportunities are available in workwear segment for this division to grow, Alok has no plans to aggressively
expand the garmenting facilities further at present however it is considering outsourcing opportunities especially in
Bangladesh, where quality garments can be produced at competitive prices. However, going forward too, the division
is expected to remain a minor contributor to Alok’s overall sales.
Exhibit 18: Garment Division – Key Financial Indicators
Key Estimates FY09a FY10a FY11a FY12e FY13e FY14e
Installed Capacities Mn. Pcs. 15.0 22.0 22.0 22.0 22.0 22.0
Production Mn. Pcs. 4.7 3.7 4.4 5.1 5.9 6.8
Total Revenues Rs Cr 139 141 175 175 191 210
Growth % 39% 2% 24% 9% 10% 11%
Source: ICRA Online Research
17
18. ICRA Equity Research Service Alok Industries Limited
Real Estate Business
Snapshot
Foray into real estate in FY07, through separate subsidiaries, to be part of the high growth of this sector
Large accumulation of debt on account of projects under implementation, resulting in pressure on capital
structure despite equity infusion from promoters and institution investors (though QIPs)
Commercial complex (Penninsula Business Park) project nearing completion; Joint venture in the residential real
estate segment likely to yield results only in the coming years
Succesful exit from real estate segment likely to aid recovery in overall profitability, capital structure and liquidity
profile of the company
Entry into real estate business to encash the upturn in the real estate industry four years back; looking
actively to exit the business after execution and sale of current projects at hand
Alok had entered the real estate business and invested ~Rs. 1,500 crore in FY07 to take advantage of the real estate
boom witnessed during 2004-2008. The management is aggressively pursuing monetisation of these investments and
exit the real estate business to improve the capital structure of the company going forward. Except the residential
project at Nahur (Mumbai) which may take around three-four years for completion, the company plans to exit from
other real estate ventures by March 2012.
Ashford Center - Four floors to be retained for corporate use, remaining four to be sold by March 2012
Alok, through its subsidiary Alok Infrastructure Limited, had purchased Ashford Center (commercial building, 8
floors, 60,000 sq. ft.) at Lower Parel at ~Rs. 125 crore in 2006. Alok intends to retain four floors for corporate. The
company has recently sold one floor (7,500 sq. ft) at the rate of Rs. 21,000 per sq. ft. while the other three floors is are
expected to be sold at similar rates by March 2012.
Peninsula Business Park - Tower ‘B’: Lease agreements to be signed soon, complete sell off expected later
The company, through its wholly owned step-down subsidiary Alok Realtors Limited, had invested ~Rs. 1,275 crore in
Peninsula Business Park (Tower B, 20 floors, 641,000 sq. ft) in 2006. The site is located at Lower Parel (near Phoenix
Mills) in Mumbai and is being developed by Peninsula Lands Limited with civil work carried on Shapoorji Pallonjee
Group. The building is located in close proximity to the Lower Parel and Currey Road stations, 5-star hotels like ITC
and Four Seasons and other major commercial complexes like Indiabulls, DLF, HDFC Bank House & Ambit RSM. The
proposed project is exposed to market risks on account of significant upcoming commercial space in its vicinity. Alok
is scouting for potential lessees to rent out the premises and plans to sell the property to real estate funds after the
property is completely lease out. The company has recently lease out two floors to an FMCG at a rate Rs. 225 per sq.ft.
We have assumed 50% occupany by March 2012, 100% by H1 FY13e and complete sell-off / exit from the venture at
~17,000 Rs/sq. ft. during FY13e in our projections.
Land at Silvassa (500 acres) – SEZ plans shelved, to be sold at more than five times cost price
Alok had acquired 500 acres of industrial land for at a total cost of Rs. 50 crore (Rs. 10 lakh per acre) at Silvasa in
2006, with the intention of developing Textile SEZ. However, the company has shelved its development plan and
intends to sell the same at Rs. 60-70 lakh per acre. The company in advanced talks to sell around 73 acres for a
consideration of Rs. 50 crore. We have assumed the remaining land to the monitized in various phases for ~Rs 300
crore by FY14e.
18
19. ICRA Equity Research Service Alok Industries Limited
Ashford Royale Residential Complex : ~1.1 msf to be developed in Nahur by December 2013
The company, through Alok Infrastructure Limited, has entered into 50:50 joint venture for developing a residential
complex on a 7 acre plot (CEAT factory) at Nahur1. The plot is being developed by Ashford group into two 42 storey
and two 37 storey buildings (total 608 flats) with landscaped garden, club house, gymnasium and swimming pool and
a total saleable area of 1.1 mn. Sq.ft.. The civil contract has been awarded to Talati, Panthaki & Associates. The project
is estimated to be completed by December 2014.
Exhibit 19 : Alok’s Real Estate Businesses
Key Projects Major Updates / Expected monitization
Commercial building at Lower Parel : Saleable area 60,000 sq. ft.
1) Ashford Center The company plans to retain ~30,000 sq. ft. for corporate use
(100% Subsidiary) We expect remaining ~30,000 sq. ft. to be sold off at ~21,000 Rs/sq. ft. during
the current fiscal year
Commercial building at Lower Parel: 20 floors, Saleable area 641,000 sq. ft.
Recently leased out two floors at a rate Rs. 225 per sq.ft.; we expect 50%
2) Peninsula Business Park -
occupany by March 2012 and 100% by H1 FY13e
Tower B (100% Subsidiary)
We have assumed complete sell-off and subsequent exit from the venture at
~17,000 Rs/sq. ft. during FY13e in our projections
500 acres industrial land at Silvassa
The company in advanced talks to sell around 73 acres for a consideration of
3) Land at Silvassa
Rs. 50 crore
(100% Subsidiary)
We have assumed the remaining land to the monitized in various phases for
~Rs 300 crore by FY14e.
Residential Project: ~1.1 million sq ft to be developed in Nahur (Mumbai) by
Dec 2014
4) Ashford Royale We have assumed sales booking in 8,500 – 10,500 Rs/sq. ft. range; Land cost at
(50:50 Joint Venture) Rs. 137 crore, construction costs at ~ 4500 Rs / sq. ft.
Our assumptions regarding sales bookings and revenue / cost recognitions for
the complete project are as follows:
FY11a FY12e FY13e FY14e FY15e
Total Area Mn Sq Ft 1.1 1.1 1.1 1.1 1.1
Market Rate Rs/Sq Ft 8500 9000 9500 10000 10500
Sales Booking (%) % 25% 50.0% 75.0% 100.0% 100.0%
Constuction Completion (%) % 25% 50.0% 75.0% 100.0%
Sales / Cost Recognition % 0% 13% 38% 75% 100%
Revenue Recognition Rs. Crore 127.19 254.38 381.56 254.38
Cost Recognition Rs. Crore 79 158 237 158
Source: Company, ICRA Online Research
1 Nahur is a North Eastern suburb of Mumbai and is located between Mulund and Bhandup.
19
20. ICRA Equity Research Service Alok Industries Limited
UK Retail Business – Grabal Alok UK
Snapshot
Foray into UK retail market through acquisition of ~90% stake in ‘Grabal Alok UK’ through its subsidiary –
‘Alok Industries International Ltd’ and associate company – ‘Grabal Alok Impex Ltd’
Consolidatation of ‘Grabal Alok UK’ post the proposed merger with ‘Grabal Alok Impex’, likely to adversely
impact the financials of Alok industries in near term
Rebranding of stores and operational improvements to aid turnaround of the ailing UK retailer; achieved cash
breakeven in FY11 and expected to achieve net breakeven in FY13e
The management may look to divest it post turnaround, if Alok makes decent returns on the investment
With an intention to enter the garment and accessories retail market in the UK, Alok, through its subsidiary acquired
~41.3% equity stake its associate company Grabal Alok Impex, through its subsidiary, acquired close to 48.71% stake
in British retailer, Grabal Alok (UK) Limited (GAUKL) in 2007. Recently, Alok’s board has approved the merger of
Grabal Alok Impex with Alok, which will make GAUKL a 90% subsidiary of Alok Industries.
Rebranding of stores and operational improvement measures to aid turnover of the ailing UK retailer
GAUKL has 219 stores across England, Scotland and Wales, where it retails value-for-money and quality fashion for
women, men, girls, boys and infants. It also sells accessories like artificial jewellery, shoes and leather bags. After
acquiring the company, Alok’s management undertook a re-branding exercise, re-naming the outlets from ‘QS’ to
‘Store Twenty One’. The stores are now being repositioned from being a discount retailer to a value retailer and
opportunities for setting up ‘shop-in-shop’ in large format stores are also being looked upon. A series of other
measures such as shifting of sourcing to Asian countries, improving quality of merchandise, cost reduction initiatives
been initiated to reduce losses and increase operational efficiencies, which has resulted in a cash breakeven in FY11.
Operations of the UK company are yet to achieve break even and are likely to require further financial and operation
support from Alok. Consolidatation of ‘Grabal Alok UK’ post the proposed merger with ‘Grabal Alok Impex’, likely to
adversely impact the financials of Alok in near term. The management considers all real-estate and retail businesses of
the company as non-core businesses and may plan to divest the stake in the UK retailer once the operations turn
positive and the company makes decent returns on its investment.
Domestic Retail Business - Alok H&A Limited
The company, through its wholly owned subsidiary Alok H&A Limited, has ventured into retail of garments, home
textiles and accessories through exclusive brand outlets (EBOs) and is positioned as an affordable lifestyle brand with
presence across 75 cities in 22 different states of India. At the end of March 2011, Alok operated close to 290 H&A
stores in India. The stores are operated on asset-light franchisee model, where the company incurs no capital or rental
cost. Apart from the standard format stores, which are usually 800 square feet to 1,000 square feet in size, the
company is also looking at larger format stores up to 2,500 square feet to accommodate all categories – men’s, ladies,
children’s clothes, home furnishings and accessories such as footwear, sun glasses and perfumes. Though Alok is
looking to expand store count to 500 by March 2012 using the franchiese model, the retail business is not estimated to
account for more than 5% of its overall (consolidated) operating revenues for the company. Besides, the management
may look to spun-off the venture into a separate company incase they turn more aggressive on the domestic retail
business.
20
21. ICRA Equity Research Service Alok Industries Limited
OTHER SUBSIDIARIES AND ASSOCIATES
Grabal Alok Impex Limited - Presence in embroidered products; to be merged with Alok in FY12
Grabal Alok Impex Limited (GAlok) was incorporated in 1993 through technical collaboration with Grabal Albert
Grabher GmbH & Co, Austria and is engaged in manufacturing wide range of embroidered fabrics having application
in the home textiles, apparel fabrics and garmenting. GAlok one of the largest domestic manufacturers of embroidered
fabric with a capacity of 34 billion stitches a year. The company has presence in both international and domestic
markets with customers including domestic traders and garment manufacturers, international branded apparel
companies and international home textile retailers. GAlok had reported ~Rs. 235 crore revenues with ~21% EBITDA
margins in FY11. Besides, the company indirectly holds 48.71% in British retailer, Grabal Alok (UK) Limited (GAUKL).
Alok’s board of directors have recently approved the amalgamation of GAlok into Alok though a 1:1 swap ratio. This
will result in ~2.6% equity dilution and marginal increase in promoter holding from 29.37% to 29.71% in Alok. GAlok
has ~Rs. 600 crore external liabilites on its balance sheet, which consists of bank term loans, working capital loans,
FCCBs, Convertible Debentures and redeemable preference shares. Overall, the merger of Grabal Alok Impex Ltd and
thereby consolidation of GAUKL is expected to reduce the consolidated EBITDA margins for the company by ~2.5% in
FY12e and weaken the capital structure by additional debt burden of ~Rs. 600 crore, in the near term.
Mileta a.s –synergies through transfer of advanced yarn dyeing technologies to Alok’s fabric division;
Exhibit 20: Mileta a.s – Operating Profile
Product mix Shirting fabrics, table linen and bed linen
Target segment Exports mainly to Europe, North Africa, the Americas, the Middle East, the Far East and the Asia Pacific regions
Key brands Mileta’s brands – Mileta, Erba, Cottonova, Lord Nelson and Wall Street
Source: Company, ICRA Online Research
Alok holds ~100% stake in Mileta a.s, an integrated textile entity based out of Czech Republic. The acquisition has
benefited by way of technology inputs from the Czech entity, especially in value added yarn dyed fabrics. Post the
acquisition Alok has been able to make quality yarn-dyed fabrics, which are priced at ~Rs. 130-140 per meter, a
significant premium to its earlier realisations, although the same forms less than 10% of its fabric sales currently. Alok
also stands to gain access to Mileta’s well-established distribution network in the USA and Europe. Besides, Alok has
launched some of the Mileta brands – Erba (for handkerchiefs) and Lord Nelson (for premium shirting) – in the Indian
market. Cottonova a home textile brand of Mileta is manufactured in Alok’s home textile plant and being exported.
Alok was able to turnaround Mileta’s performance through production efficiencies, optimising headcount and other
cost rationalisation efforts in FY10. Thus despite the slowdown in the European markets, Mileta generated cash
profits of the company of Euro 0.30mn. (Rs. 1.83 crores) during FY 2010 as against cash loss of Euro 4.17 mn. (Rs.
25.26 crores) during the previous year.
21