1. Name ___________________________________ Date __________________
Mrs. Labuski / Mrs. Portsmore Period __________ Unit 12 Lesson 5 HW
Measure of Variability OC 7-3
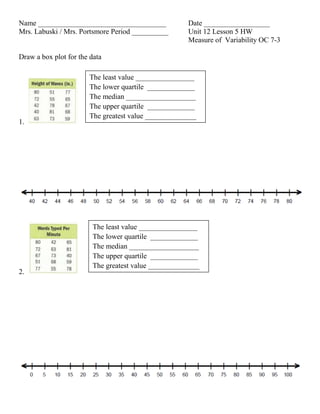
Draw a box plot for the data
1.
2.
The least value ________________
The lower quartile _____________
The median ___________________
The upper quartile _____________
The greatest value ______________
The least value ________________
The lower quartile _____________
The median ___________________
The upper quartile _____________
The greatest value ______________
2. 3. The box plot below summarizes math scores.
a. What was the greatest test score? _____________________
b. Explain why the median is not in the middle of the box. _____________________________
_____________________________________________________________________________
_____________________________________________________________________________
c. Half of the scores were higher than what score? ____________________________________