Recommended

Recommended
More Related Content
More from michaelazach6427
More from michaelazach6427 (20)
Recently uploaded
Recently uploaded (20)
The figure below shows two normal distributions. A and B. The distrib.pdf
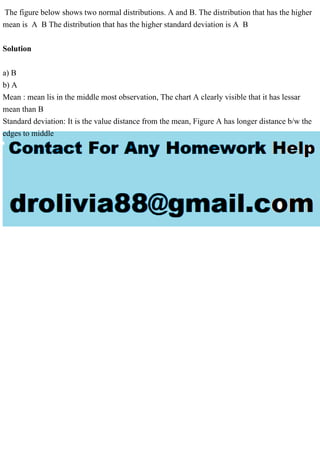
- 1. The figure below shows two normal distributions. A and B. The distribution that has the higher mean is A B The distribution that has the higher standard deviation is A B Solution a) B b) A Mean : mean lis in the middle most observation, The chart A clearly visible that it has lessar mean than B Standard deviation: It is the value distance from the mean, Figure A has longer distance b/w the edges to middle