Find the present worth of the unequal payment shown in the Cash Flow D.docx
•Download as DOCX, PDF•
0 likes•2 views
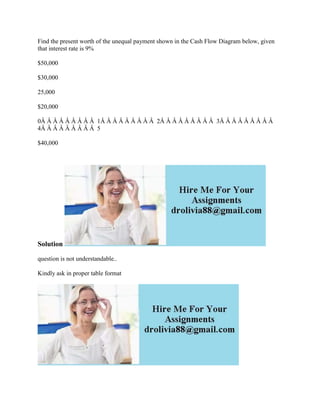
The document is a cash flow diagram showing unequal payments over 5 years with an interest rate of 9%. It displays payments of $50,000 in year 1, $30,000 in year 2, $25,000 in year 3, $20,000 in year 4, and $40,000 in year 5. The document asks to calculate the present worth of these cash flows given the 9% interest rate.
Report
Share
Report
Share
Recommended
Recommended
https://app.box.com/s/71kthbth9ww0fyjrppmh1p2gasinqj5zĐỀ THAM KHẢO KÌ THI TUYỂN SINH VÀO LỚP 10 MÔN TIẾNG ANH FORM 50 CÂU TRẮC NGHI...
ĐỀ THAM KHẢO KÌ THI TUYỂN SINH VÀO LỚP 10 MÔN TIẾNG ANH FORM 50 CÂU TRẮC NGHI...Nguyen Thanh Tu Collection
More Related Content
More from michael1810
More from michael1810 (10)
Java Language Which of the following statements is true- Select all th.docx
Java Language Which of the following statements is true- Select all th.docx
It-'s virtualization topic Would anyone please expalin what is the di.docx
It-'s virtualization topic Would anyone please expalin what is the di.docx
For each pair of substance identify the substance that is likely to ha.docx
For each pair of substance identify the substance that is likely to ha.docx
For each of the requirements listed in the table below- 1- Please iden.docx
For each of the requirements listed in the table below- 1- Please iden.docx
For Contingent Liability- When do you disclose it- When do you record.docx
For Contingent Liability- When do you disclose it- When do you record.docx
For each of the abstract data types (ADTs) that we have analyzed in th.docx
For each of the abstract data types (ADTs) that we have analyzed in th.docx
For each form of transport plot the value of overall benefits against.docx
For each form of transport plot the value of overall benefits against.docx
Fluid Mechanics The water surface is at the position shown at t - 0 se.docx
Fluid Mechanics The water surface is at the position shown at t - 0 se.docx
Fluctuation in inflation can occur in the short or long term- For exam.docx
Fluctuation in inflation can occur in the short or long term- For exam.docx
First National Bank charges 11-2 percent compounded monthly on its bus (1).docx
First National Bank charges 11-2 percent compounded monthly on its bus (1).docx
Recently uploaded
https://app.box.com/s/71kthbth9ww0fyjrppmh1p2gasinqj5zĐỀ THAM KHẢO KÌ THI TUYỂN SINH VÀO LỚP 10 MÔN TIẾNG ANH FORM 50 CÂU TRẮC NGHI...
ĐỀ THAM KHẢO KÌ THI TUYỂN SINH VÀO LỚP 10 MÔN TIẾNG ANH FORM 50 CÂU TRẮC NGHI...Nguyen Thanh Tu Collection
https://app.box.com/s/cbgl8f0rgcll2fzdqp83sjxx8nom8188TỔNG HỢP HƠN 100 ĐỀ THI THỬ TỐT NGHIỆP THPT VẬT LÝ 2024 - TỪ CÁC TRƯỜNG, TRƯ...
TỔNG HỢP HƠN 100 ĐỀ THI THỬ TỐT NGHIỆP THPT VẬT LÝ 2024 - TỪ CÁC TRƯỜNG, TRƯ...Nguyen Thanh Tu Collection
Recently uploaded (20)
Navigating the Misinformation Minefield: The Role of Higher Education in the ...
Navigating the Misinformation Minefield: The Role of Higher Education in the ...
MSc Ag Genetics & Plant Breeding: Insights from Previous Year JNKVV Entrance ...
MSc Ag Genetics & Plant Breeding: Insights from Previous Year JNKVV Entrance ...
Exploring Gemini AI and Integration with MuleSoft | MuleSoft Mysore Meetup #45
Exploring Gemini AI and Integration with MuleSoft | MuleSoft Mysore Meetup #45
REPRODUCTIVE TOXICITY STUDIE OF MALE AND FEMALEpptx
REPRODUCTIVE TOXICITY STUDIE OF MALE AND FEMALEpptx
Envelope of Discrepancy in Orthodontics: Enhancing Precision in Treatment
Envelope of Discrepancy in Orthodontics: Enhancing Precision in Treatment
ĐỀ THAM KHẢO KÌ THI TUYỂN SINH VÀO LỚP 10 MÔN TIẾNG ANH FORM 50 CÂU TRẮC NGHI...
ĐỀ THAM KHẢO KÌ THI TUYỂN SINH VÀO LỚP 10 MÔN TIẾNG ANH FORM 50 CÂU TRẮC NGHI...
The Ball Poem- John Berryman_20240518_001617_0000.pptx
The Ball Poem- John Berryman_20240518_001617_0000.pptx
Graduate Outcomes Presentation Slides - English (v3).pptx
Graduate Outcomes Presentation Slides - English (v3).pptx
Spring gala 2024 photo slideshow - Celebrating School-Community Partnerships
Spring gala 2024 photo slideshow - Celebrating School-Community Partnerships
How to Manage Closest Location in Odoo 17 Inventory
How to Manage Closest Location in Odoo 17 Inventory
HVAC System | Audit of HVAC System | Audit and regulatory Comploance.pptx
HVAC System | Audit of HVAC System | Audit and regulatory Comploance.pptx
Incoming and Outgoing Shipments in 2 STEPS Using Odoo 17
Incoming and Outgoing Shipments in 2 STEPS Using Odoo 17
Pragya Champions Chalice 2024 Prelims & Finals Q/A set, General Quiz
Pragya Champions Chalice 2024 Prelims & Finals Q/A set, General Quiz
TỔNG HỢP HƠN 100 ĐỀ THI THỬ TỐT NGHIỆP THPT VẬT LÝ 2024 - TỪ CÁC TRƯỜNG, TRƯ...
TỔNG HỢP HƠN 100 ĐỀ THI THỬ TỐT NGHIỆP THPT VẬT LÝ 2024 - TỪ CÁC TRƯỜNG, TRƯ...
Find the present worth of the unequal payment shown in the Cash Flow D.docx
- 1. Find the present worth of the unequal payment shown in the Cash Flow Diagram below, given that interest rate is 9% $50,000 $30,000 25,000 $20,000 0Â Â Â Â Â Â Â Â Â 1Â Â Â Â Â Â Â Â Â 2Â Â Â Â Â Â Â Â Â 3Â Â Â Â Â Â Â Â Â 4Â Â Â Â Â Â Â Â Â 5 $40,000 Solution question is not understandable.. Kindly ask in proper table format