Dioxins and furans from incinerator.pdf
•
0 likes•7 views

Emisiones e contaminantes atmosféricos

Recommended
More Related Content
Similar to Dioxins and furans from incinerator.pdf
Similar to Dioxins and furans from incinerator.pdf (20)
More from Mauricio Hernandez Sarabia
More from Mauricio Hernandez Sarabia (9)
Recently uploaded
Recently uploaded (20)
Dioxins and furans from incinerator.pdf
- 1. Atmospheric Environment 41 (2007) 8527–8536 Dioxins, furans and polycyclic aromatic hydrocarbons emissions from a hospital and cemetery waste incinerator Giuseppe Mininnia , Andrea Sbrillib , Camilla Maria Bragugliaa , Ettore Guerrieroc , Dario Marania,, Mauro Rotatoric a CNR, Istituto di Ricerca sulle Acque, via Reno 1, 00198 Roma, Italy b UNIDO (United Nation Industrial Development Organization), Vienna International Center, Wagramerstrasse 5, A-140 Vienna, Austria c CNR, Istituto sull’inquinamento atmosferico, Via Salaria Km 29,300, 00016 Monterotondo, Italy Received 28 March 2007; received in revised form 5 July 2007; accepted 10 July 2007 Abstract An experimental campaign was carried out on a hospital and cemetery waste incineration plant in order to assess the emissions of polychlorinated dibenzo-p-dioxins (PCDDs), polychlorinated dibenzofurans (PCDFs) and polycyclic aromatic hydrocarbons (PAHs). Raw gases were sampled in the afterburning chamber, using a specifically designed device, after the heat recovery section and at the stack. Samples of slags from the combustion chamber and fly ashes from the bag filter were also collected and analyzed. PCDD/Fs and PAHs concentrations in exhaust gas after the heat exchanger (200–350 1C) decreased in comparison with the values detected in the afterburning chamber. Pollutant mass balance regarding the heat exchanger did not confirm literature findings about the de novo synthesis of PCDD/Fs in the heat exchange process. In spite of a consistent reduction of PCDD/Fs in the flue gas treatment system (from 77% up to 98%), the limit of 0.1 ng ITEQ Nm 3 at the stack was not accomplished. PCDD/Fs emission factors for air spanned from 2.3 up to 44 mg ITEQ t 1 of burned waste, whereas those through solid residues (mainly fly ashes) were in the range 41–3700 mg ITEQ t 1 . Tests run with cemetery wastes generally showed lower PCDD/F emission factors than those with hospital wastes. PAH total emission factors (91–414 mg kg 1 of burned waste) were in the range of values reported for incineration of municipal and industrial wastes. In spite of the observed release from the scrubber, carcinogenic PAHs concentrations at the stack (0.018–0.5 mg Nm 3 ) were below the Italian limit of 10 mg Nm 3 . r 2007 Elsevier Ltd. All rights reserved. Keywords: Cemetery wastes; Hospital wastes; PCDD/F; PAH; Emission factors; Incineration 1. Introduction In the past years many emission inventories have been carried out to evaluate the potential emission of polychlorinated dibenzo-p-dioxins/polychlori- nated dibenzofurans (PCDD/Fs) from the main industrial sources. In 2001, emissions from hospital waste incinerators in the European Union were estimated in 200–400 g ITEQ year 1 , accounting for 25% of total PCDD/Fs emissions (Paradiz et al., 2001). The 5th Action program of the European Union had the aim to achieve the 90% reduction by ARTICLE IN PRESS www.elsevier.com/locate/atmosenv 1352-2310/$ - see front matter r 2007 Elsevier Ltd. All rights reserved. doi:10.1016/j.atmosenv.2007.07.015 Corresponding author. Tel.: +39 06 8841451; fax: +39 06 8417861. E-mail address: marani@irsa.cnr.it (D. Marani).
- 2. 2005 for emissions from municipal and hospital waste incinerators and power plants. However, in 2004 the European Dioxin Emission Inventory Project showed that there was still a large number of hospital waste incinerators with a large varia- bility of emission factors, which could be considered significant local sources of PCDD/Fs (QuaX et al., 2004). Due to the high content of chlorine, hospital waste incineration can lead to the formation of PCDD/Fs (EPA, 1990, 1994; Wagner and Green, 1993), which can be released both in air and in the ashes (Kolenda et al., 1994; Grochowalski, 1998). In Italy these solid residues cannot be disposed off in landfill for hazardous wastes, as long as the PCDD/F ITEQ concentration exceeds the limit of 10 mg ITEQ kg 1 provided by the Legislative Decree 36/03 implementing the European Directive 99/31 (European Commission, 1999). As far as cemetery wastes are concerned, the wood used for coffins are typically treated with preservatives such as polyvinyl chloride, creosote (a polycyclic aromatic hydrocarbons (PAHs) mixture) or insecticides in light organic solvents that may induce the formation of PCDD/Fs (Salthammer et al., 1995). In Italy, PCDD/Fs atmospheric emission factors from hospital waste incineration have been reported as 0.8 mg ITEQ t 1 of waste (ANPA, 2002), but as yet very few emission data are available for this sector. Incineration is also known as a major source of PAHs (Mascolo et al., 1999). Non-ideal conditions such as the cooling of hot gases in the combustion zone due to the contact with the chamber walls or insufficient oxygen supply can induce incomplete combustion and pyrolysis reactions. These factors lead to the formation of toxic organic compounds among which PAHs are of major concern for their relative abundance in the emissions and potential impact on human health (Ana et al., 1999; Akimoto et al., 1997; Mininni et al., 2000). It is well known that the combustion of polymeric materials, such as polyethylene and polystyrene, which are present in hospital wastes, produces large amounts of PAH and soot (Wang et al., 2002). In spite of that, few studies are reported on PAH emissions from hospital waste incineration (Liow et al., 1997; Lee et al., 2002; Walker and Cooper, 1992; Wheatley et al., 1993). In Italy specific emission factors for PAHs from hospital waste incineration are not available, but for municipal and industrial waste an emission factor in the range 50–500 mg kg 1 of waste is provided (ANPA, 2002). With the aim to increase the database for PCDD/Fs and PAHs emission inventory, an experi- mental campaign was carried out on a full-scale incineration plant where hospital and cemetery wastes were combusted. A second objective of this campaign was to check on a full-scale plant the hypothesis of de novo synthesis reactions that may occur in the heat exchanger. This hypothesis was checked by performing the pollutant mass balance in the heat exchanger unit. 2. Experimental The main units of the full-scale plant are a rotary kiln furnace, an afterburning chamber, a heat recovery system and a flue-gas cleaning system, which consists of a dry reactor with injection of about 10–11 kg h 1 of dry lime, a bag filter with pre- injection of cooling air and a wet scrubber. Plant capacity is about 600 kg h 1 of waste. The flow sheet of Fig. 1 shows the schematic of the plant. The figure also reports the three gas sampling points located in the afterburning chamber, after the heat exchanger, and at the chimney. Table 1 reports the operating conditions of the eight tests performed. In the tests 1–3 and 5–7 hospital wastes were burned, whereas in the tests 4 and 8 cemetery wastes, mainly consisting of coffins with relevant materials, were used. The temperature of the exhaust gases was measured in the after- burning chamber (910–1200 1C), after the heat recovery section (190–351 1C) and at the stack (70–99 1C). Oxygen varied in the range 1.5–8.9% by volume in the afterburning chamber and in the range 1.2–7.8% in the heat recovery section. Table 2 reports the production rates of slags, boiler ashes and fly ashes for each test. Samplings of PCDD/Fs and PAHs were carried out in the afterburning chamber using a sampling device specifically designed to resist at high tempe- ratures in very aggressive conditions. The widely used alloys or hastelloy and titanium cannot be employed for this purpose, because they can crash in the presence of acids and at high temperature (41100 1C). Ceramic materials are known to be resistant at high temperature and corrosive condi- tions but they may present problems due to their fragility, adsorption of micropollutants and deposition of particulate matter onto surface of porous material. For this reason a ceramic probe ARTICLE IN PRESS G. Mininni et al. / Atmospheric Environment 41 (2007) 8527–8536 8528
- 3. made of alumina with zero porosity was adopted, because, among other refractory materials, it exer- ted the best properties with negligible adsorption and good resistance to corrosive environment at high temperature. The PCDD/Fs sampling must be carried out in a range of temperature such that water condensation and PCDD/F de novo synthesis, which is known to occur in the range 250–400 1C (Gullett et al., 1990; Stieglitz et al., 1990; Stanmore and Clunies-Ross, 2000), are prevented. Therefore, raw gases sampled at the afterburning chamber were quickly cooled to 110–140 1C in a concentric tube exchanger using diathermic oil. The inner tube, where gas passes through, is made of titanium, since such material is more acid resistant than stainless-steel. The section for micropollutants entrapment is formed by a ceramic thimble filter, placed in a thermostatic chamber set at 110 1C, followed by an adsorbent ARTICLE IN PRESS Table 1 Main operating conditions of the full-scale incineration plant Test Feed (kg h 1 ) Sampling point 1 2 3 1 2 3 1 2 3 Temperature (1C) Oxygen (%) Flow rate (Nm3 h 1 ) 1 630 1200 320 96 5.0 4.0 16.5 1765 1662 6277 2 595 – 260 95 – 3.6 16.2 – 1957 7093 3 540 – 280 88 – 3.6 16.5 – 2190 8468 4 525 910 351 70 8.9 7.8 16.5 2966 2719 7975 5 557 1110 190 86 1.5 1.2 16.3 2196 2162 9110 6 684 1170 217 86 8.0 6.9 16.2 2962 2731 8022 7 530 1200 227 88 8.0 7.7 16.9 2611 2552 8279 8 640 1150 231 81 6.7 6.3 16.5 2393 2327 7603 1: afterburning chamber; 2: heat exchanger; 3: stack. Rotary kiln furnace Afterburning chamber Air-exhaust gas heat exchanger Water-exhaust gas heat exchanger Dry reactor Air Bag filter Lime Scrubber Chimney Slags Fly ashes 1 2 3 Boiler ashes Hospital and cemetery wastes Fig. 1. Flow sheet of the hospital and cemetery waste incineration plant with exhaust gas sampling points 1, 2 and 3. Table 2 Production rates of solid residues from different equipment (kg h 1 ) Test Slags Boiler ashes Fly ashes 1 113.4 2.2 15.7 2 107.1 2.0 15.0 3 97.2 1.7 13.8 4 94.5 1.5 12.5 5 100.3 1.8 13.3 6 123.1 2.1 18.3 7 95.4 1.5 12.6 8 115.2 2.1 16.5 G. Mininni et al. / Atmospheric Environment 41 (2007) 8527–8536 8529
- 4. resin (about 30 g of XAD-2), placed in a cold thermostatic section. Volatile and semi-volatile compounds were collected in the XAD-2 resin. Water was eventually condensed in the water collection system maintained at about 5 1C by a cryostat. The accuracy of measures was tested by experimental samplings with standard PCDD/Fs carried out at laboratory scale. The results sug- gested that in the condensation water the PCDD/Fs concentration was negligible. Furthermore, the probe was tested against any gas and particles leakage in the sampling train. On the other hand, comparative samplings in the incineration plant were not carried out, since conventional sampling devices made of other materials cannot stand the high temperature of the afterburning chamber. Sampling after the heat exchanger and at the stack was performed following the EN1948-1 filter/ condensation method (CEN, 1996) for PCDD/Fs detection and the Italian Unichim 825 method for PAHs detection (Unichim, 1988). In this case, conventional titanium probes were used for both sampling procedures. In each sampling point two samples were also collected for measuring particulate matter, SO2, NOx, CO and VOC concentration, following the relevant Italian Unichim methods. Samples in the tests 2 and 3 were not collected in the afterburning chamber due to operating problems. Extraction of PCDD/F from liquid samples (condensed water) and from solid samples (filters, fly ashes and slags) was carried out following the EN1948-2 method. An aliquot of the extracts was eluted with hexane on a silica gel column (to collect aliphatic hydrocarbons) and with toluene to collect PAHs. Slags sample for PCDD/Fs analysis, collected in the test 7, was lost during the analytical phase. The separate extracts were finally analyzed by HRGC/LRMS. A gas chromatograph Fisons 8000 coupled with a selective mass detector Fisons MD 800 was used. Two chromatographic columns with different polarity (DB5 MS and DB dioxin) were used for PCDD/Fs separation. The mass spectrometer was used after testing the absence of interferences. Results of the measurements were standardized at the 0 1C, 101.3 kPa and at oxygen concentration of 11%. 3. Results and discussion 3.1. Macropollutants Table 3 reports the macropollutant values mea- sured at the exit of the heat exchanger and at the stack. As expected, concentration decreased signifi- cantly in the gas treatment section. If a comparison with the half-hourly emission limits at the stack provided by the Directive 2000/76 on Waste Incineration (European Commission, 2000) is car- ried out, the results of Table 3 show a general compliance of the incineration plant with the legislative requirements. The only exception regards CO, whose high concentrations suggest that the combustion conditions were not properly opti- mized, especially for tests using hospital wastes. 3.2. Dioxins and furans Tables 4 and 5 show the PCDD/Fs concentra- tions found in the gas and solid residues samples, respectively. In spite of the operating temperature of the afterburning chamber higher than 1100 1C, ARTICLE IN PRESS Table 3 Macro-pollutants (mg Nm 3 ) at the exit of heat exchanger (HE) and at the stack Test SO2 NOx CO Organic carbon Particulate matter HCl HE Stack HE Stack HE Stack HE Stack HE Stack HE Stack 1 1224.0 44.5 131.9 50.1 839.8 961.6 8.80 1.0 2736.8 19.9 72.3 33.7 2 442.5 35.4 66.1 12.9 560 262.2 8.95 1.3 – 36.3 63 9.1 3 663.6 57.1 78.5 34.5 637.3 343.2 6.55 0.5 – 2.7 31.9 10.6 4 351.0 25.0 102.2 50.2 460.2 110.1 14.60 2.21 1066.7 0.1 14.9 12.4 5 439.2 50.3 96.3 13.6 610.0 112.7 10.80 6.40 1510.2 0.6 31.4 11.2 6 410.6 48.8 137 84.3 798.6 209.9 11.90 1.70 2319.1 0.1 63.9 28.6 7 585.3 39.2 86.2 29.7 880.1 202.7 3.50 0.10 1140.5 9.8 245.1 66.2 8 745.0 29.4 115 37.8 790.4 72.3 42.32 9.91 2212.9 0.3 80.2 21.7 G. Mininni et al. / Atmospheric Environment 41 (2007) 8527–8536 8530
- 5. which should be suitable for destruction of PCDD/Fs (Lindner et al., 1990), very high concen- trations were always detected in this section. Though a sharp decrease of the above concentra- tions was observed in the down flow sampling points, the limit of 0.1 ng ITEQ Nm 3 at the stack was never met (0.19–2.69 ng ITEQ Nm 3 ). As far as solid residues are concerned, both fly ashes and slags show concentrations comparable with those provided by the Dioxin Toolkit (UNEP, 2005) for advanced incineration plants. In spite of this, in five out of eight fly ash samples PCDD/Fs concentrations were higher than the limit of 10 mg ITEQ kg 1 for disposal in hazardous waste landfill sites provided by the European Directive 99/31 (European Commission, 1999). A peak value of 147 mg ITEQ kg 1 was reached in test 2. Fly ashes from hospital wastes showed higher concen- trations than fly ashes produced from cemetery waste. In the slags much lower (3–4 order of magnitude) PCDD/Fs concentrations were detected (0.004–0.12 mg ITEQ kg 1 ) with respect to those found in fly ash. Anyway, in both kinds of samples PCDFs congeners were predominant with respect to PCDDs, according to literature findings (Pohlandt and Marutzky, 1994). In the afterburning chamber, PCDD/Fs concen- trations were not significantly correlated either with temperature or with oxygen concentration. PCDD/Fs concentrations after the heat exchan- ger were always lower than the corresponding values in the afterburning chamber. These results are somewhat unexpected, as the conditions inside the heat exchanger may induce PCDD/F de novo synthesis (temperatures varying in the range 250–400 1C and the presence of particles acting as active sites where formation reactions might take place) (Lindner et al., 1990; Mariani et al., 1990; Benfenati et al., 1991). However, to better assess PCDD/F formation or removal inside the heat exchanger, a complete mass balance must be performed around this unit, considering all the gaseous and solid contributions. The mass balance can be determined considering gas flow rates in ARTICLE IN PRESS Table 4 PCDD/Fs concentrations in exhaust gases (ng ITEQ Nm 3 ) Test 1 2 3 4 5 6 7 8 Afterburning chamber PCDD 143.0 – – 64.8 16.2 20.1 15.5 66.3 PCDF 179.7 – – 96.4 68.5 40.4 50.2 102.9 PCDD+PCDF 322.7 – – 161.2 84.7 60.4 65.7 169.2 Heat exchanger PCDD 5.93 2.25 6.88 5.87 3.86 0.55 1.12 0.30 PCDF 23.16 5.55 16.35 25.66 7.38 2.16 5.68 0.85 PCDD+PCDF 29.08 7.81 23.22 31.53 11.24 2.71 6.81 1.16 Stack PCDD 0.07 0.15 0.08 0.07 0.58 0.15 0.29 0.04 PCDF 0.21 0.30 0.25 0.47 2.11 0.51 1.29 0.15 PCDD+PCDF 0.29 0.46 0.33 0.54 2.69 0.66 1.58 0.19 Table 5 PCDD/Fs concentrations in the solid residues (mg ITEQ kg 1 ) Test 1 2 3 4 5 6 7 8 Fly ashes PCDD 9.5 46.4 41.0 0.4 4.4 1.0 1.1 1.5 PCDF 22.0 100.7 104.7 1.3 16.1 7.0 9.6 4.2 PCDD+PCDF 31.5 147.1 145.8 1.7 20.6 8.0 10.7 5.7 Slags PCDD 0.016 0.037 0.019 0.002 0.002 0.002 – 0.035 PCDF 0.040 0.084 0.041 0.002 0.004 0.002 – 0.066 PCDD+PCDF 0.056 0.120 0.059 0.004 0.007 0.004 – 0.101 G. Mininni et al. / Atmospheric Environment 41 (2007) 8527–8536 8531
- 6. sampling points 1 and 2, boiler ash production rate and the relevant total (not only ITEQ) PCDD/F concentrations. For this purpose PCDD/Fs con- centration in boiler ashes were estimated as 10% of those of filter ashes, according to European Commission BREF document on Waste Incinera- tion (European Commission, 2005; Giugliano et al., 2001, 2002). Total concentrations and mass balance results are reported in Table 6. Positive numbers suggest that a reduction of PCDD/Fs occurs in the device. Since the temperature range in the heat exchanger is not suitable for their destruction, removal of such compounds may likely be explained by their adsorption on the walls of the device or on particles entrapped on surfaces (boiler cleaning was not performed in the full-scale plant during this study). In conclusion, in contrast with previous literature findings, the mass balance evaluation seems to exclude the de novo synthesis in the operating conditions of this experimental campaign. Table 4 shows that the PCDD/Fs removal efficiency of the pollution control devices of the incineration plant (bag filter and wet scrubber) was in the range 77–98%. As expected, at the stack the low chlorinated and more volatile PCDFs homo- logues, such as T4CDF, P5CDF and H6CDF, were found as the predominant forms. 3.3. Polycyclic aromatic hydrocarbons Tables 7 and 8 report total and carcinogenic PAHs concentrations in the flue gas and in the solid residues, respectively. According to the Italian Legislative Decree 133/05 implementing Directive 2000/76 on Waste Incineration, carcinogenic PAHs include: benzo(a)antracene, benzo(b)fluoranthene, benzo(j)fluoranthene, benzo(k)fluoranthene, benzo(a)- pyrene, indeno(123,cd)pyrene, dibenzo(a,h)antracene, dibenzo(a,l)pyrene, dibenzo(a,e)pyrene, dibenzo(a,i)- pyrene and dibenzo(a,h)pyrene. Total PAH also included: acenaftylene, acenaftene, fluorene, fenan- threne, anthracene, fluoranthene, pyrene, crysene and benzo(ghi)perylene. PAHs concentrations in the afterburning chamber were not significantly correlated with temperature, ARTICLE IN PRESS Table 6 Total PCDD/Fs concentrations in the gaseous and solid samples, and mass balance in the heat exchanger Test Afterburning (ng Nm 3 ) Heat exchanger (ng Nm 3 ) Fly ashes (mg kg 1 ) Mass balance in the heat exchanger (inlet–outlet) (mg h 1 ) 1 8618 893.7 1039.4 13.50 2 – 377.0 4915.3 – 3 – 847.0 4897.3 – 4 3087 811.1 69.0 6.94 5 2415 270.6 584.3 4.61 6 1416 105.2 309.7 3.84 7 1670 201.1 416.4 3.78 8 4657 76.8 240.4 10.91 Table 7 Total and carcinogenic PAHs in the raw and flue gases (ng Nm 3 ) Test Afterburning chamber Heat exchanger Stack Total Carcinogenic Total Carcinogenic Total Carcinogenic 1 8866.8 137.4 437.5 54.4 1103.7 18.0 2 – – 240.9 3.2 3479.3 45.9 3 – – 173.4 16.6 997.4 139.8 4 5825.0 1022.1 1668.7 11.4. 2288.2 270.2 5 11389.9 594.5 314.9 13.9 3448.4 498.2 6 4712.8 185.9 516.3 32.0 762.3 59.9 7 3377.0 51.2 407.6 65.5 2460.4 166.3 8 7670.6 24.5 710.1 17.1 4646.1 31.7 G. Mininni et al. / Atmospheric Environment 41 (2007) 8527–8536 8532
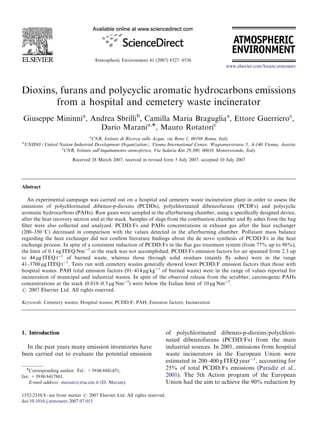
- 7. whereas, as expected, a negative correlation was found with oxygen concentration in the afterburn- ing mixture (Fig. 2). As in the case of PCDD/Fs, also PAHs concen- trations show a sharp decrease after the heat exchanger, but in this case a significant increase is again shown at the stack. This behavior can be explained by a possible stripping of material previously captured in the scrubber, as reported in literature (Benfenati et al., 1991). Concentrations at the stack were anyway well below (100–1000 folds) the current Italian standard (10 mg Nm 3 ) on carcino- genic PAHs. As far as solid residues are concerned (Table 8), comparable concentrations were found in the slags and in the fly ashes. Abundance of heavier compounds (Benzo(a)anthracene, Chrysene and Benzo(b)fluoranthene) was, as expected, higher in the slags (7–20%) than in the fly ashes (3–10%). In order to compare PAHs behavior with that of PCDD/Fs, a similar mass balance between input and output of the heat exchanger was evaluated. In this case, PAH concentrations of boiler ashes were assumed equal to those of fly ashes, considering that slags and fly ashes concentrations were very close (Table 8). In Table 9, the results of the mass balance are reported both for total and for carcinogenic PAHs. Like in the case of PCDD/Fs, mass balance for total PAHs shows always positive numbers, which suggest a probable adsorption on the wall of the heat exchanger. Finally, it must be pointed out that Phenanthrene and Pyrene were the most abundant congeners for the cemetery wastes tests. Samples from hospital wastes generally showed higher percentages of the carcinogenic compounds with respect to those relevant to cemetery wastes. 3.4. Emission factors Emission factors of PCDD/F and PAHs are shown in Tables 10 and 11, respectively. In addition to total emission, the tables also show the contribu- tion of the different emission routes (gaseous and solid). The main contribution of PCDD/F ITEQ emis- sion comes from the fly ashes, which represent 91–98% of total emission in the tests carried out with hospital wastes and 81–87% in those where cemetery wastes were fed. Stack contribution to PCDD/Fs emission is typically below 10%, with exception of test 4 (cemetery waste) where stack contributes for 16% of total emission. In terms of total PCDD/F emission, the tests run with cemetery wastes generally show lower emission factors than those run with hospital wastes. Any- way, even within the same kind of feed, emission factors may vary of about one-order of magnitude. ARTICLE IN PRESS 0 2 4 6 6 8 10 12 0 2 4 8 10 Oxygen % PAHs (µg Nm -3 ) R2 = 0.82 Fig. 2. Correlation between PAHs and oxygen concentration in the afterburning chamber. Table 8 Total and carcinogenic PAHs in the solid residues (mg kg 1 ) Test Slags Fly ashes Total Carcinogenic Total Carcinogenic 1 1165.9 190.5 1398.4 52.4 2 720.7 52.6 466.5 30.9 3 406.5 27.6 2346.5 78.9 4 294.3 58.5 1686.4 128.6 5 1824.1 292.3 1097.9 78.3 6 403.2 73.0 326.0 22.8 7 226.5 33.1 852.9 87.7 8 244.3 21.6 342.7 33.2 Table 9 Mass balance of total and carcinogenic PAHs in the heat exchanger Test Inlet–outlet (mg h 1 ) Total PAHs Carcinogenic PAHs 1 11.82 0.04 2 – – 3 – – 4 10.28 2.81 5 22.40 1.14 6 11.85 0.41 7 6.47 0.17 8 15.99 0.05 G. Mininni et al. / Atmospheric Environment 41 (2007) 8527–8536 8533
- 8. This may reflect the large variability of composition in the feed. For hospital wastes the Dioxin Toolkit provides four classes of PCDD/F emission factors through air and through solid residues, according to the degree of sophistication of the incinerator techno- logy. The four classes span from the uncontrolled, batch type combustion, without an air pollution control system (APCS), up to the high technology, continuous, controlled combustion, with a sophis- ticated APCS in place. If the emission factors reported in Table 10 are compared with those provided by the Dioxin Toolkit, it may be seen that, whereas factors for air emissions are comparable with those of incineration plants of class 4 (continuous combustion with sophisticated APCS), the emission factors for solid residues are of the same order of magnitude of values given for class 3 (controlled, batch type combustion, with good APCS in place). Regarding the PCDD/Fs emissions through the stack, comparison with the data provided by the Italian Agency for the Environmental Protection (ANPA, 2002) shows a difference of at least one- order of magnitude (0.8 mg ITEQ t 1 against a range 2.3–44 mg ITEQ t 1 measured in this study). To this purpose, it must be pointed out that data provided by ANPA were mostly based on European and international inventories, due to the lack of a large database on the Italian situation. In addition, the high emission factors found in this work may be partially ascribed to the not fully optimized condi- tions of the incinerator, as suggested by CO data in Table 3. As far as the carcinogenic PAH emission is concerned, Table 11 shows that emission factors vary in a smaller range with respect to PCDD/Fs emission factors and that there is no significant difference between the two kinds of feed. Major contributions come from stack and fly ashes, with shares spanning from 11% up to 79% for stack and from 18% up to 77% for fly ashes. A comparison of PAH emission data with litera- ture findings lead to contrasting results. A strong difference is evidenced with the work of Lee et al. (2002) which in the study on the emission of PAHs from mechanical grate and fixed bed incinerators report concentrations and emission factors for stack flue gases much higher than those reported in this study, up to 2–3-order of magnitude, even excluding the high concentration of Naphthalene (not con- sidered in this study). On the other hand, slightly higher (one-order of magnitude) or comparable concentrations were found in the fly ashes and bottom ashes, respectively. In the study of Wheatley and Sadhra (2004), the same PAHs congeners evaluated in this work (excluding some heavier compounds) were analyzed in the bottom ashes produced by a modern, pulsed hearth hospital waste incinerator. In this case, ARTICLE IN PRESS Table 10 PCDD/Fs emission factors in the main output streams (mg ITEQ t 1 of burned waste) Test Slags Boiler ash Fly ashes Stack Total 1 10.1 11.1 786.0 2.9 804 2 21.6 49.1 3707.2 5.5 3783 3 10.6 45.3 3733.4 5.2 3795 4 0.8 0.5 41.0 8.2 51 5 1.2 6.5 492.8 44.0 544 6 0.7 2.5 214.7 7.7 226 7 – 3.1 254.6 24.7 281 8 18.1 1.8 146.6 2.3 169 Table 11 Total and carcinogenic PAHs emission factors in the main output streams (mg kg 1 of burned waste) Test Slags Boiler ash Fly ashes Stack Total Total Carc. Total Carc. Total Carc. Total Carc. Total Carc. 1 209.9 0.03 4.93 0.18 34.92 1.31 11.00 0.18 260.7 1.71 2 129.7 0.01 1.56 0.10 11.76 0.78 41.48 0.55 184.5 1.44 3 73.2 0.00 7.30 0.25 60.10 2.02 15.64 2.19 156.2 4.46 4 53.0 0.01 4.68 0.36 40.15 3.06 34.76 4.10 132.6 7.53 5 328.3 0.05 3.47 0.25 26.31 1.88 56.40 8.15 414.5 10.32 6 72.6 0.01 1.02 0.07 8.74 0.61 8.94 0.70 91.3 1.40 7 40.8 0.01 2.46 0.25 20.25 2.08 38.43 2.60 101.9 4.94 8 44.0 0.01 1.11 0.11 8.83 0.86 55.19 0.38 109.1 1.34 G. Mininni et al. / Atmospheric Environment 41 (2007) 8527–8536 8534
- 9. comparable concentrations and emission factors were found. Finally it must be pointed that, in spite of incomplete optimization of the combustion process, cumulative (air and solid residues) emission factors of total PAHs (91–414 mg kg 1 of waste) fall in the range of values reported by the Italian ANPA (50–500 mg kg 1 ) for incineration of municipal and industrial wastes (ANPA, 2002). 4. Conclusions The experimental campaign on hospital and cemetery wastes incineration provided useful data on PCDD/Fs and PAHs emission, which may increase the reliability of emission databases on the incineration of this class of waste materials. PCDD/Fs emission factors for air (2.3–44mg ITEQ t 1 of burned waste) were comparable with those provided by the Dioxin Toolkit for incineration plants of class 4 (continuous combustion with sophisticated APCS). On the other hand, the emission factors through solid residues (mainly fly ashes) spanned from 41 up to 3700mg ITEQ t 1 of waste and can be broadly considered of the same order of magnitude of values given for class 3 (controlled, batch type combustion, with good APCS in place). In spite of the fact that the APCS included a bag filter and a scrubber, PCDD/Fs concentration at the stack was always higher than the limit of 0.1 ng ITEQ Nm 3 set by the European Directive 2000/76. Similarly, PCDD/Fs concentrations in the fly ashes were generally higher than the limit of 10 mg ITEQ kg 1 for disposal in hazardous waste landfill sites provided by the European Directive 99/31. The PCDD/Fs mass balance regarding the heat exchanger did not confirm the hypothesis of the de novo formation of PCDD/F occurring during the heat exchange process. PAH concentration, after a sharp decrease from the afterburning chamber to the heat exchanger, showed an increase at the stack probably due to releases of such compounds from the scrubber compo- nents. PAH total emission factors (91–414 mgkg 1 of burned waste) were in the range of values reported by the Italian Agency for Environmental Protection for incineration of municipal and industrial wastes. In spite of the observed increase after the heat exchanger, carcinogenic PAHs concentrations at the stack (0.018–0.5 mg Nm 3 ) were below the Italian limit of 10 mg Nm 3 . Acknowledgements The research project was funded by Structural Funds managed by the Italian Ministry of the Research and Science. The authors would like to thank the kind assistance of Rocco Antonacci in the experimental tests on the full-scale plant and of Massimo Bianchini during laboratory activities in micropollutants determination. References Akimoto, Y., Aoki, T., Nito, S., Inouye, Y., 1997. Oxygenated polycyclic aromatic hydrocarbons from MSW incinerator fly ash. Chemosphere 34, 263–273. Ana, M., Callen, M.S., Garcia, T., 1999. Polycyclic aromatic hydrocarbons and organic matter associated to particulate matter emitted from atmospheric fluidized bed coal combus- tion. Environmental Science and Technology 33, 3177–3184. ANPA, 2002. Manuale dei fattori di emissione (2002 factor emission manual). Roma, Italy. Benfenati, E., Mariani, G., Fanelli, R., Zuccotti, S., 1991. ‘‘De novo’’ synthesis of PCDD, PCDF, PCB, PCN, and PAH in a pilot incinerator. Chemosphere 22, 1045–1054. CEN, 1996. Stationary source emissions. Determination of the mass concentration of PCDD/Fs. Reports EN 1948-1–3. EPA (US Environmental Protection Agency), 1990. Hospital Waste Combustion Study. Data Gathering phase. Final Draft. US Government Printing Office, Washington, DC. EPA (US Environmental Protection Agency), 1994. Estimating Exposure to Dioxin-like Compounds. External Review Draft, vols. 1–3. US Government Printing Office, Washington, DC. European Commission, 1999. Council Directive 1999/31 of 26 April 1999 on the landfill of waste. Official Journal of the European Communities 16/7/1999, L 182/1–L 182/19. European Commission, 2000. Directive 2000/76 of the European Parliament and of the Council of 4 December 2000 on the incineration of wastes. Official Journal of the European Communities 28/12/2000, L 332/91–L 332/111. European Commission IPPC Bureau, 2005. Draft Reference Document on the best available techniques for waste incineration, Final Draft May 2005. Seville, Spain. Giugliano, M., Cernuschi, S., Grosso, M., Aloigi, E., Miglio, R., 2001. The flux and mass balance of PCDD/F in a MSW incineration full-scale plant. Chemosphere 43, 743–750. Giugliano, M., Cernuschi, S., Grosso, M., Miglio, R., Aloigi, E., 2002. PCDD/F mass balance in the flue gas cleaning units of a MSW incineration plant. Chemosphere 46, 1321–1328. Grochowalski, A., 1998. PCDDs and PCDFs concentration in combustion gases and slags from incineration of hospital wastes in Poland. Chemosphere 37, 2279–2291. Gullett, B., Bruce, K., Beach, L., 1990. The effect of metal catalysts on the formation of polychlorinated dibenzo-p- dioxin and polychlorinated dibenzofuran precursors. Chemo- sphere 20, 1945–1952. Kolenda, J., Gass, H., Wilken, M., Jager, J., Zeschmar-Lahl, B., 1994. Determination and reduction of PCDD/F emissions from wood burning facilities. Chemosphere 29, 1927–1938. ARTICLE IN PRESS G. Mininni et al. / Atmospheric Environment 41 (2007) 8527–8536 8535
- 10. Lee, W.J., Liow, M.-C., Tsai, P.-J., Hsieh, L.-T., 2002. Emission of polycyclic aromatic hydrocarbons from the medical waste incinerators. Atmospheric Environment 36, 781–790. Lindner, G., Jenkins, A.C., McCormack, J., Adrian, R.C., 1990. Dioxins and furans in emissions from medical waste incinerators. Chemosphere 20, 1793–1800. Liow, W.J., Lee, W.-J., Chen, S.-J., Wang, L.-C., Chung, C.-H., Chen, J.H., 1997. Emission of polycyclic aromatic hydro- carbons from the medical waste incinerators. Journal Aerosol Science 28 (Suppl. 1), 549–550. Mariani, G., Benfenati, E., Fanelli, R., 1990. Concentrations of PCDD and PCDF in different points of a modern refuse incinerator. Chemosphere 21, 507–517. Mascolo, G., Lotto, V., Spinosa, L., Mininni, G., Bagnolo, G., 1999. Influence of failure modes on PAH emission during lab-scale incineration. Environmental Engineering Science 16 (4), 287–292. Mininni, G., Lotito, V., Spinosa, L., Guerriero, E., 2000. Influence of organic chlorine on emissions from sludge incineration by pilot fluidized bed furnace. Water Science and Technology 42, 243–250. Paradiz, B., Dilara, P., De Santi, G.F., 2001. Dioxins emissions in accession countries and the JRC emission-PECO project B. In: Proceedings of the Conference Dioxins in the air. November 19–20, 2001, Bruges, The Netherlands. Pohlandt, K., Marutzky, R., 1994. Concentration and distribu- tion of polychlorinated dibenzo-p-dioxins (PCDD) and polychlorinated dibenzofurans (PCDF) in wood ash. Chemo- sphere 28, 1311–1314. QuaX, U., Fermann, M., Broker, G., 2004. The European dioxin air emission inventory project––final results. Chemosphere 54, 1319–1327. Salthammer, T., Klipp, H., Peek, R.D., Marutzky, R., 1995. Formation of polychlorinated dibenzo-p-dioxins (PCDD) and polychlorinated dibenzofurans (PCDF) during the combus- tion of impregnated wood. Chemosphere 30, 2051–2060. Stanmore, B.R., Clunies-Ross, C., 2000. An empirical model for the de novo formation of PCDD/F in medical waste incinerators. Environmental Science and Technology 34, 4538–4544. Stieglitz, L., Vogg, H., Zwick, G., Beck, J., Bautz, H., 1990. On formation conditions of organohalogen compounds from particulate carbon of fly ash. Chemosphere 23, 1255–1264. UNEP, 2005. Standardized Toolkit for Identification and Quantification of Dioxin and Furan Releases. Geneva, Switzerland. Unichim, 1988. Metodo 825: Campionamento e determinazione di microinquinanti organici. Roma, Italy. Wagner, J., Green, A., 1993. Correlation of chlorinated organic compound emissions from incineration with chlorinated organic input. Chemosphere 26, 2039–2045. Walker, B.L., Cooper, C.D.J., 1992. Production of polycyclic aromatic hydrocarbons in chlorine-containing environments. Air Waste Management Association 42, 784–791. Wang, J., Richter, H., Howard, J.B., Levendis, Y.A., Carlson, J., 2002. Polynuclear aromatic hydrocarbons and particulate emissions from two-stage combustion of polystyrene: the effect of the secondary furnace (afterburner) temperature and soot filtration. Environmental Science and Technology 36, 797–808. Wheatley, A.D., Sadhra, S., 2004. Polycyclic aromatic hydro- carbons in solid residues from waste incineration. Chemo- sphere 55, 743–749. Wheatley, L., Levendis, Y.A., Vouross, P., 1993. Exploratory study on the combustion and PAH emissions of selected municipal, waste plastics. Environmental Science and Tech- nology 27, 2885–2895. ARTICLE IN PRESS G. Mininni et al. / Atmospheric Environment 41 (2007) 8527–8536 8536