SlideShare a Scribd company logo
1 of 111
The Eight Stages of Building Commitment
Post 2 of 4 in the Commitment series
http://www.connerpartners.com/frameworks-and-
processes/the-eight-stages-of-building-commitment
In the early ’80s, while involved in research to identify patterns
of change-related success and
failure, I learned that the winners and losers in this arena
demonstrated very different levels of
resolve. As a result, I developed the following model, which
describes how and when people
become committed to major new organizational requirements.
(C lick here to download a
printable worksheet of the Commitment Model to help you
identify a person’s or group’s level of
commitment.)
The vertical axis represents the degree of support for the new
mindsets and behaviors, and the
horizontal axis reflects the passage of time. The model consists
of three developmental phases—
Preparation, Acceptance, and Commitment—and the stages
unique to each phase. Each stage
represents a juncture critical to the development of commitment
to change. A positive perception
of change may stall (depicted by downward arrows) or increase
(represented by an advance to
the next stage). In addition, as people learn more about the
change and what it will require, they
may return to earlier stages in the process. The successful
transition through a particular stage
serves as the basis for experiencing the next stage.
http://www.connerpartners.com/series/commitment-2
http://www.connerpartners.com/frameworks-and-processes/the-
eight-stages-of-building-commitment
http://www.connerpartners.com/frameworks-and-processes/the-
eight-stages-of-building-commitment
http://connerpartners.com/frameworks-and-processes/patterns-
order-beneath-the-confusion
http://connerpartners.com/uncategorized/glossary
http://connerpartners.com/wp-
content/uploads/2011/02/Commitment_Brochure.pdf
http://connerpartners.com/frameworks-and-processes/patterns-
order-beneath-the-confusion
http://connerpartners.com/frameworks-and-processes/patterns-
order-beneath-the-confusion
Preparation Phase
The Preparation Phase forms the foundation for later
development of either support of or
resistance to the change.
There are two stages in the Preparation Phase:
Stage I: Contact
Stage I is the first encounter individuals have with the fact that
a change is taking place in the
organization that will require them to shift their behavior and/or
thinking. Methods for delivering
the first contact message can vary. There is a wide range of
options including memos, staff
meetings, personal contact, and other mechanisms.
Regardless of the method, this first stage in the commitment
process is intended to result in
awareness that a change has taken place or may occur in the
future. Since momentum and critical
mass of commitment is essential to change success, careful
attention should be given to how
early contact (as well as later stages) will begin to promote the
right energy movement toward
realization.
Contact efforts, though, do not always produce awareness. It’s
important to separate contact
efforts from people being aware of change…it’s dangerous to
assume contact and awareness are
synonymous. Sponsors and change agents are often frustrated
when, after many meetings and
memos about an initiative, some targets either are not prepared
for the change or react with total
surprise when it begins to affect them.
There are two possible outcomes for the Contact Stage:
Stage II: Awareness of Change
Awareness is established successfully when individuals realize
that modifications affecting them
have occurred or are pending. It requires that initial
communications about the change reach the
desired audiences and convey the message clearly.
This awareness, however, does not mean people have a complete
understanding of how the
change will affect them. They may not have an accurate picture
of the scope, nature, depth,
implications, or even the basic intent of the change. For
instance, targets may perceive that a
change is coming without knowing the specific ways they will
need to alte r their mindset and
behaviors. Before targets can progress toward acceptance,
awareness must be developed into a
general understanding of the change’s implications.
http://connerpartners.com/frameworks-and-processes/resistance-
to-change
http://connerpartners.com/uncategorized/glossary
http://connerpartners.com/roles-and-
responsibilities/understanding-the-key-roles-in-significant-
change
http://connerpartners.com/roles-and-
responsibilities/understanding-the-key-roles-in-significant-
change
http://connerpartners.com/uncategorized/glossary
http://connerpartners.com/how-challenging-is-the-
change/manage-intent-to-deliver-on-promises-and-minimize-
disappointment
There are two possible outcomes for the Awareness Stage:
Phase
Acceptance Phase
The Acceptance Phase marks passage over the Disposition
Threshold. This is an important
momentum and critical mass milestone; people shift from seeing
the change as something “out
there,” to seeing it as having personal relevance. This
perspective enables them to make
decisions about accepting or not accepting their part in the
change.
People often engage in individual activities designed to move
themselves across this threshold in
order to proceed from awareness to understanding. They ask
questions, pose c hallenges, seek
additional information, and make inferences in an effort to
clarify their picture of the change.
Sometimes leaders wrongly interpret this behavior as resistance
to the change initiative.
Although it is possible for people to use endless questions and
challenges as part of their
resistance strategy, true resistance to the specific change at
hand (rather than to the notion of
change in general) can be manifested only when people
understand it well enough to be able to
formulate an informed opinion.
There are two stages of the Acceptance Phase:
Stage III: Understand the Change
In Stage III, people show some degree of comprehension of the
nature and intent of the change
and what it may mean for them. As they learn more about the
initiative and the role(s) they are
likely to play, people begin to see how it will affect their work
and how it will touch them
personally. These insights enable them, for the first time, to
judge the change.
Each person’s judgment is influenced by his or her own
cognitive and emotional filter systems—
the unique set of lenses that he or she uses to view the world. In
addition, change of any
significance usually has multiple aspects to it, and may produce
both positive and negative
reactions at the same time. For example, a target may have a
negative view of a new company
policy regarding relocation every four years but sees positive
benefit in the level of job security
he or she would experience. People combine these positive and
negative reactions to form an
overall judgment of the change.
There are two possible outcomes for the Understanding Stage:
the change[1]
sents a decision not to
support the change
http://connerpartners.com/frameworks-and-processes/patterns-
order-beneath-the-confusion
http://connerpartners.com/wp-
includes/js/tinymce/plugins/paste/pasteword.htm?ver=3241-
1141#_ftn1
Stage IV: Positive Perception
In Stage IV, people decide whether to support or oppose the
change. The forming of an opinion
about change is not done in isolation—people typically weigh
the costs and benefits of the
change against the costs and benefits of other alternatives,
including doing nothing. Ideally, the
benefits of a change to an individual so clearly outweigh the
benefits of any alternative course of
action that it requires little thought to decide to move forward.
However, this is not typically the
case. In many organizational change situations, the benefits of
moving forward are only
marginally more positive than the benefits of the best
alternative course of action. In some
changes, the path forward has such significant costs associated
with it that the individual reaches
an overall positive perception only because all of the
alternatives are worse.
For instance, a leader may face a decision to lay off a large
number of people from the
organization. He is likely to see this as a tremendously difficult
and costly move. However, if he
perceives that the alternative is the sale of the organization to a
competitor who would be even
more ruthless in the downsizing efforts, he may ultimately reach
a positive perception about
moving forward.
Positive Perception is an important stage in the process of
building commitment, but at this point
the change is still rather theoretical. To reach true commitment,
people must begin to try out the
new way of operating—they must alter their mindset and
behavior.
There are two possible outcomes of the Positive Perception
Stage:
thinking and behaving
and behaviors
Commitment Phase
The Commitment Phase marks passage over the Action
Threshold. In this phase, the perceptions
that have been created in the Acceptance Phase result in actual
commitment. This is a critical
step in the building of momentum and critical mass.
There are many situations in which people will say that they
view a change as positive. However,
they will not actually take the first steps to alter their behavior
or mindset. There can be several
reasons for this, including:
the new behavior
the new behavior
Commitment occurs when people see a change as more positive
than negative and take action
accordingly. There are four stages in the Commitment Phase:
http://connerpartners.com/how-challenging-is-the-
change/future-shock-the-scourge-of-organizational-change
Stage V: Experime ntation
In Stage V, individuals take action to test a change. This is the
first time people actually try out
the change and acquire a sense of how it might affect their work
routine. This stage is an
important signpost that commitment building has begun,
although greater support is possible.
The critical importance of this stage is that no matter how
positively people view a change prior
to engaging with it, their actual experience with it will reveal a
number of small or large
surprises. Some of these may be positive, but others may
involve unanticipated problems that
have significant negative consequences. If problems become too
costly, pessimism regarding the
change will increase and may reach the “checking-out” level.
This occurs when early,
uninformed optimism for a project transforms into informed
pessimism, and the individual’s
original positive judgment shifts to negative.
Because of the inevitability of surprises, some degree of
pessimism is unavoidable during
change. Nevertheless, the confidence of those involved in a
change increases as a re sult of
resolving such problems. An environment that encourages the
open discussion of concerns tends
to solve problems, promote ownership, and build commitment to
action. As these problems are
resolved, a more realistic level of conviction toward the change
builds. This conviction advances
commitment to the Adoption level.
There are two possible outcomes for the Experimentation Stage:
the new mindsets and
behaviors
new mindsets and behaviors
Stage VI: Adoption
Stage IV, Adoption, is reached after individuals have
successfully navigated the initial trial
period. The dynamics here are similar to that of the
Experimentation Stage. Both stages serve as
tests in which the individual and the organization assess the
cost and benefits of the change.
Longer-term trials can reveal logistic, political, and economic
problems with the new way of
operating that can lead sponsors, agents, and/or targe ts to
question the long-term viability of the
new approach and potentially make a decision to terminate the
change.
The differences between the Experimentation and Adoption
stages are important, even though
their dynamics are similar. Experimentation focuses on initial,
entry problems, and adoption
centers on in-depth, longer-term problems. The former is a
preliminary test of the change. The
latter tests the ongoing implications of the change.
Experimentation asks, “Will this change
work?” Adoption asks, “Does this change fit with who I am as a
person/who we are as an
organization?”
Although the level of time and resources necessary to reach
Adoption is great, a change project
in this stage is still being evaluated and can possibly be
stopped. If the change is successful after
this lengthy test period, it is in a position to become the
standard new way of operating.
There are two possible outcomes for the Adoption Stage:
established as a standard
trial
Stage VII: Institutionalization
Stage VII reflects the point at which people no longer view the
change as tentative. They
consider it standard operating procedure.
As part of the institutionalization process, the organizational
structure may be altered to
accommodate new ways of operating, and rewards and
punishments implemented to maintain
new mindsets and behaviors. What was once a change requiring
substantial sponsor
legitimization has become part of the organizational routine that
is monitored by managers.
The move from Adoption to Institutionalization is a significant
one, and a double-edged sword.
The threshold that is crossed here is that of “reversibility.” O
nce a change is institutionalized, it
becomes the new status quo. Ending an institutionalized pattern
that is ingrained into the fiber of
an organization is extremely difficult.
This stage reflects the highest level of commitment that can be
achieved by an organization—the
level above it, internalization, can only be achieved by
individuals who make a personal choice
to go there.
Although institutionalization is sometimes all that is required to
achieve the organization’s goals,
it has some potential problems. If a change has been
institutionalized but not internalized, those
affected may be motivated to adhere to new procedures
primarily to comply with organizational
directives. Their compliance is achieved by using organizational
rewards and punishments to
motivate them to conform despite their own private beliefs
about the change. I f their perception
of the change is generally negative, but they have chosen to go
forward because the costs of not
doing so are prohibitively high, they will likely only mimic
acceptable behavior. They learn to
say and do the “right” things, but their actions will not reflect
their true perspective. Because
their mindset (priorities and frames of reference) does not align
with their behavior, a great deal
of managerial pressure will be required to ensure the ongoing
presence of the desired behavior.
The success of change does not always depend on the target’s
personal investment. Some
projects require only that targets “do as they are told.”
However, as the pace and complexity of
change escalates, producing more turbulence in the workplace,
many organizations have
modified their views about workers needing to understand or
support organizational changes.
Forcing change implementation often results in a halfhearted
effort without a full return on
investment. Institutionalized change, as powerful as it is, only
delivers the target’s behavior, not
http://connerpartners.com/uncategorized/glossary
his or her mind and heart. This doesn’t mean that
institutionalization isn’t the way to go
sometimes because there are situations where leaders have to
engage unpopular change. The
point is to be aware of the benefits and limitations of
institutionalized change.
Stage VIII: Inte rnalization
Stage VIII represents the highest level of commitment an
individual can demonstrate toward an
organizational change. It reflects an internal motivation in
which individual beliefs and desires
are aligned with those of the organization, and there is a high
level of consistency between an
individual’s mindset and behavior.
While an organization can legislate the institutionalization of a
change, internalization requires
the active cooperation of each individual. At this last stage,
people “own” the change; they
demonstrate a high level of personal responsibility for its
success. They serve as advocates for
the new way of operating, protect it from those who would
undermine it, and expend energy to
ensure its success. These actions are often well beyond what
could be created by any
organizational mandate.
Enthusiasm, high-energy investment, and persistence
characterize internalized commitment, and
it tends to become infectious. Targets who have internalized a
change often cannot be
distinguished from sponsors and advocates in their devotion to
the task and their ability to
engage others in the change effort.
The time needed to move through the Experimentation,
Adoption, Institutionalization, and
Internalization phases will vary according to the individual, the
organization, and the nature of
the change project. The lines can be relatively clear or
somewhat blurry depending on the
situation. If a change is mandated, it can become
institutionalized very quickly (but, as
mentioned earlier, at a high cost of monitoring compliance). In
other cases, institutionalization
unfolds more gradually.
As people gain experience with the new way of operating, find
ways to refine and improve it,
and adjust to its long-range impact and requirements, the
change gradually becomes a natural
part of the organizatio n’s culture or expected pattern of
behavior. Internalization can begin very
early in a change if the new way of operating is strongly aligned
wit h individual beliefs and
assumptions; it can also emerge along the way as individuals
begin to see the advantages of the
new approach. In some cases, it can fail to surface at all.
Understanding the steps and sequence for building commitment
is a powerful advantage for
change practitioners when building momentum and critical mass
for major organizational
change.
http://connerpartners.com/uncategorized/glossary
http://connerpartners.com/frameworks-and-processes/whats-
culture-got-to-do-with-it
http://connerpartners.com/uncategorized/glossary
Employee
Engagement
Research Update
Beyond the numbers:
A practical approach for
individuals, managers, and executives
January 2013
© 2013 by BlessingWhite, A Division of GP Strategies. All
rights reserved. Employee Engagement Research Update 01/13
rev2. Copying
and distribution — both printed and electronic — is prohibited
without express written permission from BlessingWhite,
Princeton, NJ, USA.
908-904-1000. In Europe, tel: +44 (0) 1628 660397. For
distribution requests please contact [email protected]
Contents
This report is provided as part of BlessingWhite
Intelligence, a series of reports on business and
workplace issues. You can explore other topics by
visiting www.blessingwhite.com/research.
Executive summary . . . . . . . . . . . . . . . . . . . . . . . . . . . . . . . . .
. . . . . . . . . . . . . . . . 1
What is engagement anyway? . . . . . . . . . . . . . . . . . . . . . . . . .
. . . . . . . . . . . . . . . 3
Findings . . . . . . . . . . . . . . . . . . . . . . . . . . . . . . . . . . . . . . . . .
. . . . . . . . . . . . . . . 5
Intent to stay (Retention) . . . . . . . . . . . . . . . . . . . . . . . . . . . .
. . . . . . . . . . . . . . . . . 7
Recommendations . . . . . . . . . . . . . . . . . . . . . . . . . . . . . . . . . .
. . . . . . . . . . . . . . 25
About this report . . . . . . . . . . . . . . . . . . . . . . . . . . . . . . . . . .
. . . . . . . . . . . . . . . 32
1© 2013 by BlessingWhite, A Division of GP Strategies.
Princeton, NJ. All rights reserved. Employee Engagement
Research Update 01/13.
In early 2011 BlessingWhite published a comprehensive report
examining the dynamics of engagement
around the world. The report generated a lot of interest with
over 30,000 people downloading it from
the BlessingWhite website. We are pleased to provide an update
to that report based on data collected
over the summer and autumn of 2012.
This Employee Engagement Report research update reflects
online survey responses of over 7,000
individuals from around the world. Details on our methodology
and the global respondent profile
appear in About this Report on page 32.
It further complements the methodology and employee
engagement best practices we explore in our
October 2012 book The Engagement Equation: Leadership
Strategies for an Inspired Workforce. The
recommendations in this report reflect the approaches that we
explored in the interviews for the book as
well as in client work.
Executive summary
2© 2013 by BlessingWhite, A Division of GP Strategies.
Princeton, NJ. All rights reserved. Employee Engagement
Research Update 01/13.
Key findings
the world.
stable. While engagement and intent to
stay are directly correlated, the specific dynamics of retention
appear to vary significantly from one
region of the world to the next.
– as
people grow more experienced and
vested in their work, or more senior in the organization,
engagement increases.
western economies, large gaps in
engagement levels between men and women are apparent in
India, the GCC and South America.
organization’s priorities, getting feedback,
having opportunities to use skills, and career development
remain at the top of the list for a majority
of employees. What these factors mean in practice, however,
can be deeply personal.
age of the workforce trust senior
leaders and managers. Trust in managers
remains predictably higher than trust in executives.
Recommendations
Following on from our 2011 report, and based on these more
recent observations, we recommend that:
tions gain a firm grasp on how engagement can
drive their business results in very specific
terms, and adopt a common definition of engagement which
makes it something tangible to business
outcomes.
o business
strategy by increasing communication
and clarity, as well as providing an inspiring vision for the
future.
workforce, clarifying who is accountable
for what and how best to contribute to a culture of employee
engagement.
long-term employee aspirations with the
organization’s talent needs of tomorrow.
letting the Disengaged monopolize their
efforts.
3© 2013 by BlessingWhite, A Division of GP Strategies.
Princeton, NJ. All rights reserved. Employee Engagement
Research Update 01/13.
What is engagement anyway?
The term “employee engagement” means different things to
different organizations. Some equate it with
job satisfaction, which unfortunately can reflect a transactional
relationship that is only as good as the
organization’s last round of perks or bonuses. Others measure
engagement by gauging employees’
emotional commitment to their organization. Although
commitment is an important ingredient, it is only
one piece of the engagement equation.
While organizations are keen to maximize the contribution of
each individual toward corporate
imperatives and metrics, individual employees need to find
purpose and satisfaction in their work.
Consequently, BlessingWhite’s engagement model focuses on
individuals’:
We believe that aligning employees’ values, goals, and
aspirations with those of the organization is the
best method for achieving the sustainable employee engagement
required for an organization to thrive.
Full engagement represents an alignment of maximum job
satisfaction (“I like my work and do it well”)
with maximum job contribution (“I help achieve the goals of my
organization”).
Engaged employees are not just committed. They are not just
passionate or proud. They have a line-of-
sight on their own future and on the organization’s mission and
goals. They are enthused and in gear,
using their talents and discretionary effort to make a difference
in their employer’s quest for sustainable
business success.
Full engagement occurs at the
alignment of maximum job satisfaction
and maximum job contribution.
JOB
4© 2013 by BlessingWhite, A Division of GP Strategies.
Princeton, NJ. All rights reserved. Employee Engagement
Research Update 01/13.
Five levels of employee engagement
The index we use to determine
engagement levels contains items that
reflect the two axes of contribution
and satisfaction. By plotting a given
population against the two axes, we
identify 5 distinct employee segments.
Level Description
The Engaged:
High contribution
and high
satisfaction
These employees are at the apex where personal and
organizational interests align.
They contribute fully to the success of the organization and find
great satisfaction in their
work. They are known for their discretionary effort and
commitment. When recruiters
call, they cordially cut the conversation short. Organizations
need to keep them
Engaged, because they can transition over time to any of the
three adjacent segments,
a move that would likely impact workforce morale and the
bottom line.
Almost Engaged:
Medium to high
contribution and
satisfaction
A critical group, these employees are among the high
performers and are reasonably
satisfied with their job. They may not have consistent “great
days at work,” but they
know what those days look like. Organizations should invest in
them for two reasons:
They are highly employable and more likely to be lured away;
they have the shortest
distance to travel to reach full engagement, promising the
biggest payoff.
Honeymooners &
Hamsters:
High satisfaction
but low
contribution
Honeymooners are new to the organization or their role – and
happy to be there. They
have yet to find their stride or clearly understand how they can
best contribute. It should
be a priority to move them out of this temporary holding area to
full alignment and
productivity.
Hamsters may be working hard, but are in effect spinning their
wheels, working on
non-essential tasks, contributing little to the success of the
organization. Some may even
be hiding out, curled up in their cedar shavings, content with
their position (“retired in
place”). If organizations don’t deal with them, other employees
will have to work harder
and may grow resentful.
Crash & Burners:
High contribution
but low
satisfaction
Disillusioned and potentially exhausted, these employees are
top producers who aren’t
achieving their personal definition of success and satisfaction.
They can be bitterly vocal
that executives are making bad decisions or that colleagues are
not pulling their weight.
They may leave, but they are more likely to take a breather and
work less hard, slipping
down the contribution scale to become Disengaged. When they
do, they often bring
down those around them.
The Disengaged:
Low contribution
and satisfaction
Most Disengaged employees didn’t start out as bad apples. They
still may not be. They
are the most disconnected from organizational priorities, often
feel underutilized, and
are clearly not getting what they need from work. They’re likely
to be skeptical, and
can indulge in contagious negativity. If left alone, the
Disengaged are likely to collect
a paycheck while complaining or looking for their next job. If
they can’t be coached or
aligned to higher levels of engagement, their exit benefits
everyone, including them.
The
Engaged
The
Almost
Engaged
The
Honeymooners
& Hamsters
The Crash &
Burners
The
Disengaged
5© 2013 by BlessingWhite, A Division of GP Strategies.
Princeton, NJ. All rights reserved. Employee Engagement
Research Update 01/13.
Engagement levels by region – 2011 vs. 2012
Findings
In 2012 we witnessed some fairly significant shifts in overall
engagement levels within three regions
of the study, with North America, India and China all seeing
sizeable gains. While no region saw a
decrease, Europe and Australia/NZ were essentially flat.
Shifts aside, China remains the region with the lowest levels of
engagement and India the highest – a
long-standing conclusion that highlights the cultural differences
between these two countries and dispels
the usefulness of the BRICS1 nomenclature in developing
human capital strategies.
In South America and the GCC – two regions we did not include
in previous studies – our first
benchmark would indicate:
ent of 37% (similar to Australia) for
South America (predominantly Brazil);
1 BRICS, originally “BRIC” before the inclusion of South
Africa in 2010, is the title of an association of emerging
national
economies: Brazil, Russia, India, China and South Africa.
33%
30%
37%
17%
36%
0
0
40%
31%
42%
22%
37%
37%
33%
0%
5%
10%
15%
20%
25%
30%
35%
40%
45%
NA
EU
India
China
Aus/NZ
South
America
Persian
Gulf
2011
2012
+7pts.
+1pts.
+5pts.
+5pts.
+1pt
GCC
6© 2013 by BlessingWhite, A Division of GP Strategies.
Princeton, NJ. All rights reserved. Employee Engagement
Research Update 01/13.
Looking more precisely at the distribution of engagement levels
in each of these regions, we also see
differences in profiles:
Engagement levels by region
GCC
7© 2013 by BlessingWhite, A Division of GP Strategies.
Princeton, NJ. All rights reserved. Employee Engagement
Research Update 01/13.
The strong correlation between engagement and retention is
well understood. “Intent to stay,” or an
employee’s stated desire to remain with their current employer,
is a strong predictor of actual turnover.
It is also an indication of how strongly committed an employee
is to their current employer’s success.
Globally, 60% of all employees report that, given the choice,
they plan on remaining with their current
organization for the next 12 months. However, this number
jumps to 81% among engaged employees
but drops to 23% among the disengaged.
Naturally, those employees that score higher on the satisfaction
scale (Engaged, Almost Engaged,
Honeymooners and Hamsters) are most likely to plan on
staying. But many factors may influence
intent to stay and turnover, so the relationship is not as
straightforward as “the engaged stay and
the disengaged leave.” For instance, it may be perplexing that
2% of Engaged employees intend on
leaving. Conversely, the fact that 23% of the Disengaged plan
on staying presents its own issues which
we will discuss in the detailed recommendations starting on
page 25. These overall numbers are similar
to previous studies (82% for Engaged and 27% for Disengaged
answering “Yes, definitely” in 2011).
Intent to stay (Retention)
Intent to stay – global responses by engagement level
2%
5%
17%
9%
32%
17%
33%
46%
36%
46%
81%
63%
36%
55%
23%
0%
10%
20%
30%
40%
50%
60%
70%
80%
90%
100%
En
ga
ge
d
Al
mo
st
En
ga
ge
d
Cr
as
h
a
nd
Bu
rn
er
s
Ho
ne
ym
oo
ne
rs
an
d
H
am
ste
rs
Di
se
ng
ag
ed
Yes,
definitely
Probably
No
Way
8© 2013 by BlessingWhite, A Division of GP Strategies.
Princeton, NJ. All rights reserved. Employee Engagement
Research Update 01/13.
When looking at intent to stay across regions, the dynamics of
engagement and economic opportunity
start to emerge. While China has relatively low levels of
engagement, intent to stay is high (and has
risen since 2011). Conversely, in South America we observe a
high level of expected mobility and a
very large percentage of employees hedging their bets.
Intent to stay by region
Region Year No Way Probably Yes, definitely
Australia/New Zealand
2011 15% 34% 51%
2012 12% 26% 62%
North America
2011 13% 32% 56%
2012 12% 33% 55%
India
2011 8% 33% 59%
2012 4% 28% 68%
Europe
2011 14% 38% 48%
2012 12% 37% 51%
South America
2011 – – –
2012 9% 48% 43%
GCC
2011 – – –
2012 13% 37% 50%
China
2011 16% 29% 55%
2012 12% 21% 67%
Global
2011 10% 29% 61%
2012 10% 30% 60%
4%
12%
12%
12%
12%
13%
9%
28%
21%
26%
33%
37%
37%
48%
68%
67%
62%
55%
51%
50%
43%
0%
10%
20%
30%
40%
50%
60%
70%
80%
90%
100%
India
China
Australia
/
New
Zealand
North
America
Europe
Persian
Gulf
South
America
Yes,
definitely
Probably
No
Way
GCCGCCGCC
9© 2013 by BlessingWhite, A Division of GP Strategies.
Princeton, NJ. All rights reserved. Employee Engagement
Research Update 01/13.
Reasons for staying or leaving
The general trend reported previously by BlessingWhite remains
true:
The Engaged stay for what they can give, the Disengaged stay
for what they can get.
For instance, the Disengaged who intend on staying are less
than half as likely to state that the work
they do is what keeps them committed, and four times more
likely to quote the economy as the biggest
barrier to leaving. The Disengaged are also twice as likely to
reference desirable job conditions,
advantageous benefits or simply “being comfortable here” as
reasons for staying.
When it comes to those who are planning on leaving, Career
still tops the list – to which we can add
“a desire for change” (which career mobility inside the
organization would address). Finally, there
may be some genuine grievances around compensation, but
organizations should be very selective in
addressing these based on the individual’s performance on the
job.
Reasons to stay for Engaged and Disengaged
Overall Engaged Disengaged
My work. I like the work that I do. 34% 38% 16%
My organization's mission. I believe in what we do. 16% 19%
14%
My career. I have significant development or advancement
opportunities here.
17% 17% 19%
No desire for change. I am comfortable here. 7% 5% 11%
My finances. I expect a desirable salary, bonus, or stock
options.
6% 5% 10%
My manager. I am committed to this person. 5% 5% 5%
My job conditions. I have flexible hours, a good commute,
etc.
7% 5% 10%
The economy. I don't think there are other job opportunities
for me out there.
4% 3% 12%
My colleagues. I have strong relationships on the job. 3% 2%
3%
10© 2013 by BlessingWhite, A Division of GP Strategies.
Princeton, NJ. All rights reserved. Employee Engagement
Research Update 01/13.
Age, role/level, tenure correlation
The dynamics of age, level and tenure have not fundamentally
changed. Prima facie, they are proving
to be constants around the world from one study to the next,
namely:
1) Engagement increases as you get closer to the top of the
organization.
2) Tenure (time with the organization) – engagement increases
as employees become more tenured.
3) Time in current role – engagement increases as employees
become more vested in their current role.
4) The impact of age – employees become more engaged as they
get older.
Reasons to leave for Engaged and Disengaged
Engaged and Disengaged by level in the organization
Overall Engaged Disengaged
My career. I don't have opportunities to grow or advance
here.
26% 27% 25%
My finances. I want to earn more money. 16% 22% 12%
My work. I don't like what I do or it doesn't make the most of
my talents.
15% 6% 24%
My desire for change. I want to try something new. 13% 15%
9%
My manager. I don't like working for him or her. 10% 7% 13%
My job conditions. I don't have the flexibility, commute, etc.,
that I need.
8% 10% 7%
The economy. I think better jobs in my field are available. 6%
9% 4%
My organization's mission. It conflicts with my personal
values.
4% 2% 5%
My colleagues. I don't want to work with or around them. 2%
3% 2%
Level in the Organization % Engaged % Disengaged
Executive (Vice President or above) 59% 9%
Director 41% 12%
Team Leader/Tech Lead/Project Manager 39% 14%
Manager/Supervisor 39% 12%
Consultant 33% 16%
Specialist/Professional/Engineer 29% 20%
Administrative/Clerical 27% 21%
11© 2013 by BlessingWhite, A Division of GP Strategies.
Princeton, NJ. All rights reserved. Employee Engagement
Research Update 01/13.
While engagement levels typically increase as you climb the
ladder in an organization, disengagement
in more senior ranks can have a broad-reaching impact on
performance, so organizations looking
at engagement should not make the common mistake of focusing
purely on the front line of the
organization. 59% Engaged at the Executive level still leaves
41% who could benefit from engagement
efforts.
One dead battery will not jump-start another. You cannot
sustain engagement down into the ranks of the
organization with disengaged executives or directors.
Engaged and Disengaged by job tenure (time in current role)
Engagement levels by tenure with company (time with current
employer)
In both cases (time in current job and time with current
employer), the longer an employee has been
committed to their current job or employer the higher the levels
of reported engagement.
12© 2013 by BlessingWhite, A Division of GP Strategies.
Princeton, NJ. All rights reserved. Employee Engagement
Research Update 01/13.
We do find that looking at these demographics in isolation is
somewhat misleading. Age, tenure and
seniority are closely related, so it helps to view this as a
progression. As employees become more
tenured, more experienced in their role, and more secure in their
own skills and capabilities, they are
able to achieve higher levels of engagement. In a way this trend
is to be expected: employees who do
not find satisfaction in a role will be more likely to leave their
employer or change jobs.
Understanding this dynamic informs our engagement efforts.
As individuals progress through their personal careers, their
focus (in terms of both contribution and
satisfaction) evolves. This is particularly important to
understand when developing initiatives around:
Organizations that have closely studied their own internal
engagement dynamics have discovered
that there are pivotal points in tenure, when the loss of valuable
talent is more likely. These “danger
zones” are often department- or function-specific, tend to be in
the 3- to 5-year window, and are often
correlated to employee age.
Knowing when these higher-risk windows occur allows
organizations to be proactive in coaching
employees through these periods in order to retain critical
talent.
Engagement levels by age
13© 2013 by BlessingWhite, A Division of GP Strategies.
Princeton, NJ. All rights reserved. Employee Engagement
Research Update 01/13.
Gender
In previous reports we observed how gender was not a strong
predictor of engagement (i.e., women
and men had the same overall engagement levels and patterns)
in North America and Europe.
Elsewhere in the world, however, there are geographies with
significant gender differences:
For instance, this chart indicates that in North America men
tend to be marginally more Disengaged
(2 pts.) and very slightly less likely to be Engaged than women
(1 pt.), whereas in India men are
substantially more likely to be Engaged (11 pts.) and
significantly less likely to be Disengaged (8 pts.)
than their female counterparts.
As we detail in The Engagement Equation, there are still
significant gender gaps in many societies. Far
from being a barrier for employers, we believe this represents a
significant opportunity for developing
a purposeful internal culture that respects diversity and includes
all employees in achieving the
organization’s goals.
Engagement gender gap: point difference between percentage of
men and women engaged/disengaged
2%
-­‐3%
3%
2%
-­‐8%
-­‐6%
-­‐2%
-­‐1%
3%
-­‐4%
5%
11%
7%
7%
-­‐9%
-­‐4%
1%
6%
11%
North
America
Europe
Australia
/
New
Zealand
China
India
Persian
Gulf
South
America
Disengaged
Engaged
GCC
14© 2013 by BlessingWhite, A Division of GP Strategies.
Princeton, NJ. All rights reserved. Employee Engagement
Research Update 01/13.
Satisfaction and contribution drivers
Contribution
When asked to “Choose the item that would most improve your
performance,” two items compete for
first place: access to more resources and greater clarity on what
the organization is expecting. These
two items are clearly split based on engagement levels, with
those already contributing highly looking
for more resources.
Top contribution drivers by engagement level
Engaged
Almost
Engaged
Crash and
Burners
Honey-
mooners
and
Hamsters
Disengaged Overall
Greater clarity about
what the organization
needs me to do – and
why
15% 19% 18% 31% 28% 20%
More resources 23% 20% 22% 12% 14% 20%
Regular, specific feed-
back about how I'm
doing
21% 20% 13% 23% 13% 19%
Development opportuni-
ties and training
17% 18% 22% 14% 19% 18%
A coach or a mentor
other than my manager
12% 11% 13% 10% 13% 11%
Better communication
with my manager
6% 7% 7% 8% 9% 7%
A better relationship
with my coworkers
5% 5% 5% 3% 5% 5%
While contribution drivers do vary significantly based on
engagement levels, they also vary based on
the regions we studied, and this should inform how an
engagement strategy may be adjusted to be
relevant to a regional office or facility (see next page).
15© 2013 by BlessingWhite, A Division of GP Strategies.
Princeton, NJ. All rights reserved. Employee Engagement
Research Update 01/13.
Top 3 contribution drivers by region (across all engagement
levels)
North
America
Europe China India GCC Australia/NZ
South
America
1. More
resources
1. More
resources
1. Regular,
specific feed-
back about
how I’m
doing
1. Greater
clarity about
what the
organization
needs me
to do – and
why
1. Develop-
ment oppor-
tunities and
training
1. Develop-
ment oppor-
tunities and
training
1. Develop-
ment oppor-
tunities and
training
2. Greater
clarity about
what the
organization
needs me
to do – and
why
2. A coach or
a mentor
other than
my manager
2. Develop-
ment oppor-
tunities and
training
2. Regular,
specific feed-
back about
how I’m
doing
2. Greater
clarity about
what the
organization
needs me
to do – and
why
2. More
resources
2. Regular,
specific feed-
back about
how I’m
doing
3. A coach or
a mentor
other than
my manager
3. Regular,
specific
feedback
about how
I’m doing
/ Greater
clarity about
what the
organization
needs me
to do – and
why [Tied for
3rd place]
3. Greater
clarity about
what the
organization
needs me
to do – and
why
3. Develop-
ment oppor-
tunities and
training
3. Regular,
specific feed-
back about
how I’m
doing
3. Regular,
specific feed-
back about
how I’m
doing
3. Greater
clarity about
what the
organization
needs me
to do – and
why
16© 2013 by BlessingWhite, A Division of GP Strategies.
Princeton, NJ. All rights reserved. Employee Engagement
Research Update 01/13.
Top satisfaction drivers by engagement level
Satisfaction
Engaged
Almost
Engaged
Crash and
Burners
Honey-
mooners
and
Hamsters
Disengaged Overall
More opportunities to do
what I do best
24% 24% 25% 25% 23% 24%
Career development
opportunities and train-
ing
24% 25% 26% 21% 23% 24%
More flexible job condi-
tions (e.g., control over
how my work gets done,
flex time, telecommuting)
13% 11% 12% 10% 11% 11%
More challenging work 11% 10% 11% 10% 11% 11%
Improved cooperation
among my coworkers
10% 8% 6% 5% 7% 8%
Greater clarity about
what the organization
needs me to do – and
why
6% 8% 6% 14% 11% 8%
Greater clarity about my
own work preferences
and career goals
7% 8% 8% 8% 8% 7%
A better relationship with
my manager
6% 6% 6% 8% 7% 6%
It is worth noting that while “Improved cooperation among my
coworkers” is chosen by 8% of
employees overall, it is chosen by 14% of Executives (VP and
above) as the item most likely to improve
their satisfaction. This points to a deepening divergence of
agendas and a clash of personalities higher
up in organizations.
17© 2013 by BlessingWhite, A Division of GP Strategies.
Princeton, NJ. All rights reserved. Employee Engagement
Research Update 01/13.
Top 3 satisfaction drivers by region (across all engagement
levels)
North
America
Europe China India GCC Australia/NZ
South
America
1. More
opportuni-
ties to do
what I do
best
1. More
opportuni-
ties to do
what I do
best
1. Career
develop-
ment oppor-
tunities and
training
1. Career
develop-
ment oppor-
tunities and
training
1. Career
develop-
ment oppor-
tunities and
training
1. Career
develop-
ment oppor-
tunities and
training
1. Career
develop-
ment oppor-
tunities and
training
2. Career
develop-
ment oppor-
tunities and
training
2. Career
develop-
ment oppor-
tunities and
training
2. More
opportuni-
ties to do
what I do
best
2. More
opportuni-
ties to do
what I do
best
2. More
opportuni-
ties to do
what I do
best
2. More
opportuni-
ties to do
what I do
best
2. More
opportuni-
ties to do
what I do
best
3. More flex-
ible job
conditions
3. More flex-
ible job
conditions
3. Greater
clarity
about my
own work
preferences
and career
goals
3. More chal-
lenging
work
3. More chal-
lenging
work
3. More flex-
ible job
conditions
3. Greater
clarity
about what
the orga-
nization
needs me
to do – and
why
Unlike contribution drivers, there is significant agreement on
what would increase personal satisfaction:
“More opportunities to do what I do best” and “Career
development opportunities and training” rank
highest in every region we studied.
Career
We articulated in previous research reports the importance of
career to individuals, and the opportunity
that exists for organizations to take the lead in defining career
to align with the organization’s long-
term talent requirements. Our 2012 data indicates that,
worldwide, employees reporting having greater
career opportunities than they did in early 2011 – today 59% of
respondents agree or strongly agree to
the statement, “I have career opportunities in this organization.”
In 2011 only 50% agreed.
“I have career opportunities in this organization” 2011 vs. 2012
21%
19%
29%
22%
50%
59%
0%
20%
40%
60%
80%
100%
2011
2012
Agree
or
Strongly
Agree
Neither
Agree/
Disagree
Disagree
or
Strongly
Disagree
18© 2013 by BlessingWhite, A Division of GP Strategies.
Princeton, NJ. All rights reserved. Employee Engagement
Research Update 01/13.
It’s clear that having career opportunities is a strong contributor
to satisfaction for employees, but it’s
also a strong indicator of whether or not employees see
opportunities to align their skills and ambitions
to the organization’s talent needs.
“I have career opportunities in this organization” by
engagement level – 2012
“I have career opportunities in this organization” by region -
2012
8%
13%
30%
22%
45%
14%
22%
29%
30%
30%
78%
65%
41%
48%
25%
0%
10%
20%
30%
40%
50%
60%
70%
80%
90%
100%
En
ga
ge
d
Al
mo
st
En
ga
ge
d
Cr
as
h
a
nd
Bu
rn
er
s
Ho
ne
ym
oo
ne
rs
an
d
H
am
ste
rs
Di
se
ng
ag
ed
Agree
or
Strongly
Agree
Neither
Agree/Disagree
Disagree
or
Strongly
Disagree
21%
8%
28%
7%
28%
23%
22%
28%
25%
26%
17%
24%
26%
11%
51%
67%
46%
75%
48%
51%
68%
0%
10%
20%
30%
40%
50%
60%
70%
80%
90%
100%
Australia
/
New
Zealand
China
Europe
India
North
America
Persian
Gulf
South
America
Agree
or
Strongly
Agree
Neither
Agree/Disagree
Disagree
or
Strongly
Disagree
GCC
19© 2013 by BlessingWhite, A Division of GP Strategies.
Princeton, NJ. All rights reserved. Employee Engagement
Research Update 01/13.
Trust in Managers
The following graph speaks volumes about the correlation
between manager trust and engagement.
Looking at global data, we see a very tight relationship between
engagement levels and manager trust:
While this in itself does not point to causation it stands to
reason that managers who develop an
awareness of trust, and how to earn it, will have much greater
success in engaging their team members.
If we look at change since 2011, we notice an improvement in
trust levels across the board with the
biggest shift among the Crash & Burn group and a smaller gain
among the Disengaged and Almost
Engaged:
“I trust my manager” responses by engagement level – 2012
“I trust my manager” favorable responses by engagement level,
2011 vs. 2012
Agree or
Strongly Agree
2011 2012
Engaged 89% 90%
Almost Engaged 81% 84%
Crash & Burners 63% 70%
Honeymooners & Hamsters 70% 70%
Disengaged 48% 51%
20© 2013 by BlessingWhite, A Division of GP Strategies.
Princeton, NJ. All rights reserved. Employee Engagement
Research Update 01/13.
While trust in one’s immediate manager varies from one region
of the world to the next, managers
generally enjoy decent levels of trust:
“I trust my manager” responses by region - 2012
Managers: the importance of being known
As part of our ongoing research, we have focused increasingly
on the relationship between the
individual and their immediate manager. We have found
compelling correlations between an employee
knowing their manager well as a person and key working
dynamics such as effective use of talents,
rewards and recognition, providing regular feedback etc.
So who benefits the most from getting to know their manager as
a person?
We asked respondents to rank their manager on a number of
important aspects of their working
relationship such as delegating tasks and utilizing talents. We
also asked them how well they knew their
manager as a person. By cross-referencing the two we can see
clear patterns of who most benefits from
knowing their boss better.
Naturally this correlation between knowing your manager as a
person and working effectively day-to-
day is closely correlated to engagement. While they do benefit
greatly, Engaged employees appear
much more tolerant of not knowing their manager as a person.
When it comes to scoring their direct
manager on these 8 critical items, the gap between engaged
employees who know their manager well
and those who don’t is not nearly as large as the gap for the
other 4 less-engaged segments.
11%
3%
12%
5%
14%
14%
11%
13%
11%
17%
11%
12%
12%
16%
76%
86%
71%
84%
74%
74%
73%
0%
10%
20%
30%
40%
50%
60%
70%
80%
90%
100%
Aus
/
NZ
China
Europe
India
North
America
Persian
Gulf
South
America
Agree
/
Strongly
Agree
Neither
Agree/Disagree
Disagree
/
Strongly
Disagree
GCC
21© 2013 by BlessingWhite, A Division of GP Strategies.
Princeton, NJ. All rights reserved. Employee Engagement
Research Update 01/13.
So while engaged employees have other factors to hold onto
(interesting work, a sense of contribution,
career hopes), less-engaged employees are far more dependent
on knowing their manager as a person
to reach higher levels of engagement. This becomes apparent if
we look at the average gap over all 8
of the factors in our most recent study, by engagement level:
So what does this mean in practice? While companies focus on
equipping managers with tactical skills
such as delegation or matching individual talents to tasks,
engagement is driven more effectively through
leadership and connection skills. Particularly difficult for a
manager is the challenge of authenticity
– because they are typically being taught how to behave, how to
“play a role.” In actual fact, it’s
becoming better known as a person to their direct reports – not
being the person they think they ought
to be – that will build the relationship needed to increase
engagement.
Trust in executives
The way that employees interact with and perceive senior
executives is very different from their
relationship with their manager. It is important for us to
understand this distinction in equipping every
level of an organization to build a culture of engagement.
Average gap in manager favorability between those who report
knowing their manager well and those who don’t
– 2012
Engaged
Almost
Engaged
Crash and
Burners
Honeymoon-
ers and
Hamsters
Disengaged Grand Total
China 14% 10% 19% 12% 46% 30%
Aus/NZ 37% 46% 37% 57% 79% 54%
India 47% 51% 63% 67% 58% 58%
North
America
41% 49% 56% 59% 64% 59%
South
America
33% 56% 60% 15% 43% 48%
GCC 16% 33% 57% 61% 61% 46%
Europe 22% 48% 47% 59% 59% 52%
Global 22% 48% 47% 59% 59% 52%
22© 2013 by BlessingWhite, A Division of GP Strategies.
Princeton, NJ. All rights reserved. Employee Engagement
Research Update 01/13.
At a high level, trust in senior leaders has seen a slight increase
overall, from 61% to 65% of employees
who agree or strongly agree with the statement “I trust the
senior leaders of this organization.” As we
might expect this also correlates closely to engagement levels:
2011 2012
Engaged 85% 85%
Almost Engaged 68% 70%
Crash & Burners 40% 47%
Honeymooners & Hamsters 57% 56%
Disengaged 27% 30%
Total 61% 65%
“I trust senior leaders in this organization” responses by region
– 2012
20%
4%
25%
7%
22%
18%
15%
22%
18%
25%
15%
21%
21%
20%
57%
78%
50%
78%
57%
62%
65%
0%
10%
20%
30%
40%
50%
60%
70%
80%
90%
100%
Aus
/
NZ
China
Europe
India
North
America
Persian
Gulf
South
America
Disagree
/
Strongly
Disagree
Neither
Agree/Disagree
Agree
/
Strongly
Agree
GCC
23© 2013 by BlessingWhite, A Division of GP Strategies.
Princeton, NJ. All rights reserved. Employee Engagement
Research Update 01/13.
What are executives (perceived to be) good at? And where are
they
weak?
While executives do not get to interact one-on-one with every
employee, their role in building a culture
of engagement is pivotal. Setting the tone, fostering a
purposeful culture and establishing an inspiring
vision of the future are all important prerequisites to building
engagement across the enterprise.
Along with trust levels, employees are scoring senior leaders
marginally better on the four key
engagement actions we have tracked between studies:
% agree or
strongly agree
Change
since 2011
(percentage
points)
Gap between the
Engaged
and Disengaged
who agree
(percentage
points)
Senior leaders act in alignment with our organiza-
tion’s core values or guiding principles.
61% +2 17
Senior leaders communicate honestly. 56% +3 18
Senior leaders link the work of the organization to a
larger purpose.
62% +2 18
Senior leaders have created a work environment
that drives high performance.
50% +1 20
24© 2013 by BlessingWhite, A Division of GP Strategies.
Princeton, NJ. All rights reserved. Employee Engagement
Research Update 01/13.
Notes
25© 2013 by BlessingWhite, A Division of GP Strategies.
Princeton, NJ. All rights reserved. Employee Engagement
Research Update 01/13.
As we continue to track employee trends around the world, we
are watching the evolution of the
employee/employer relationship through economic cycles. But 3
key elements are essential to informing
our approach to developing an engagement strategy:
1) How an employee relates to his or her job and employer
(current and future).
2) How managers work with individual employees to address
individual engagement drivers and foster
positive team dynamics.
3) How executives create an inspiring vision for the future and
foster a purposeful culture that makes
engagement a core driver of business results.
Engagement needs to be part of your culture
Organizations that have made substantive progress in fueling
business success through employee
engagement have approached this transformation as a culture
change exercise. They may not explicitly
describe it that way, but the transformation was the result of a
deliberate focus on establishing a
foundation of employee engagement and driving engagement at
every level of the organization. In the
most successful organizations, engagement and results are
discussed regularly – in the same breath.
We identify 6 main elements for building a culture of
engagement. While these are not lockstep phases
in a process, there is a natural sequence:
Recommendations
Take
Action
Build
Commitment
Create
Engagement
Champions
Equip
People
Measure
Progress
Align
Practices
26© 2013 by BlessingWhite, A Division of GP Strategies.
Princeton, NJ. All rights reserved. Employee Engagement
Research Update 01/13.
Build Commitment Does your organization have a shared,
actionable defi-
nition and a common language for discussing engage-
ment? Most don’t, yet engage in extensive post-survey
action planning.
In building commitment you need to clarify what you and
your company are committing to – and why it is impor-
tant. Start with the business case and securing Senior
Leader Buy-In.
Create Engagement Champions Unless your organization is
small, you cannot build a cul-
ture of engagement on your own, even with the support
of senior leaders. Champions allow your organization to:
} Expand the engagement message reach.
} Educate colleagues on what engagement is, why it is
important, and how to influence it.
} Help leaders interpret, communicate, and act on survey
findings.
} Support managers as they tackle engagement with their
teams.
} Help in gathering insights and feedback from the front
lines.
Equip People It may seem obvious, but if you need people to
play par-
ticular roles, you must prepare them to do so. Everyone
needs to understand those expectations and assume own-
ership of their piece of the puzzle. Provide the context,
articulate the vision and equip every level.
Align Practices Too often, engagement is undermined by
policies and
practices that drive only results – or are simply painfully
bureaucratic. Successful culture change requires that your
operational engine drive engagement as well as your
strategic priorities.
Measure Progress So how will you know if you are succeeding
in creating
a culture of engagement? Engagement surveys, pulse sur-
veys, and the metrics you use already to run your busi-
ness can provide insights.
Stay close to the financial, customer, value chain, and
human capital metrics that your organization already
tracks. You may not be able to determine that higher
engagement is explicitly driving success, but you will be
able to show a strong correlation between your engage-
ment efforts and improved numbers that matter.
Take Action If you’re measuring progress toward creating a
culture of
engagement well, you’ll end up with actionable insights.
Encouraging dialogue and planning at the team level
provides a valuable feedback loop.
The aim of this phase is to transition from a corporate
objective (creating a culture of engagement) to actions
that will tackle engagement at the local level.
27© 2013 by BlessingWhite, A Division of GP Strategies.
Princeton, NJ. All rights reserved. Employee Engagement
Research Update 01/13.
A Daily Priority: the IME approach
If you want to build a culture of engagement you need to move
away from a survey-driven process that
results in lists of remedial actions assigned to ill-prepared
managers.
If engagement is to become a daily priority, it has to be a shared
responsibility. Leaders and managers
cannot and should not shoulder the entire burden of engaging
your workforce. Every member needs to
play a role (or several roles), as individuals (I), managers (M),
or executives (E).
So you must develop a focus on engagement which maps out
roles and responsibilities at each level of
the organization.
Individuals
At the individual level, drivers of satisfaction and contribution
will vary, as will longer-term aspirations
and career goals. While the organization can help an individual
examine and gain clarity on these, it
does demand a partnership and a proactive participation from
the individual. No individual can expect
the organization to make them engaged.
Individuals need to ACT on engagement, namely:
priorities.
put together a plan on how to address
their personal engagement drivers to reach higher levels of
contribution and satisfaction.
– with their manager’s support start to change
those items they can and track their
progress throughout the year.
Managers
Managers tend to be on the sharp end of the wedge when it
comes to engagement. They are under
pressure from senior management to produce results, burdened
with expectations that they can engage
their teams, and often divided between managing others and
completing their own tasks. When the
annual engagement survey rolls around it’s on their shoulders
that the action plans land, and typically
they have been given little context and no option about
participating or not. Finally, managers need to
worry about their own personal engagement equation.
Managers need to CARE about engagement, namely:
satisfaction.
organization’s strategy, mission, and values.
out what’s important to both parties,
while at the same time engaging
themselves.
28© 2013 by BlessingWhite, A Division of GP Strategies.
Princeton, NJ. All rights reserved. Employee Engagement
Research Update 01/13.
There is an important caveat to the CARE model. Managers
must drop the veil of their position or title,
and become better known to employees. That doesn’t
necessarily mean being their buddy. But it does
mean sharing personal motivation for work, challenges,
appropriate weaknesses, the reasons they came
to your organization, and why they stay there.
Engagement is a case of give and take – of gaining satisfaction
and giving contribution. Once
engagement has been achieved there are many factors that may
cause it to get out of balance, one
being the constant shifting and redirecting of organizational
strategy and direction. As each department
or team changes tack, it is up to the manager to ensure that
employees make course corrections to stay
aligned with the most immediate priorities.
Executives
Executives are not in the position to coach and align the
personal interests of each and every employee.
They must set the direction that the workforce aligns to,
communicate that direction to ensure a clear
line-of-sight throughout your organization, and create a culture
that fuels engagement and business
results. They must also fulfill the role of manager and
individual as previously described. We understand
that this is a tall order.
We need to look at the priorities of executives in leading a
workforce to higher engagement from the
perspective of the leaders’ followers. Our focus therefore is not
on the intrinsic qualities that make an
effective leader but instead is about asking, “What are the needs
of followers that a leader needs to
fulfill?” We find it useful to talk about how you build your
CASE (Community, Authenticity, Significance,
and Excitement). These are core needs of the 21st century
workforce (the followers) and are useful in
delivering results as well as engagement:
Community for a sense of belonging and purpose
– and raise the bar on –
high performance
29© 2013 by BlessingWhite, A Division of GP Strategies.
Princeton, NJ. All rights reserved. Employee Engagement
Research Update 01/13.
Organizational practices
Finally, you need to take a look at the organizational level and
critically revisit policies, practices and
procedures and ask yourself: do these help or hinder in our
engagement efforts?
A common list of practices that we find fail to support
engagement in many corporations include:
around priorities and work preferences.
awkward form-filling by managers and a once-
a-year scorecard that fails to truly align employees to the
organization’s priorities.
nt opportunities and
not individual potential.
nobody challenges, and that add no value
but have become a fixture.
low-performing team member rather than
seek to replace him or her with a higher-potential candidate.
Alignment is key
Increasingly, we find that a key to building engagement in most
organizations is a focus on alignment.
Never assume that staff understand and are able to align to what
the organization needs. Many
employees report “Greater clarity about what the organization
needs me to do – and why” as a top
driver of contribution.
Furthermore, it is being able to contribute and know that this
contribution is recognized that drives an
employee’s satisfaction. In this sense contribution and
satisfaction are mutually reinforcing. So while
many organizations approach engagement from the perspective
of “what will make our employees more
satisfied,” the answer is sometimes surprising: it’s more
opportunities to contribute! But opportunities that
are also in line with the aspirations and strengths of the
individual.
Less, less, more, more – collect the data you need to understand
local
needs and take action
Having the right data to inform your engagement efforts is
important, especially if this data allows you
to draw a straight line between engagement levels and
organizational outputs. But beware: the survey
scores are not the prize, and there is a risk of letting survey
scores dictate rather than inform your
efforts. Consequently we recommend:
– achieving specific engagement targets
or getting a passable scorecard is not
the goal.
– the survey process is too often used
as a catch-all.
effectively be used as a dashboard metric
and not just a once-a-year audit.
tied to the business’s current ambitions
and strategic efforts.
30© 2013 by BlessingWhite, A Division of GP Strategies.
Princeton, NJ. All rights reserved. Employee Engagement
Research Update 01/13.
Dialogue on career pays off
Career (in the broad sense) remains high on every employee’s
list of needs. As we detailed in the
previous pages, two factors consistently top the list of
satisfaction drivers for employees in nearly every
region in the world and across every engagement level: “career
development opportunities and training”
and “more opportunities to do what I do best.” See the table
called Top 3 Satisfaction Drivers by region
(across all engagement levels) on page 17.
Yet career development is often dismissed by management for
several reasons: employees job hop,
business plans change, the economy makes long-term planning
difficult, and budgets simply aren’t
available for career initiatives.
While more people report having career opportunities today
than in 2011, employees are largely
cynical about their employer’s attempts to support their careers
and disappointed by the resources they
receive. For the most part, they believe, they will forge a career
in spite of their company’s policies and
procedures.
But dig deeper, and you find that what is lacking is clarity:
Most employees do not have clarity around
their career aspirations or drivers of job satisfaction.
As traditional career ladders disappear, it becomes important for
organizations to help define the
primary guideposts that individuals should use to redefine and
navigate today’s uncharted career
landscape. Employees who are truly striving to achieve full
engagement for their own sake would
ideally stop looking to a new employer and start developing a
personal career path or series of projects
internally, in accordance with the company’s shifting priorities.
The bottom line: if employees understand what matters to them,
what they offer, and where they can
make a difference for their employer, they will be better able to
make the right choices – and also
position themselves as the right people to get the work done.
Savvy enterprises see a bigger picture: career development is
one critical piece in a more complex
talent management strategy that often includes succession
planning, performance management,
redeployment, and targeted development to make sure the
organization performs as its markets evolve.
When employees see career as encompassing lateral moves,
skill development, stretch assignments, and
special projects – not just promotions or advancement – they
will find more satisfying opportunities with
you, their current employer. If you provide an exciting journey,
people will stop wondering about what
the stops are called along the way.
31© 2013 by BlessingWhite, A Division of GP Strategies.
Princeton, NJ. All rights reserved. Employee Engagement
Research Update 01/13.
Start by establishing three cornerstones of career development
success:
1. Individuals must own their careers and not rely on their
employers or managers to take the initiative.
2. The organization must have a point of view about career
development, and provide the tools and
structure that allow employees to develop in their careers in the
context of what the organization
needs.
3. Managers stand at the crossroads where their team members’
capabilities and goals meet
the organization’s priorities. They need to understand and buy-
in to the organization’s career
development point of view. They also must be competent and
confident in supporting (not directing)
employees’ career journeys. It is the role of your managers to
help employees realistically align their
aspirations with the organization’s goals.
Disengaged cause drag: coach up or coach out
Every sizable organization will have a proportion of its
workforce in the Disengaged group. This is
simply the dynamics of a modern workforce.
It is tempting to invest a lot of time in re-engaging this group,
but that is rarely the best use of time.
Disengagement is contagious and causes drag in terms of low
contribution, and failing to address
disengagement may be a tacit signal that the organization (or
the manager) tolerates sub-par
performance.
So what is a manager to do with a Disengaged team member?
The answer is to coach up or coach out.
Coach up
Give the employee the opportunity to engage in a dialogue with
the manager and address the root
cause of their disengagement, seeking ways to contribute at a
higher level – and in doing so get to
higher levels of engagement.
Coach out
If the employee has turned an emotional corner and is unwilling
to make the effort (or if the job fit is
truly so bad that course correction is not enough) then it will be
better for both parties to part ways.
At the end of the day, a Disengaged employee should be given
the two options above. The third option
of staying put and doing nothing should not be on the table.
32© 2013 by BlessingWhite, A Division of GP Strategies.
Princeton, NJ. All rights reserved. Employee Engagement
Research Update 01/13.
This report is based on 7,068 responses from around the world.
Regions reported are those where
sufficient number of responses were collected to provide
meaningful regional analysis. South America
and the GCC were not reported separately in the 2011 report.
Methodology
Our online survey consisted of 27 multiple-choice items.
Everyone answered the first 25 items. The
remaining items varied based on respondents’ answers to item
25, which explored intent to stay.
The survey link was emailed to European and North American
respondents in May to August 2012 and
to Asian respondents in September to November 2012.
Individuals invited to respond represented a
cross-section of geographic regions, job functions, roles, and
industries.
To round out the multi-layered workforce perspective, we
conducted about 30 interviews with HR and
line leaders around the world. Many of these interviews were
also featured in our 2012 book The
Engagement Equation (Wiley).
Global respondent profile
n North America, 27% in India,
10% in Europe, 4% in Australia/New
Zealand, 4% from the GCC, and 3.1% from South America
9% indicating that they are a vice
president or above
- 1964), 33%
are Generation X (born 1965 - 1977),
and 35% are Generation Y or Millennials (born 1978 - 1994)
people and 57% work for organizations
with fewer than 5,000 people
same location, with only 13% labeling
themselves as virtual workers
and 31% have been with their
organizations for more than 7 years
year and 14% of employees have held
their position for more than 7 years
environment
About this report
A Division of GP Strategies
LEADING TRANSITION: A NEW MODEL FOR CHANGE
by William Bridges and Susan Mitchell Bridges
Change is nothing new to leaders, or their constituents. We
understand by now that organizations
cannot be just endlessly "managed," replicating yesterday's
practices to achieve success. Business
conditions change and yesterday's assumptions and practices no
longer work. There must be innovation,
and innovation means change.
Yet the thousands of books, seminars, and consulting
engagements purporting to help "manage change"
often fall short. These tools tend to neglect the dynamics of
personal and organizational transition that can
determine the outcome of any change effort. As a result, they
fail to address the leader's need to coach
others through the transition process. And they fail to
acknowledge the fact that leaders themselves usually
need coaching before they can effectively coach others.
In years past, perhaps, leaders could simply order changes.
Even today, many view it as a straightforward
process: establish a task force to lay out what needs to be done,
when, and by whom. Then all that seems
left for the organization is (what an innocent sounding
euphemism!) to implement the plan. Many leaders
imagine that to make a change work, people needed only to
follow the plan's implicit map, which shows how
to get from here (where things stand now) to there (where
they'll stand after the plan is implemented).
"There" is also where the organization needs to be if it is to
survive, so anyone who has looked at the
situation with a reasonably open mind can see that the change
isn't optional. It is essential.
Fine. But then, why don't people "Just Do It"? And what is the
leader supposed to do when they Just Don't
Do It -- when people do not make the changes that need to be
made, when deadlines are missed, costs run
over budget, and valuable workers get so frustrated that when a
headhunter calls, they jump ship.
Leaders who try to analyze this question after the fact are likely
to review the change effort and how it was
implemented. But the details of the intended change are often
not the issue. The planned outcome may
have been the restructuring of a group around products instead
of geography, or speeding up product time-
to-market by 50 percent. Whatever it was, the change that
seemed so obviously necessary has languished
like last week's flowers.
That happens because transition occurs in the course of every
attempt at change. Transition is the state that
change puts people into. The change is external (the different
policy, practice, or structure that the leader is
trying to bring about), while transition is internal (a
psychological reorientation that people have to go
through before the change can work).
The trouble is, most leaders imagine that transition is automatic
-- that it occurs simply because the change
is happening. But it doesn't. Just because the computers are on
everyone's desk doesn't mean that the new
individually accessed customer database is transforming
operations the way the consultants promised it
would. And just because two companies (or hospitals or law
firms) are now fully "merged" doesn't mean
that they operate as one or that the envisioned cost savings will
be realized.
Even when a change is showing signs that it may work, there is
the issue of timing, for transition happens
much more slowly than change. That is why the ambitious
timetable that the leader laid out to the board
turns out to have been wildly optimistic: it was based on getting
the change accomplished, not on getting
the people through the transition.
Transition takes longer because it requires that people undergo
three separate processes, and all of them
are upsetting.
Saying Goodbye. The first requirement is that people have to let
go of the way that things -- and, worse, the
way that they themselves -- used to be. As the folk-wisdom puts
it, "You can't steal second base with your
foot on first." You have to leave where you are, and many
people have spent their whole lives standing on
LEADING TRANSITION: A NEW MODEL FOR CHANGE
by William Bridges and Susan Mitchell Bridges
first base. It isn't just a personal preference you are asking them
to give up. You are asking them to let go
of the way of engaging or accomplishing tasks that made them
successful in the past. You are asking them
to let go of what feels to them like their whole world of
experience, their sense of identity, even "reality"
itself.
On paper it may have been a logical shift to self-managed
teams, but it turned out to require that people no
longer rely on a supervisor to make all decisions (and to be
blamed when things go wrong). Or it looked like
a simple effort to merge two work-groups, but in practice it
meant that people no longer worked with their
friends or reported to people whose priorities they understood.
Shifting into Neutral. Even after people have let go of their old
ways, they find themselves unable to start
anew. They are entering the second difficult phase of transition.
We call it the neutral zone, and that in-
between state is so full of uncertainty and confusion that simply
coping with it takes most of people's
energy. The neutral zone is particularly difficult during mergers
or acquisitions, when careers and policy
decisions and the very "rules of the game" are left in limbo
while the two leadership groups work out
questions of power and decision making.
The neutral zone is uncomfortable, so people are driven to get
out of it. Some people try to rush ahead into
some (often any) new situation, while others try to back-pedal
and retreat into the past. Successful
transition, however, requires that an organization and its people
spend some time in the neutral zone. This
time in the neutral zone is not wasted, for that is where the
creativity and energy of transition are found and
the real transformation takes place. It's like Moses in the
wilderness: it was there, not in the Promised Land,
that Moses was given the Ten Commandments; and it was there,
and not in The Promised Land, that his
people were transformed from slaves to a strong and free people
(see "Lessons from the Wilderness").
Today, it won't take 40 years, but a shift to self-managed teams,
for instance, is likely to leave people in the
neutral zone for six months, and a major merger may take two
years to emerge from the neutral zone. The
change can continue forward on something close to its own
schedule while the transition is being attended
to, but if the transition is not dealt with, the change may
collapse. People cannot do the new things that the
new situation requires until they come to grips with what is
being asked.
Moving Forward. Some people fail to get through transition
because they do not let go of the old ways and
make an ending; others fail because they become frightened and
confused by the neutral zone and don't
stay in it long enough for it to do its work on them. Some,
however, do get through these first two phases of
transition, but then freeze when they face the third phase, the
new beginning. For that third phase requires
people to begin behaving in a new way, and that can be
disconcerting -- it puts one's sense of competence
and value at risk. Especially in organizations that have a history
of punishing mistakes, people hang back
during the final phase of transition, waiting to see how others
are going to handle the new beginning.
Helping Leaders to Lead Change
Understanding the transition process is a requirement for almost
any senior executive. However, it is when
the organization is in transition that leaders themselves often
need help. They are so close to the changes
that have been launched that they may fail to
terms with the necessary change -- and that
their followers will need at least as long to do so (see figure)
believe that their followers are ignorant,
rigid, or outright hostile to the new direction
themselves, that are holding people back and
thereby threatening to make their change unworkable.
http://www.leadertoleader.org/knowledgecenter/L2L/spring2000
/bridges.html#lessons
http://www.leadertoleader.org/knowledgecenter/L2L/spring2000
/bridges.html#figure
LEADING TRANSITION: A NEW MODEL FOR CHANGE
by William Bridges and Susan Mitchell Bridges
The Marathon Effect
The higher a leader sits in an organization the more quickly he
or she tends to move through the change
process. Because they can see the intended destination before
others even know the race has begun, senior
managers can forget that others will take longer to make the
transition: letting go of old ways, moving
through the neutral zone, and, finally, making a new beginning.
Most leaders come from backgrounds where technical, financial,
or operational skills were paramount, and
those skills provide little help when it comes to leading people
through transition. Such leaders may be
pushing the limits of their understanding of the future, and they
need perspective and advice. That is where
a trusted colleague, confidant, coach, or consultant can offer
valuable counsel to the leader. This person's
background or professional affiliation can vary widely; what
matters is that she or he understands how to
help people through transition. It is a role that is far more
interpersonal and collaborative than is played by
most consultants or trainers accustomed to teaching a skill or
prescribing a solution.
No training program can prepare a leader for managing a
transition. Yet no leader can effectively lead
change -- which is what leadership is all about -- without
understanding and, ultimately, experiencing -- the
transition process. What leaders need, instead, is individualized
assistance whereby they learn to
transition that they face -- not through
generic "change." A trainer can teach leaders a generalized
approach ("The Ten Steps..."), but a good
coach can help the leaders to discover their own best
approaches.
create a development plan that prepares them for
the future.
Times of transition are becoming the rule rather than the
exception. Yet few
leaders know how to prepare for the changes that lie ahead.
Transition
leadership skills must be congruent with, must capitalize and
build on, the
leader's own strengths and talents. They cannot be found in a set
of theoretical leadership skills.
The transition adviser works collaboratively with each leader to
assess the leader's place in the three-part
transition process, the strengths the leader brings and how to
leverage them, and what the current situation
demands. It is a personal and completely customized process.
Few leaders know how to prepare
for the challenges ahead.
LEADING TRANSITION: A NEW MODEL FOR CHANGE
by William Bridges and Susan Mitchell Bridges
A Method to Managing Transition
Although the details of a transition management plan are unique
to each situation, the adviser must help a
leader with the following essential steps:
1. Learn to describe the change and why it must happen, and do
so succinctly -- in one minute or less.
It is amazing how many leaders cannot do that.
2. Be sure that the details of the change are planned carefully
and that someone is responsible for
each detail; that timelines for all the changes are established;
and that a communications plan
explaining the change is in place.
3. Understand (with the assistance of others closer to the
change) just who is going to have to let go
of what -- what is ending (and what is not) in people's work
lives and careers -- and what people
(including the leader) should let go of.
4. Make sure that steps are taken to help people respectfully let
go of the past. These may include
"boundary" actions (events that demonstrate that change has
come), a constant stream of
information, and understanding and acceptance of the symptoms
of grieving, as well as efforts to
protect people's interests while they are giving up the status
quo.
5. Help people through the neutral zone with communication
(rather than simple information) that
emphasizes connections with and concern for the followers,. To
keep reiterating the "4 P's" of
transition communications:
The purpose: Why we have to do this
The picture: What it will look and feel like when we reach our
goal
The plan: Step-by-step, how we will get there
The part: What you can (and need to) do to help us move
forward.
6. Create temporary solutions to the temporary problems and the
high levels of uncertainty found in
the neutral zone. For example, one high-tech manufacturer,
when announcing the closing of a plant,
made interim changes in its usual reassignment procedures,
bonus compensation plans, and
employee communications processes to make sure that displaced
employees suffered as little as
possible, both financially and psychologically. Such efforts
should include transition monitoring
teams that can alert the leader to unforeseen problems -- and
disband when the process is done.
7. Help people launch the new beginning by articulating the new
attitudes and behaviors needed to
make the change work -- and then modeling, providing practice
in, and rewarding those behaviors
and attitudes. For example, rather than announcing the
grandiose goal of building a "world-class
workforce," leaders of transition must define the skills and
attitudes that such a workforce must
have, and provide the necessary training and resources to
develop them.
Coaching for Change
Since the ability to manage transition is tied to the realities of
an actual leader in an actual situation, mutual
trust between adviser and leader is essential. Only that way can
leaders be honest enough to bring their
fears and concerns to the surface quickly, hear what the
situation is really "saying" rather than focusing on a
program that a consultant is trying to sell, and gain the personal
insight and awareness of the transition
process that can be carried into the future.
Because this transition management relationship is a close and
ongoing one, the adviser gets to know the
leader's situation well and follows it as it changes.
Understanding the dynamics of transition is far removed
from the kind of leadership training most organizations provide.
Traditional trainers and consultants seldom
possess such intimate knowledge of their client. Whatever
personal coaching they provide is usually
LEADING TRANSITION: A NEW MODEL FOR CHANGE
by William Bridges and Susan Mitchell Bridges
subsumed to the teaching of a generic skill or body of
knowledge. And because the relationship is time-
limited, there is a natural pressure to produce quick, clear
results.
However, because transition advisers work within the context of
the situation at hand, their focus is not on
how to "be a leader" or even how to "change an organization"
but on how to provide the particular kind of
leadership that an organization in transition demands. For that
reason, the results of the relationship are
very specific: the development of new skills and behaviors
geared to the needs of the unique time and
circumstances in which the person leads.
New Models of Leadership
Once you understand transition, you begin to see it
everywhere. You realize that many of the issues commonly
addressed as leadership, learning, or organizational
development challenges are really an inevitable part of
transition. Indeed, in today's organizations, without
experiencing and successfully managing a difficult transition,
no leader can be effective for very long. That
suggests reinventing most models of leadership development.
The best leadership development programs
implicitly address the challenge of understanding change -- they
are experiential, tailored to the needs of
the leader, and based on delivering real-world results. But most
could be strengthened by explicit attention
to transition management.
The final lesson that the process of transition holds for
leadership development is that the relationship
between adviser and leader is not much different from that
between a leader and the people that she or he
"leads." We treat that word ironically because the leadership
that is appropriate to a modern, fast-moving
organization -- where work is based on task and mission rather
than job description, and is distributed
among contributors inside and outside one's organization --
takes on a new meaning. It is not the drum-
major-at-the-head-of-the-parade leadership appropriate to
yesterday's organization; rather it is the give-
and-take, person-centered leadership by which the sports coach
gets the best effort out of each member of
a team.
The kind of leadership most effective today is similar to the
kind of service that the best consultant gives a
client: collaborative assistance that is both problem-solving and
developmental. Its target is both the
situation and the professional capability of the person. Today's
leader, in a fundamental sense is a coach,
and the leader can best learn that role by being coached.
Copyright © 2000 by William Bridges and Susan Mitchell
Bridges. Reprinted with permission from Leader to
Leader, a publication of the Leader to Leader Institute and
Jossey-Bass.
Without successfully managing a difficult
transition, no leader can be effective for very long.

More Related Content

Similar to The Eight Stages of Building Commitment Post 2 of 4 in the.docx

Organizational Change Management PaperContentsYour paper.docx
Organizational Change Management PaperContentsYour paper.docxOrganizational Change Management PaperContentsYour paper.docx
Organizational Change Management PaperContentsYour paper.docxgerardkortney
 
Overcoming barriers to PLCs: Lack of understanding andor resistance to change
Overcoming barriers to PLCs: Lack of understanding andor resistance to changeOvercoming barriers to PLCs: Lack of understanding andor resistance to change
Overcoming barriers to PLCs: Lack of understanding andor resistance to changeAngela Szakasits
 
Chapter 4 leading change and innovation
Chapter 4 leading change and innovationChapter 4 leading change and innovation
Chapter 4 leading change and innovationMohsin Akhtar
 
Organizational Change – Concept & Need, Change Process, Reasons for Resistanc...
Organizational Change – Concept & Need, Change Process, Reasons for Resistanc...Organizational Change – Concept & Need, Change Process, Reasons for Resistanc...
Organizational Change – Concept & Need, Change Process, Reasons for Resistanc...Ashish Hande
 
The Highway of Change and a Practical Framework Approach to Change
The Highway of Change and a Practical Framework Approach to ChangeThe Highway of Change and a Practical Framework Approach to Change
The Highway of Change and a Practical Framework Approach to ChangeFlevy.com Best Practices
 
Change Management.pptx
Change Management.pptxChange Management.pptx
Change Management.pptxSweetSupandit
 
EcO9Op-aTUGDvTqfms1BCg_22992a0fc216492c830c65c38b2610f1_Change-Management-Fra...
EcO9Op-aTUGDvTqfms1BCg_22992a0fc216492c830c65c38b2610f1_Change-Management-Fra...EcO9Op-aTUGDvTqfms1BCg_22992a0fc216492c830c65c38b2610f1_Change-Management-Fra...
EcO9Op-aTUGDvTqfms1BCg_22992a0fc216492c830c65c38b2610f1_Change-Management-Fra...Poudel Dinesh
 
Change Management.pptx
Change Management.pptxChange Management.pptx
Change Management.pptxMohsen Hefni
 
Beginnings middles ends: A Systematic Approach to Organizational Transformation
Beginnings middles ends: A Systematic Approach to Organizational TransformationBeginnings middles ends: A Systematic Approach to Organizational Transformation
Beginnings middles ends: A Systematic Approach to Organizational TransformationBob Prieto
 
Oc and resistance3
Oc and resistance3Oc and resistance3
Oc and resistance3Aditya Kumar
 
Are you managing change or vice versa short
Are you managing change or vice versa shortAre you managing change or vice versa short
Are you managing change or vice versa shortChris Kirkness
 
Theory-of-Change.pdf
Theory-of-Change.pdfTheory-of-Change.pdf
Theory-of-Change.pdfpophius
 
1Change Plan and Coalition BuildingWEEK 2Walden Un
1Change Plan and Coalition BuildingWEEK 2Walden Un1Change Plan and Coalition BuildingWEEK 2Walden Un
1Change Plan and Coalition BuildingWEEK 2Walden UnEttaBenton28
 
Planning new venture
Planning new venturePlanning new venture
Planning new ventureSuman Vashist
 
Why Do We Need Strong Change Management in the Way We Look at Remote Work Pol...
Why Do We Need Strong Change Management in the Way We Look at Remote Work Pol...Why Do We Need Strong Change Management in the Way We Look at Remote Work Pol...
Why Do We Need Strong Change Management in the Way We Look at Remote Work Pol...Qandle
 
Resources Responsibility Charting and AIDA Continuum ChartDevel.docx
Resources Responsibility Charting and AIDA Continuum ChartDevel.docxResources Responsibility Charting and AIDA Continuum ChartDevel.docx
Resources Responsibility Charting and AIDA Continuum ChartDevel.docxmackulaytoni
 

Similar to The Eight Stages of Building Commitment Post 2 of 4 in the.docx (20)

Organizational Change Management PaperContentsYour paper.docx
Organizational Change Management PaperContentsYour paper.docxOrganizational Change Management PaperContentsYour paper.docx
Organizational Change Management PaperContentsYour paper.docx
 
Overcoming barriers to PLCs: Lack of understanding andor resistance to change
Overcoming barriers to PLCs: Lack of understanding andor resistance to changeOvercoming barriers to PLCs: Lack of understanding andor resistance to change
Overcoming barriers to PLCs: Lack of understanding andor resistance to change
 
Chapter 4 leading change and innovation
Chapter 4 leading change and innovationChapter 4 leading change and innovation
Chapter 4 leading change and innovation
 
Unit 5 pom
Unit 5 pomUnit 5 pom
Unit 5 pom
 
Organizational Change – Concept & Need, Change Process, Reasons for Resistanc...
Organizational Change – Concept & Need, Change Process, Reasons for Resistanc...Organizational Change – Concept & Need, Change Process, Reasons for Resistanc...
Organizational Change – Concept & Need, Change Process, Reasons for Resistanc...
 
Change management.docx
Change management.docxChange management.docx
Change management.docx
 
The Highway of Change and a Practical Framework Approach to Change
The Highway of Change and a Practical Framework Approach to ChangeThe Highway of Change and a Practical Framework Approach to Change
The Highway of Change and a Practical Framework Approach to Change
 
Change Management.pptx
Change Management.pptxChange Management.pptx
Change Management.pptx
 
EcO9Op-aTUGDvTqfms1BCg_22992a0fc216492c830c65c38b2610f1_Change-Management-Fra...
EcO9Op-aTUGDvTqfms1BCg_22992a0fc216492c830c65c38b2610f1_Change-Management-Fra...EcO9Op-aTUGDvTqfms1BCg_22992a0fc216492c830c65c38b2610f1_Change-Management-Fra...
EcO9Op-aTUGDvTqfms1BCg_22992a0fc216492c830c65c38b2610f1_Change-Management-Fra...
 
Change Management.pptx
Change Management.pptxChange Management.pptx
Change Management.pptx
 
Beginnings middles ends: A Systematic Approach to Organizational Transformation
Beginnings middles ends: A Systematic Approach to Organizational TransformationBeginnings middles ends: A Systematic Approach to Organizational Transformation
Beginnings middles ends: A Systematic Approach to Organizational Transformation
 
Oc and resistance3
Oc and resistance3Oc and resistance3
Oc and resistance3
 
Are you managing change or vice versa short
Are you managing change or vice versa shortAre you managing change or vice versa short
Are you managing change or vice versa short
 
Change management
Change managementChange management
Change management
 
Theory-of-Change.pdf
Theory-of-Change.pdfTheory-of-Change.pdf
Theory-of-Change.pdf
 
1Change Plan and Coalition BuildingWEEK 2Walden Un
1Change Plan and Coalition BuildingWEEK 2Walden Un1Change Plan and Coalition BuildingWEEK 2Walden Un
1Change Plan and Coalition BuildingWEEK 2Walden Un
 
Planning new venture
Planning new venturePlanning new venture
Planning new venture
 
Why Do We Need Strong Change Management in the Way We Look at Remote Work Pol...
Why Do We Need Strong Change Management in the Way We Look at Remote Work Pol...Why Do We Need Strong Change Management in the Way We Look at Remote Work Pol...
Why Do We Need Strong Change Management in the Way We Look at Remote Work Pol...
 
Change management
Change managementChange management
Change management
 
Resources Responsibility Charting and AIDA Continuum ChartDevel.docx
Resources Responsibility Charting and AIDA Continuum ChartDevel.docxResources Responsibility Charting and AIDA Continuum ChartDevel.docx
Resources Responsibility Charting and AIDA Continuum ChartDevel.docx
 

More from mehek4

Accident Up Ahead!Listen to this text being read aloud by a hu.docx
Accident Up Ahead!Listen to this text being read aloud by a hu.docxAccident Up Ahead!Listen to this text being read aloud by a hu.docx
Accident Up Ahead!Listen to this text being read aloud by a hu.docxmehek4
 
Access the annual report provided in Course Materials to complete .docx
Access the annual report provided in Course Materials to complete .docxAccess the annual report provided in Course Materials to complete .docx
Access the annual report provided in Course Materials to complete .docxmehek4
 
Access the Internet to acquire a copy of the most recent annual re.docx
Access the Internet to acquire a copy of the most recent annual re.docxAccess the Internet to acquire a copy of the most recent annual re.docx
Access the Internet to acquire a copy of the most recent annual re.docxmehek4
 
Acc 290 Final Exam MCQs) Which financial statement is used to de.docx
Acc 290 Final Exam MCQs) Which financial statement is used to de.docxAcc 290 Final Exam MCQs) Which financial statement is used to de.docx
Acc 290 Final Exam MCQs) Which financial statement is used to de.docxmehek4
 
AC2760Week 2 Assignment.docx
AC2760Week 2 Assignment.docxAC2760Week 2 Assignment.docx
AC2760Week 2 Assignment.docxmehek4
 
AC1220 Lab 5.1IntroductionJake determines that owning the .docx
AC1220 Lab 5.1IntroductionJake determines that owning the .docxAC1220 Lab 5.1IntroductionJake determines that owning the .docx
AC1220 Lab 5.1IntroductionJake determines that owning the .docxmehek4
 
Abstract(Provide the main generalizable statement resulting .docx
Abstract(Provide the main generalizable statement resulting .docxAbstract(Provide the main generalizable statement resulting .docx
Abstract(Provide the main generalizable statement resulting .docxmehek4
 
Abusive relationships are at the core of the Coetzee novel, whether .docx
Abusive relationships are at the core of the Coetzee novel, whether .docxAbusive relationships are at the core of the Coetzee novel, whether .docx
Abusive relationships are at the core of the Coetzee novel, whether .docxmehek4
 
Abraham, J., Sick, B., Anderson, J., Berg, A., Dehmer, C., & Tufano,.docx
Abraham, J., Sick, B., Anderson, J., Berg, A., Dehmer, C., & Tufano,.docxAbraham, J., Sick, B., Anderson, J., Berg, A., Dehmer, C., & Tufano,.docx
Abraham, J., Sick, B., Anderson, J., Berg, A., Dehmer, C., & Tufano,.docxmehek4
 
Abraham, J., Sick, B., Anderson, J., Berg, A., Dehmer, C., & Tufan.docx
Abraham, J., Sick, B., Anderson, J., Berg, A., Dehmer, C., & Tufan.docxAbraham, J., Sick, B., Anderson, J., Berg, A., Dehmer, C., & Tufan.docx
Abraham, J., Sick, B., Anderson, J., Berg, A., Dehmer, C., & Tufan.docxmehek4
 
A.Da la correcta conjugación para cada oración.(Give the corre.docx
A.Da la correcta conjugación para cada oración.(Give the corre.docxA.Da la correcta conjugación para cada oración.(Give the corre.docx
A.Da la correcta conjugación para cada oración.(Give the corre.docxmehek4
 
Abraham Lincoln is considered by many historians to be the greatest .docx
Abraham Lincoln is considered by many historians to be the greatest .docxAbraham Lincoln is considered by many historians to be the greatest .docx
Abraham Lincoln is considered by many historians to be the greatest .docxmehek4
 
About half of the paid lobbyists in Washington are former government.docx
About half of the paid lobbyists in Washington are former government.docxAbout half of the paid lobbyists in Washington are former government.docx
About half of the paid lobbyists in Washington are former government.docxmehek4
 
ABC sells 400 shares of its $23 par common stock for $27. The entry .docx
ABC sells 400 shares of its $23 par common stock for $27. The entry .docxABC sells 400 shares of its $23 par common stock for $27. The entry .docx
ABC sells 400 shares of its $23 par common stock for $27. The entry .docxmehek4
 
ABC company is increasing its equity by selling additional shares to.docx
ABC company is increasing its equity by selling additional shares to.docxABC company is increasing its equity by selling additional shares to.docx
ABC company is increasing its equity by selling additional shares to.docxmehek4
 
A.The unification of previously fractious and divided Arab tribes.docx
A.The unification of previously fractious and divided Arab tribes.docxA.The unification of previously fractious and divided Arab tribes.docx
A.The unification of previously fractious and divided Arab tribes.docxmehek4
 
A.Escribe la forma correcta del verbo en españolNosotros siem.docx
A.Escribe la forma correcta del verbo en españolNosotros siem.docxA.Escribe la forma correcta del verbo en españolNosotros siem.docx
A.Escribe la forma correcta del verbo en españolNosotros siem.docxmehek4
 
A.Both countries fought for independence from Great Britain, b.docx
A.Both countries fought for independence from Great Britain, b.docxA.Both countries fought for independence from Great Britain, b.docx
A.Both countries fought for independence from Great Britain, b.docxmehek4
 
a.A patent purchased from J. Miller on January 1, 2010, for a ca.docx
a.A patent purchased from J. Miller on January 1, 2010, for a ca.docxa.A patent purchased from J. Miller on January 1, 2010, for a ca.docx
a.A patent purchased from J. Miller on January 1, 2010, for a ca.docxmehek4
 
A.) Imagine that astronomers have discovered intelligent life in a n.docx
A.) Imagine that astronomers have discovered intelligent life in a n.docxA.) Imagine that astronomers have discovered intelligent life in a n.docx
A.) Imagine that astronomers have discovered intelligent life in a n.docxmehek4
 

More from mehek4 (20)

Accident Up Ahead!Listen to this text being read aloud by a hu.docx
Accident Up Ahead!Listen to this text being read aloud by a hu.docxAccident Up Ahead!Listen to this text being read aloud by a hu.docx
Accident Up Ahead!Listen to this text being read aloud by a hu.docx
 
Access the annual report provided in Course Materials to complete .docx
Access the annual report provided in Course Materials to complete .docxAccess the annual report provided in Course Materials to complete .docx
Access the annual report provided in Course Materials to complete .docx
 
Access the Internet to acquire a copy of the most recent annual re.docx
Access the Internet to acquire a copy of the most recent annual re.docxAccess the Internet to acquire a copy of the most recent annual re.docx
Access the Internet to acquire a copy of the most recent annual re.docx
 
Acc 290 Final Exam MCQs) Which financial statement is used to de.docx
Acc 290 Final Exam MCQs) Which financial statement is used to de.docxAcc 290 Final Exam MCQs) Which financial statement is used to de.docx
Acc 290 Final Exam MCQs) Which financial statement is used to de.docx
 
AC2760Week 2 Assignment.docx
AC2760Week 2 Assignment.docxAC2760Week 2 Assignment.docx
AC2760Week 2 Assignment.docx
 
AC1220 Lab 5.1IntroductionJake determines that owning the .docx
AC1220 Lab 5.1IntroductionJake determines that owning the .docxAC1220 Lab 5.1IntroductionJake determines that owning the .docx
AC1220 Lab 5.1IntroductionJake determines that owning the .docx
 
Abstract(Provide the main generalizable statement resulting .docx
Abstract(Provide the main generalizable statement resulting .docxAbstract(Provide the main generalizable statement resulting .docx
Abstract(Provide the main generalizable statement resulting .docx
 
Abusive relationships are at the core of the Coetzee novel, whether .docx
Abusive relationships are at the core of the Coetzee novel, whether .docxAbusive relationships are at the core of the Coetzee novel, whether .docx
Abusive relationships are at the core of the Coetzee novel, whether .docx
 
Abraham, J., Sick, B., Anderson, J., Berg, A., Dehmer, C., & Tufano,.docx
Abraham, J., Sick, B., Anderson, J., Berg, A., Dehmer, C., & Tufano,.docxAbraham, J., Sick, B., Anderson, J., Berg, A., Dehmer, C., & Tufano,.docx
Abraham, J., Sick, B., Anderson, J., Berg, A., Dehmer, C., & Tufano,.docx
 
Abraham, J., Sick, B., Anderson, J., Berg, A., Dehmer, C., & Tufan.docx
Abraham, J., Sick, B., Anderson, J., Berg, A., Dehmer, C., & Tufan.docxAbraham, J., Sick, B., Anderson, J., Berg, A., Dehmer, C., & Tufan.docx
Abraham, J., Sick, B., Anderson, J., Berg, A., Dehmer, C., & Tufan.docx
 
A.Da la correcta conjugación para cada oración.(Give the corre.docx
A.Da la correcta conjugación para cada oración.(Give the corre.docxA.Da la correcta conjugación para cada oración.(Give the corre.docx
A.Da la correcta conjugación para cada oración.(Give the corre.docx
 
Abraham Lincoln is considered by many historians to be the greatest .docx
Abraham Lincoln is considered by many historians to be the greatest .docxAbraham Lincoln is considered by many historians to be the greatest .docx
Abraham Lincoln is considered by many historians to be the greatest .docx
 
About half of the paid lobbyists in Washington are former government.docx
About half of the paid lobbyists in Washington are former government.docxAbout half of the paid lobbyists in Washington are former government.docx
About half of the paid lobbyists in Washington are former government.docx
 
ABC sells 400 shares of its $23 par common stock for $27. The entry .docx
ABC sells 400 shares of its $23 par common stock for $27. The entry .docxABC sells 400 shares of its $23 par common stock for $27. The entry .docx
ABC sells 400 shares of its $23 par common stock for $27. The entry .docx
 
ABC company is increasing its equity by selling additional shares to.docx
ABC company is increasing its equity by selling additional shares to.docxABC company is increasing its equity by selling additional shares to.docx
ABC company is increasing its equity by selling additional shares to.docx
 
A.The unification of previously fractious and divided Arab tribes.docx
A.The unification of previously fractious and divided Arab tribes.docxA.The unification of previously fractious and divided Arab tribes.docx
A.The unification of previously fractious and divided Arab tribes.docx
 
A.Escribe la forma correcta del verbo en españolNosotros siem.docx
A.Escribe la forma correcta del verbo en españolNosotros siem.docxA.Escribe la forma correcta del verbo en españolNosotros siem.docx
A.Escribe la forma correcta del verbo en españolNosotros siem.docx
 
A.Both countries fought for independence from Great Britain, b.docx
A.Both countries fought for independence from Great Britain, b.docxA.Both countries fought for independence from Great Britain, b.docx
A.Both countries fought for independence from Great Britain, b.docx
 
a.A patent purchased from J. Miller on January 1, 2010, for a ca.docx
a.A patent purchased from J. Miller on January 1, 2010, for a ca.docxa.A patent purchased from J. Miller on January 1, 2010, for a ca.docx
a.A patent purchased from J. Miller on January 1, 2010, for a ca.docx
 
A.) Imagine that astronomers have discovered intelligent life in a n.docx
A.) Imagine that astronomers have discovered intelligent life in a n.docxA.) Imagine that astronomers have discovered intelligent life in a n.docx
A.) Imagine that astronomers have discovered intelligent life in a n.docx
 

Recently uploaded

Procuring digital preservation CAN be quick and painless with our new dynamic...
Procuring digital preservation CAN be quick and painless with our new dynamic...Procuring digital preservation CAN be quick and painless with our new dynamic...
Procuring digital preservation CAN be quick and painless with our new dynamic...Jisc
 
Full Stack Web Development Course for Beginners
Full Stack Web Development Course  for BeginnersFull Stack Web Development Course  for Beginners
Full Stack Web Development Course for BeginnersSabitha Banu
 
MICROBIOLOGY biochemical test detailed.pptx
MICROBIOLOGY biochemical test detailed.pptxMICROBIOLOGY biochemical test detailed.pptx
MICROBIOLOGY biochemical test detailed.pptxabhijeetpadhi001
 
Gas measurement O2,Co2,& ph) 04/2024.pptx
Gas measurement O2,Co2,& ph) 04/2024.pptxGas measurement O2,Co2,& ph) 04/2024.pptx
Gas measurement O2,Co2,& ph) 04/2024.pptxDr.Ibrahim Hassaan
 
ENGLISH 7_Q4_LESSON 2_ Employing a Variety of Strategies for Effective Interp...
ENGLISH 7_Q4_LESSON 2_ Employing a Variety of Strategies for Effective Interp...ENGLISH 7_Q4_LESSON 2_ Employing a Variety of Strategies for Effective Interp...
ENGLISH 7_Q4_LESSON 2_ Employing a Variety of Strategies for Effective Interp...JhezDiaz1
 
Meghan Sutherland In Media Res Media Component
Meghan Sutherland In Media Res Media ComponentMeghan Sutherland In Media Res Media Component
Meghan Sutherland In Media Res Media ComponentInMediaRes1
 
ECONOMIC CONTEXT - LONG FORM TV DRAMA - PPT
ECONOMIC CONTEXT - LONG FORM TV DRAMA - PPTECONOMIC CONTEXT - LONG FORM TV DRAMA - PPT
ECONOMIC CONTEXT - LONG FORM TV DRAMA - PPTiammrhaywood
 
Enzyme, Pharmaceutical Aids, Miscellaneous Last Part of Chapter no 5th.pdf
Enzyme, Pharmaceutical Aids, Miscellaneous Last Part of Chapter no 5th.pdfEnzyme, Pharmaceutical Aids, Miscellaneous Last Part of Chapter no 5th.pdf
Enzyme, Pharmaceutical Aids, Miscellaneous Last Part of Chapter no 5th.pdfSumit Tiwari
 
Painted Grey Ware.pptx, PGW Culture of India
Painted Grey Ware.pptx, PGW Culture of IndiaPainted Grey Ware.pptx, PGW Culture of India
Painted Grey Ware.pptx, PGW Culture of IndiaVirag Sontakke
 
How to Configure Email Server in Odoo 17
How to Configure Email Server in Odoo 17How to Configure Email Server in Odoo 17
How to Configure Email Server in Odoo 17Celine George
 
Employee wellbeing at the workplace.pptx
Employee wellbeing at the workplace.pptxEmployee wellbeing at the workplace.pptx
Employee wellbeing at the workplace.pptxNirmalaLoungPoorunde1
 
POINT- BIOCHEMISTRY SEM 2 ENZYMES UNIT 5.pptx
POINT- BIOCHEMISTRY SEM 2 ENZYMES UNIT 5.pptxPOINT- BIOCHEMISTRY SEM 2 ENZYMES UNIT 5.pptx
POINT- BIOCHEMISTRY SEM 2 ENZYMES UNIT 5.pptxSayali Powar
 
Hierarchy of management that covers different levels of management
Hierarchy of management that covers different levels of managementHierarchy of management that covers different levels of management
Hierarchy of management that covers different levels of managementmkooblal
 
EPANDING THE CONTENT OF AN OUTLINE using notes.pptx
EPANDING THE CONTENT OF AN OUTLINE using notes.pptxEPANDING THE CONTENT OF AN OUTLINE using notes.pptx
EPANDING THE CONTENT OF AN OUTLINE using notes.pptxRaymartEstabillo3
 
Solving Puzzles Benefits Everyone (English).pptx
Solving Puzzles Benefits Everyone (English).pptxSolving Puzzles Benefits Everyone (English).pptx
Solving Puzzles Benefits Everyone (English).pptxOH TEIK BIN
 
Framing an Appropriate Research Question 6b9b26d93da94caf993c038d9efcdedb.pdf
Framing an Appropriate Research Question 6b9b26d93da94caf993c038d9efcdedb.pdfFraming an Appropriate Research Question 6b9b26d93da94caf993c038d9efcdedb.pdf
Framing an Appropriate Research Question 6b9b26d93da94caf993c038d9efcdedb.pdfUjwalaBharambe
 
Pharmacognosy Flower 3. Compositae 2023.pdf
Pharmacognosy Flower 3. Compositae 2023.pdfPharmacognosy Flower 3. Compositae 2023.pdf
Pharmacognosy Flower 3. Compositae 2023.pdfMahmoud M. Sallam
 
Introduction to ArtificiaI Intelligence in Higher Education
Introduction to ArtificiaI Intelligence in Higher EducationIntroduction to ArtificiaI Intelligence in Higher Education
Introduction to ArtificiaI Intelligence in Higher Educationpboyjonauth
 
Roles & Responsibilities in Pharmacovigilance
Roles & Responsibilities in PharmacovigilanceRoles & Responsibilities in Pharmacovigilance
Roles & Responsibilities in PharmacovigilanceSamikshaHamane
 

Recently uploaded (20)

Procuring digital preservation CAN be quick and painless with our new dynamic...
Procuring digital preservation CAN be quick and painless with our new dynamic...Procuring digital preservation CAN be quick and painless with our new dynamic...
Procuring digital preservation CAN be quick and painless with our new dynamic...
 
Full Stack Web Development Course for Beginners
Full Stack Web Development Course  for BeginnersFull Stack Web Development Course  for Beginners
Full Stack Web Development Course for Beginners
 
Model Call Girl in Tilak Nagar Delhi reach out to us at 🔝9953056974🔝
Model Call Girl in Tilak Nagar Delhi reach out to us at 🔝9953056974🔝Model Call Girl in Tilak Nagar Delhi reach out to us at 🔝9953056974🔝
Model Call Girl in Tilak Nagar Delhi reach out to us at 🔝9953056974🔝
 
MICROBIOLOGY biochemical test detailed.pptx
MICROBIOLOGY biochemical test detailed.pptxMICROBIOLOGY biochemical test detailed.pptx
MICROBIOLOGY biochemical test detailed.pptx
 
Gas measurement O2,Co2,& ph) 04/2024.pptx
Gas measurement O2,Co2,& ph) 04/2024.pptxGas measurement O2,Co2,& ph) 04/2024.pptx
Gas measurement O2,Co2,& ph) 04/2024.pptx
 
ENGLISH 7_Q4_LESSON 2_ Employing a Variety of Strategies for Effective Interp...
ENGLISH 7_Q4_LESSON 2_ Employing a Variety of Strategies for Effective Interp...ENGLISH 7_Q4_LESSON 2_ Employing a Variety of Strategies for Effective Interp...
ENGLISH 7_Q4_LESSON 2_ Employing a Variety of Strategies for Effective Interp...
 
Meghan Sutherland In Media Res Media Component
Meghan Sutherland In Media Res Media ComponentMeghan Sutherland In Media Res Media Component
Meghan Sutherland In Media Res Media Component
 
ECONOMIC CONTEXT - LONG FORM TV DRAMA - PPT
ECONOMIC CONTEXT - LONG FORM TV DRAMA - PPTECONOMIC CONTEXT - LONG FORM TV DRAMA - PPT
ECONOMIC CONTEXT - LONG FORM TV DRAMA - PPT
 
Enzyme, Pharmaceutical Aids, Miscellaneous Last Part of Chapter no 5th.pdf
Enzyme, Pharmaceutical Aids, Miscellaneous Last Part of Chapter no 5th.pdfEnzyme, Pharmaceutical Aids, Miscellaneous Last Part of Chapter no 5th.pdf
Enzyme, Pharmaceutical Aids, Miscellaneous Last Part of Chapter no 5th.pdf
 
Painted Grey Ware.pptx, PGW Culture of India
Painted Grey Ware.pptx, PGW Culture of IndiaPainted Grey Ware.pptx, PGW Culture of India
Painted Grey Ware.pptx, PGW Culture of India
 
How to Configure Email Server in Odoo 17
How to Configure Email Server in Odoo 17How to Configure Email Server in Odoo 17
How to Configure Email Server in Odoo 17
 
Employee wellbeing at the workplace.pptx
Employee wellbeing at the workplace.pptxEmployee wellbeing at the workplace.pptx
Employee wellbeing at the workplace.pptx
 
POINT- BIOCHEMISTRY SEM 2 ENZYMES UNIT 5.pptx
POINT- BIOCHEMISTRY SEM 2 ENZYMES UNIT 5.pptxPOINT- BIOCHEMISTRY SEM 2 ENZYMES UNIT 5.pptx
POINT- BIOCHEMISTRY SEM 2 ENZYMES UNIT 5.pptx
 
Hierarchy of management that covers different levels of management
Hierarchy of management that covers different levels of managementHierarchy of management that covers different levels of management
Hierarchy of management that covers different levels of management
 
EPANDING THE CONTENT OF AN OUTLINE using notes.pptx
EPANDING THE CONTENT OF AN OUTLINE using notes.pptxEPANDING THE CONTENT OF AN OUTLINE using notes.pptx
EPANDING THE CONTENT OF AN OUTLINE using notes.pptx
 
Solving Puzzles Benefits Everyone (English).pptx
Solving Puzzles Benefits Everyone (English).pptxSolving Puzzles Benefits Everyone (English).pptx
Solving Puzzles Benefits Everyone (English).pptx
 
Framing an Appropriate Research Question 6b9b26d93da94caf993c038d9efcdedb.pdf
Framing an Appropriate Research Question 6b9b26d93da94caf993c038d9efcdedb.pdfFraming an Appropriate Research Question 6b9b26d93da94caf993c038d9efcdedb.pdf
Framing an Appropriate Research Question 6b9b26d93da94caf993c038d9efcdedb.pdf
 
Pharmacognosy Flower 3. Compositae 2023.pdf
Pharmacognosy Flower 3. Compositae 2023.pdfPharmacognosy Flower 3. Compositae 2023.pdf
Pharmacognosy Flower 3. Compositae 2023.pdf
 
Introduction to ArtificiaI Intelligence in Higher Education
Introduction to ArtificiaI Intelligence in Higher EducationIntroduction to ArtificiaI Intelligence in Higher Education
Introduction to ArtificiaI Intelligence in Higher Education
 
Roles & Responsibilities in Pharmacovigilance
Roles & Responsibilities in PharmacovigilanceRoles & Responsibilities in Pharmacovigilance
Roles & Responsibilities in Pharmacovigilance
 

The Eight Stages of Building Commitment Post 2 of 4 in the.docx

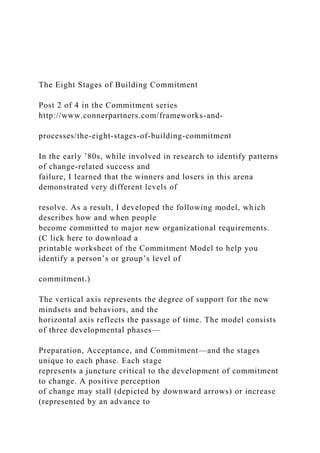
  • 1. The Eight Stages of Building Commitment Post 2 of 4 in the Commitment series http://www.connerpartners.com/frameworks-and- processes/the-eight-stages-of-building-commitment In the early ’80s, while involved in research to identify patterns of change-related success and failure, I learned that the winners and losers in this arena demonstrated very different levels of resolve. As a result, I developed the following model, which describes how and when people become committed to major new organizational requirements. (C lick here to download a printable worksheet of the Commitment Model to help you identify a person’s or group’s level of commitment.) The vertical axis represents the degree of support for the new mindsets and behaviors, and the horizontal axis reflects the passage of time. The model consists of three developmental phases— Preparation, Acceptance, and Commitment—and the stages unique to each phase. Each stage represents a juncture critical to the development of commitment to change. A positive perception of change may stall (depicted by downward arrows) or increase (represented by an advance to
  • 2. the next stage). In addition, as people learn more about the change and what it will require, they may return to earlier stages in the process. The successful transition through a particular stage serves as the basis for experiencing the next stage. http://www.connerpartners.com/series/commitment-2 http://www.connerpartners.com/frameworks-and-processes/the- eight-stages-of-building-commitment http://www.connerpartners.com/frameworks-and-processes/the- eight-stages-of-building-commitment http://connerpartners.com/frameworks-and-processes/patterns- order-beneath-the-confusion http://connerpartners.com/uncategorized/glossary http://connerpartners.com/uncategorized/glossary http://connerpartners.com/wp- content/uploads/2011/02/Commitment_Brochure.pdf http://connerpartners.com/frameworks-and-processes/patterns- order-beneath-the-confusion http://connerpartners.com/frameworks-and-processes/patterns- order-beneath-the-confusion Preparation Phase The Preparation Phase forms the foundation for later development of either support of or resistance to the change. There are two stages in the Preparation Phase:
  • 3. Stage I: Contact Stage I is the first encounter individuals have with the fact that a change is taking place in the organization that will require them to shift their behavior and/or thinking. Methods for delivering the first contact message can vary. There is a wide range of options including memos, staff meetings, personal contact, and other mechanisms. Regardless of the method, this first stage in the commitment process is intended to result in awareness that a change has taken place or may occur in the future. Since momentum and critical mass of commitment is essential to change success, careful attention should be given to how early contact (as well as later stages) will begin to promote the right energy movement toward realization. Contact efforts, though, do not always produce awareness. It’s important to separate contact efforts from people being aware of change…it’s dangerous to assume contact and awareness are synonymous. Sponsors and change agents are often frustrated when, after many meetings and memos about an initiative, some targets either are not prepared for the change or react with total
  • 4. surprise when it begins to affect them. There are two possible outcomes for the Contact Stage: Stage II: Awareness of Change Awareness is established successfully when individuals realize that modifications affecting them have occurred or are pending. It requires that initial communications about the change reach the desired audiences and convey the message clearly. This awareness, however, does not mean people have a complete understanding of how the change will affect them. They may not have an accurate picture of the scope, nature, depth, implications, or even the basic intent of the change. For instance, targets may perceive that a change is coming without knowing the specific ways they will need to alte r their mindset and behaviors. Before targets can progress toward acceptance, awareness must be developed into a general understanding of the change’s implications. http://connerpartners.com/frameworks-and-processes/resistance- to-change http://connerpartners.com/uncategorized/glossary http://connerpartners.com/roles-and- responsibilities/understanding-the-key-roles-in-significant- change
  • 5. http://connerpartners.com/roles-and- responsibilities/understanding-the-key-roles-in-significant- change http://connerpartners.com/uncategorized/glossary http://connerpartners.com/uncategorized/glossary http://connerpartners.com/uncategorized/glossary http://connerpartners.com/how-challenging-is-the- change/manage-intent-to-deliver-on-promises-and-minimize- disappointment There are two possible outcomes for the Awareness Stage: Phase Acceptance Phase The Acceptance Phase marks passage over the Disposition Threshold. This is an important momentum and critical mass milestone; people shift from seeing the change as something “out there,” to seeing it as having personal relevance. This perspective enables them to make decisions about accepting or not accepting their part in the change. People often engage in individual activities designed to move themselves across this threshold in order to proceed from awareness to understanding. They ask questions, pose c hallenges, seek additional information, and make inferences in an effort to clarify their picture of the change.
  • 6. Sometimes leaders wrongly interpret this behavior as resistance to the change initiative. Although it is possible for people to use endless questions and challenges as part of their resistance strategy, true resistance to the specific change at hand (rather than to the notion of change in general) can be manifested only when people understand it well enough to be able to formulate an informed opinion. There are two stages of the Acceptance Phase: Stage III: Understand the Change In Stage III, people show some degree of comprehension of the nature and intent of the change and what it may mean for them. As they learn more about the initiative and the role(s) they are likely to play, people begin to see how it will affect their work and how it will touch them personally. These insights enable them, for the first time, to judge the change. Each person’s judgment is influenced by his or her own cognitive and emotional filter systems— the unique set of lenses that he or she uses to view the world. In addition, change of any significance usually has multiple aspects to it, and may produce both positive and negative
  • 7. reactions at the same time. For example, a target may have a negative view of a new company policy regarding relocation every four years but sees positive benefit in the level of job security he or she would experience. People combine these positive and negative reactions to form an overall judgment of the change. There are two possible outcomes for the Understanding Stage: the change[1] sents a decision not to support the change http://connerpartners.com/frameworks-and-processes/patterns- order-beneath-the-confusion http://connerpartners.com/wp- includes/js/tinymce/plugins/paste/pasteword.htm?ver=3241- 1141#_ftn1 Stage IV: Positive Perception In Stage IV, people decide whether to support or oppose the change. The forming of an opinion about change is not done in isolation—people typically weigh the costs and benefits of the change against the costs and benefits of other alternatives, including doing nothing. Ideally, the benefits of a change to an individual so clearly outweigh the benefits of any alternative course of
  • 8. action that it requires little thought to decide to move forward. However, this is not typically the case. In many organizational change situations, the benefits of moving forward are only marginally more positive than the benefits of the best alternative course of action. In some changes, the path forward has such significant costs associated with it that the individual reaches an overall positive perception only because all of the alternatives are worse. For instance, a leader may face a decision to lay off a large number of people from the organization. He is likely to see this as a tremendously difficult and costly move. However, if he perceives that the alternative is the sale of the organization to a competitor who would be even more ruthless in the downsizing efforts, he may ultimately reach a positive perception about moving forward. Positive Perception is an important stage in the process of building commitment, but at this point the change is still rather theoretical. To reach true commitment, people must begin to try out the new way of operating—they must alter their mindset and behavior. There are two possible outcomes of the Positive Perception Stage:
  • 9. thinking and behaving and behaviors Commitment Phase The Commitment Phase marks passage over the Action Threshold. In this phase, the perceptions that have been created in the Acceptance Phase result in actual commitment. This is a critical step in the building of momentum and critical mass. There are many situations in which people will say that they view a change as positive. However, they will not actually take the first steps to alter their behavior or mindset. There can be several reasons for this, including: the new behavior the new behavior Commitment occurs when people see a change as more positive than negative and take action accordingly. There are four stages in the Commitment Phase: http://connerpartners.com/how-challenging-is-the- change/future-shock-the-scourge-of-organizational-change
  • 10. Stage V: Experime ntation In Stage V, individuals take action to test a change. This is the first time people actually try out the change and acquire a sense of how it might affect their work routine. This stage is an important signpost that commitment building has begun, although greater support is possible. The critical importance of this stage is that no matter how positively people view a change prior to engaging with it, their actual experience with it will reveal a number of small or large surprises. Some of these may be positive, but others may involve unanticipated problems that have significant negative consequences. If problems become too costly, pessimism regarding the change will increase and may reach the “checking-out” level. This occurs when early, uninformed optimism for a project transforms into informed pessimism, and the individual’s original positive judgment shifts to negative. Because of the inevitability of surprises, some degree of pessimism is unavoidable during change. Nevertheless, the confidence of those involved in a change increases as a re sult of resolving such problems. An environment that encourages the
  • 11. open discussion of concerns tends to solve problems, promote ownership, and build commitment to action. As these problems are resolved, a more realistic level of conviction toward the change builds. This conviction advances commitment to the Adoption level. There are two possible outcomes for the Experimentation Stage: the new mindsets and behaviors new mindsets and behaviors Stage VI: Adoption Stage IV, Adoption, is reached after individuals have successfully navigated the initial trial period. The dynamics here are similar to that of the Experimentation Stage. Both stages serve as tests in which the individual and the organization assess the cost and benefits of the change. Longer-term trials can reveal logistic, political, and economic problems with the new way of operating that can lead sponsors, agents, and/or targe ts to question the long-term viability of the new approach and potentially make a decision to terminate the change. The differences between the Experimentation and Adoption stages are important, even though
  • 12. their dynamics are similar. Experimentation focuses on initial, entry problems, and adoption centers on in-depth, longer-term problems. The former is a preliminary test of the change. The latter tests the ongoing implications of the change. Experimentation asks, “Will this change work?” Adoption asks, “Does this change fit with who I am as a person/who we are as an organization?” Although the level of time and resources necessary to reach Adoption is great, a change project in this stage is still being evaluated and can possibly be stopped. If the change is successful after this lengthy test period, it is in a position to become the standard new way of operating. There are two possible outcomes for the Adoption Stage: established as a standard trial Stage VII: Institutionalization Stage VII reflects the point at which people no longer view the change as tentative. They consider it standard operating procedure.
  • 13. As part of the institutionalization process, the organizational structure may be altered to accommodate new ways of operating, and rewards and punishments implemented to maintain new mindsets and behaviors. What was once a change requiring substantial sponsor legitimization has become part of the organizational routine that is monitored by managers. The move from Adoption to Institutionalization is a significant one, and a double-edged sword. The threshold that is crossed here is that of “reversibility.” O nce a change is institutionalized, it becomes the new status quo. Ending an institutionalized pattern that is ingrained into the fiber of an organization is extremely difficult. This stage reflects the highest level of commitment that can be achieved by an organization—the level above it, internalization, can only be achieved by individuals who make a personal choice to go there. Although institutionalization is sometimes all that is required to achieve the organization’s goals, it has some potential problems. If a change has been institutionalized but not internalized, those affected may be motivated to adhere to new procedures primarily to comply with organizational directives. Their compliance is achieved by using organizational rewards and punishments to
  • 14. motivate them to conform despite their own private beliefs about the change. I f their perception of the change is generally negative, but they have chosen to go forward because the costs of not doing so are prohibitively high, they will likely only mimic acceptable behavior. They learn to say and do the “right” things, but their actions will not reflect their true perspective. Because their mindset (priorities and frames of reference) does not align with their behavior, a great deal of managerial pressure will be required to ensure the ongoing presence of the desired behavior. The success of change does not always depend on the target’s personal investment. Some projects require only that targets “do as they are told.” However, as the pace and complexity of change escalates, producing more turbulence in the workplace, many organizations have modified their views about workers needing to understand or support organizational changes. Forcing change implementation often results in a halfhearted effort without a full return on investment. Institutionalized change, as powerful as it is, only delivers the target’s behavior, not http://connerpartners.com/uncategorized/glossary http://connerpartners.com/uncategorized/glossary http://connerpartners.com/uncategorized/glossary
  • 15. his or her mind and heart. This doesn’t mean that institutionalization isn’t the way to go sometimes because there are situations where leaders have to engage unpopular change. The point is to be aware of the benefits and limitations of institutionalized change. Stage VIII: Inte rnalization Stage VIII represents the highest level of commitment an individual can demonstrate toward an organizational change. It reflects an internal motivation in which individual beliefs and desires are aligned with those of the organization, and there is a high level of consistency between an individual’s mindset and behavior. While an organization can legislate the institutionalization of a change, internalization requires the active cooperation of each individual. At this last stage, people “own” the change; they demonstrate a high level of personal responsibility for its success. They serve as advocates for the new way of operating, protect it from those who would undermine it, and expend energy to ensure its success. These actions are often well beyond what could be created by any organizational mandate. Enthusiasm, high-energy investment, and persistence characterize internalized commitment, and
  • 16. it tends to become infectious. Targets who have internalized a change often cannot be distinguished from sponsors and advocates in their devotion to the task and their ability to engage others in the change effort. The time needed to move through the Experimentation, Adoption, Institutionalization, and Internalization phases will vary according to the individual, the organization, and the nature of the change project. The lines can be relatively clear or somewhat blurry depending on the situation. If a change is mandated, it can become institutionalized very quickly (but, as mentioned earlier, at a high cost of monitoring compliance). In other cases, institutionalization unfolds more gradually. As people gain experience with the new way of operating, find ways to refine and improve it, and adjust to its long-range impact and requirements, the change gradually becomes a natural part of the organizatio n’s culture or expected pattern of behavior. Internalization can begin very early in a change if the new way of operating is strongly aligned wit h individual beliefs and assumptions; it can also emerge along the way as individuals begin to see the advantages of the new approach. In some cases, it can fail to surface at all. Understanding the steps and sequence for building commitment is a powerful advantage for change practitioners when building momentum and critical mass
  • 17. for major organizational change. http://connerpartners.com/uncategorized/glossary http://connerpartners.com/frameworks-and-processes/whats- culture-got-to-do-with-it http://connerpartners.com/uncategorized/glossary Employee Engagement Research Update Beyond the numbers: A practical approach for individuals, managers, and executives January 2013 © 2013 by BlessingWhite, A Division of GP Strategies. All rights reserved. Employee Engagement Research Update 01/13 rev2. Copying and distribution — both printed and electronic — is prohibited without express written permission from BlessingWhite, Princeton, NJ, USA. 908-904-1000. In Europe, tel: +44 (0) 1628 660397. For distribution requests please contact [email protected] Contents
  • 18. This report is provided as part of BlessingWhite Intelligence, a series of reports on business and workplace issues. You can explore other topics by visiting www.blessingwhite.com/research. Executive summary . . . . . . . . . . . . . . . . . . . . . . . . . . . . . . . . . . . . . . . . . . . . . . . . . 1 What is engagement anyway? . . . . . . . . . . . . . . . . . . . . . . . . . . . . . . . . . . . . . . . . 3 Findings . . . . . . . . . . . . . . . . . . . . . . . . . . . . . . . . . . . . . . . . . . . . . . . . . . . . . . . . 5 Intent to stay (Retention) . . . . . . . . . . . . . . . . . . . . . . . . . . . . . . . . . . . . . . . . . . . . . 7 Recommendations . . . . . . . . . . . . . . . . . . . . . . . . . . . . . . . . . . . . . . . . . . . . . . . . 25 About this report . . . . . . . . . . . . . . . . . . . . . . . . . . . . . . . . . . . . . . . . . . . . . . . . . 32 1© 2013 by BlessingWhite, A Division of GP Strategies. Princeton, NJ. All rights reserved. Employee Engagement Research Update 01/13. In early 2011 BlessingWhite published a comprehensive report examining the dynamics of engagement around the world. The report generated a lot of interest with over 30,000 people downloading it from the BlessingWhite website. We are pleased to provide an update to that report based on data collected over the summer and autumn of 2012.
  • 19. This Employee Engagement Report research update reflects online survey responses of over 7,000 individuals from around the world. Details on our methodology and the global respondent profile appear in About this Report on page 32. It further complements the methodology and employee engagement best practices we explore in our October 2012 book The Engagement Equation: Leadership Strategies for an Inspired Workforce. The recommendations in this report reflect the approaches that we explored in the interviews for the book as well as in client work. Executive summary 2© 2013 by BlessingWhite, A Division of GP Strategies. Princeton, NJ. All rights reserved. Employee Engagement Research Update 01/13. Key findings the world. stable. While engagement and intent to stay are directly correlated, the specific dynamics of retention appear to vary significantly from one region of the world to the next. – as people grow more experienced and vested in their work, or more senior in the organization,
  • 20. engagement increases. western economies, large gaps in engagement levels between men and women are apparent in India, the GCC and South America. organization’s priorities, getting feedback, having opportunities to use skills, and career development remain at the top of the list for a majority of employees. What these factors mean in practice, however, can be deeply personal. age of the workforce trust senior leaders and managers. Trust in managers remains predictably higher than trust in executives. Recommendations Following on from our 2011 report, and based on these more recent observations, we recommend that: tions gain a firm grasp on how engagement can drive their business results in very specific terms, and adopt a common definition of engagement which makes it something tangible to business outcomes. o business strategy by increasing communication and clarity, as well as providing an inspiring vision for the future. workforce, clarifying who is accountable for what and how best to contribute to a culture of employee
  • 21. engagement. long-term employee aspirations with the organization’s talent needs of tomorrow. letting the Disengaged monopolize their efforts. 3© 2013 by BlessingWhite, A Division of GP Strategies. Princeton, NJ. All rights reserved. Employee Engagement Research Update 01/13. What is engagement anyway? The term “employee engagement” means different things to different organizations. Some equate it with job satisfaction, which unfortunately can reflect a transactional relationship that is only as good as the organization’s last round of perks or bonuses. Others measure engagement by gauging employees’ emotional commitment to their organization. Although commitment is an important ingredient, it is only one piece of the engagement equation. While organizations are keen to maximize the contribution of each individual toward corporate imperatives and metrics, individual employees need to find purpose and satisfaction in their work. Consequently, BlessingWhite’s engagement model focuses on individuals’:
  • 22. We believe that aligning employees’ values, goals, and aspirations with those of the organization is the best method for achieving the sustainable employee engagement required for an organization to thrive. Full engagement represents an alignment of maximum job satisfaction (“I like my work and do it well”) with maximum job contribution (“I help achieve the goals of my organization”). Engaged employees are not just committed. They are not just passionate or proud. They have a line-of- sight on their own future and on the organization’s mission and goals. They are enthused and in gear, using their talents and discretionary effort to make a difference in their employer’s quest for sustainable business success. Full engagement occurs at the alignment of maximum job satisfaction and maximum job contribution. JOB 4© 2013 by BlessingWhite, A Division of GP Strategies. Princeton, NJ. All rights reserved. Employee Engagement Research Update 01/13. Five levels of employee engagement The index we use to determine engagement levels contains items that
  • 23. reflect the two axes of contribution and satisfaction. By plotting a given population against the two axes, we identify 5 distinct employee segments. Level Description The Engaged: High contribution and high satisfaction These employees are at the apex where personal and organizational interests align. They contribute fully to the success of the organization and find great satisfaction in their work. They are known for their discretionary effort and commitment. When recruiters call, they cordially cut the conversation short. Organizations need to keep them Engaged, because they can transition over time to any of the three adjacent segments, a move that would likely impact workforce morale and the bottom line. Almost Engaged: Medium to high contribution and satisfaction A critical group, these employees are among the high performers and are reasonably satisfied with their job. They may not have consistent “great days at work,” but they know what those days look like. Organizations should invest in them for two reasons:
  • 24. They are highly employable and more likely to be lured away; they have the shortest distance to travel to reach full engagement, promising the biggest payoff. Honeymooners & Hamsters: High satisfaction but low contribution Honeymooners are new to the organization or their role – and happy to be there. They have yet to find their stride or clearly understand how they can best contribute. It should be a priority to move them out of this temporary holding area to full alignment and productivity. Hamsters may be working hard, but are in effect spinning their wheels, working on non-essential tasks, contributing little to the success of the organization. Some may even be hiding out, curled up in their cedar shavings, content with their position (“retired in place”). If organizations don’t deal with them, other employees will have to work harder and may grow resentful. Crash & Burners: High contribution but low satisfaction Disillusioned and potentially exhausted, these employees are top producers who aren’t achieving their personal definition of success and satisfaction.
  • 25. They can be bitterly vocal that executives are making bad decisions or that colleagues are not pulling their weight. They may leave, but they are more likely to take a breather and work less hard, slipping down the contribution scale to become Disengaged. When they do, they often bring down those around them. The Disengaged: Low contribution and satisfaction Most Disengaged employees didn’t start out as bad apples. They still may not be. They are the most disconnected from organizational priorities, often feel underutilized, and are clearly not getting what they need from work. They’re likely to be skeptical, and can indulge in contagious negativity. If left alone, the Disengaged are likely to collect a paycheck while complaining or looking for their next job. If they can’t be coached or aligned to higher levels of engagement, their exit benefits everyone, including them. The Engaged The Almost Engaged The Honeymooners
  • 26. & Hamsters The Crash & Burners The Disengaged 5© 2013 by BlessingWhite, A Division of GP Strategies. Princeton, NJ. All rights reserved. Employee Engagement Research Update 01/13. Engagement levels by region – 2011 vs. 2012 Findings In 2012 we witnessed some fairly significant shifts in overall engagement levels within three regions of the study, with North America, India and China all seeing sizeable gains. While no region saw a decrease, Europe and Australia/NZ were essentially flat. Shifts aside, China remains the region with the lowest levels of engagement and India the highest – a long-standing conclusion that highlights the cultural differences between these two countries and dispels the usefulness of the BRICS1 nomenclature in developing human capital strategies. In South America and the GCC – two regions we did not include in previous studies – our first benchmark would indicate:
  • 27. ent of 37% (similar to Australia) for South America (predominantly Brazil); 1 BRICS, originally “BRIC” before the inclusion of South Africa in 2010, is the title of an association of emerging national economies: Brazil, Russia, India, China and South Africa. 33% 30% 37% 17% 36% 0 0 40% 31% 42%
  • 30. 6© 2013 by BlessingWhite, A Division of GP Strategies. Princeton, NJ. All rights reserved. Employee Engagement Research Update 01/13. Looking more precisely at the distribution of engagement levels in each of these regions, we also see differences in profiles: Engagement levels by region GCC 7© 2013 by BlessingWhite, A Division of GP Strategies. Princeton, NJ. All rights reserved. Employee Engagement Research Update 01/13. The strong correlation between engagement and retention is well understood. “Intent to stay,” or an employee’s stated desire to remain with their current employer, is a strong predictor of actual turnover. It is also an indication of how strongly committed an employee is to their current employer’s success. Globally, 60% of all employees report that, given the choice, they plan on remaining with their current organization for the next 12 months. However, this number jumps to 81% among engaged employees but drops to 23% among the disengaged. Naturally, those employees that score higher on the satisfaction scale (Engaged, Almost Engaged,
  • 31. Honeymooners and Hamsters) are most likely to plan on staying. But many factors may influence intent to stay and turnover, so the relationship is not as straightforward as “the engaged stay and the disengaged leave.” For instance, it may be perplexing that 2% of Engaged employees intend on leaving. Conversely, the fact that 23% of the Disengaged plan on staying presents its own issues which we will discuss in the detailed recommendations starting on page 25. These overall numbers are similar to previous studies (82% for Engaged and 27% for Disengaged answering “Yes, definitely” in 2011). Intent to stay (Retention) Intent to stay – global responses by engagement level 2% 5% 17% 9% 32% 17% 33% 46%
  • 35. Probably No Way 8© 2013 by BlessingWhite, A Division of GP Strategies. Princeton, NJ. All rights reserved. Employee Engagement Research Update 01/13. When looking at intent to stay across regions, the dynamics of engagement and economic opportunity start to emerge. While China has relatively low levels of engagement, intent to stay is high (and has risen since 2011). Conversely, in South America we observe a high level of expected mobility and a very large percentage of employees hedging their bets. Intent to stay by region Region Year No Way Probably Yes, definitely Australia/New Zealand 2011 15% 34% 51% 2012 12% 26% 62% North America 2011 13% 32% 56% 2012 12% 33% 55% India
  • 36. 2011 8% 33% 59% 2012 4% 28% 68% Europe 2011 14% 38% 48% 2012 12% 37% 51% South America 2011 – – – 2012 9% 48% 43% GCC 2011 – – – 2012 13% 37% 50% China 2011 16% 29% 55% 2012 12% 21% 67% Global 2011 10% 29% 61% 2012 10% 30% 60% 4% 12% 12% 12% 12% 13%
  • 39. North America Europe Persian Gulf South America Yes, definitely Probably No Way GCCGCCGCC 9© 2013 by BlessingWhite, A Division of GP Strategies. Princeton, NJ. All rights reserved. Employee Engagement Research Update 01/13. Reasons for staying or leaving The general trend reported previously by BlessingWhite remains true:
  • 40. The Engaged stay for what they can give, the Disengaged stay for what they can get. For instance, the Disengaged who intend on staying are less than half as likely to state that the work they do is what keeps them committed, and four times more likely to quote the economy as the biggest barrier to leaving. The Disengaged are also twice as likely to reference desirable job conditions, advantageous benefits or simply “being comfortable here” as reasons for staying. When it comes to those who are planning on leaving, Career still tops the list – to which we can add “a desire for change” (which career mobility inside the organization would address). Finally, there may be some genuine grievances around compensation, but organizations should be very selective in addressing these based on the individual’s performance on the job. Reasons to stay for Engaged and Disengaged Overall Engaged Disengaged My work. I like the work that I do. 34% 38% 16% My organization's mission. I believe in what we do. 16% 19% 14% My career. I have significant development or advancement opportunities here. 17% 17% 19%
  • 41. No desire for change. I am comfortable here. 7% 5% 11% My finances. I expect a desirable salary, bonus, or stock options. 6% 5% 10% My manager. I am committed to this person. 5% 5% 5% My job conditions. I have flexible hours, a good commute, etc. 7% 5% 10% The economy. I don't think there are other job opportunities for me out there. 4% 3% 12% My colleagues. I have strong relationships on the job. 3% 2% 3% 10© 2013 by BlessingWhite, A Division of GP Strategies. Princeton, NJ. All rights reserved. Employee Engagement Research Update 01/13. Age, role/level, tenure correlation The dynamics of age, level and tenure have not fundamentally changed. Prima facie, they are proving to be constants around the world from one study to the next, namely: 1) Engagement increases as you get closer to the top of the organization.
  • 42. 2) Tenure (time with the organization) – engagement increases as employees become more tenured. 3) Time in current role – engagement increases as employees become more vested in their current role. 4) The impact of age – employees become more engaged as they get older. Reasons to leave for Engaged and Disengaged Engaged and Disengaged by level in the organization Overall Engaged Disengaged My career. I don't have opportunities to grow or advance here. 26% 27% 25% My finances. I want to earn more money. 16% 22% 12% My work. I don't like what I do or it doesn't make the most of my talents. 15% 6% 24% My desire for change. I want to try something new. 13% 15% 9% My manager. I don't like working for him or her. 10% 7% 13% My job conditions. I don't have the flexibility, commute, etc., that I need.
  • 43. 8% 10% 7% The economy. I think better jobs in my field are available. 6% 9% 4% My organization's mission. It conflicts with my personal values. 4% 2% 5% My colleagues. I don't want to work with or around them. 2% 3% 2% Level in the Organization % Engaged % Disengaged Executive (Vice President or above) 59% 9% Director 41% 12% Team Leader/Tech Lead/Project Manager 39% 14% Manager/Supervisor 39% 12% Consultant 33% 16% Specialist/Professional/Engineer 29% 20% Administrative/Clerical 27% 21% 11© 2013 by BlessingWhite, A Division of GP Strategies. Princeton, NJ. All rights reserved. Employee Engagement Research Update 01/13. While engagement levels typically increase as you climb the ladder in an organization, disengagement in more senior ranks can have a broad-reaching impact on performance, so organizations looking at engagement should not make the common mistake of focusing purely on the front line of the organization. 59% Engaged at the Executive level still leaves
  • 44. 41% who could benefit from engagement efforts. One dead battery will not jump-start another. You cannot sustain engagement down into the ranks of the organization with disengaged executives or directors. Engaged and Disengaged by job tenure (time in current role) Engagement levels by tenure with company (time with current employer) In both cases (time in current job and time with current employer), the longer an employee has been committed to their current job or employer the higher the levels of reported engagement. 12© 2013 by BlessingWhite, A Division of GP Strategies. Princeton, NJ. All rights reserved. Employee Engagement Research Update 01/13. We do find that looking at these demographics in isolation is somewhat misleading. Age, tenure and seniority are closely related, so it helps to view this as a progression. As employees become more tenured, more experienced in their role, and more secure in their own skills and capabilities, they are able to achieve higher levels of engagement. In a way this trend is to be expected: employees who do not find satisfaction in a role will be more likely to leave their employer or change jobs. Understanding this dynamic informs our engagement efforts.
  • 45. As individuals progress through their personal careers, their focus (in terms of both contribution and satisfaction) evolves. This is particularly important to understand when developing initiatives around: Organizations that have closely studied their own internal engagement dynamics have discovered that there are pivotal points in tenure, when the loss of valuable talent is more likely. These “danger zones” are often department- or function-specific, tend to be in the 3- to 5-year window, and are often correlated to employee age. Knowing when these higher-risk windows occur allows organizations to be proactive in coaching employees through these periods in order to retain critical talent. Engagement levels by age 13© 2013 by BlessingWhite, A Division of GP Strategies. Princeton, NJ. All rights reserved. Employee Engagement Research Update 01/13. Gender In previous reports we observed how gender was not a strong
  • 46. predictor of engagement (i.e., women and men had the same overall engagement levels and patterns) in North America and Europe. Elsewhere in the world, however, there are geographies with significant gender differences: For instance, this chart indicates that in North America men tend to be marginally more Disengaged (2 pts.) and very slightly less likely to be Engaged than women (1 pt.), whereas in India men are substantially more likely to be Engaged (11 pts.) and significantly less likely to be Disengaged (8 pts.) than their female counterparts. As we detail in The Engagement Equation, there are still significant gender gaps in many societies. Far from being a barrier for employers, we believe this represents a significant opportunity for developing a purposeful internal culture that respects diversity and includes all employees in achieving the organization’s goals. Engagement gender gap: point difference between percentage of men and women engaged/disengaged 2% -­‐3% 3% 2%
  • 49. Princeton, NJ. All rights reserved. Employee Engagement Research Update 01/13. Satisfaction and contribution drivers Contribution When asked to “Choose the item that would most improve your performance,” two items compete for first place: access to more resources and greater clarity on what the organization is expecting. These two items are clearly split based on engagement levels, with those already contributing highly looking for more resources. Top contribution drivers by engagement level Engaged Almost Engaged Crash and Burners Honey- mooners and Hamsters Disengaged Overall Greater clarity about what the organization needs me to do – and why
  • 50. 15% 19% 18% 31% 28% 20% More resources 23% 20% 22% 12% 14% 20% Regular, specific feed- back about how I'm doing 21% 20% 13% 23% 13% 19% Development opportuni- ties and training 17% 18% 22% 14% 19% 18% A coach or a mentor other than my manager 12% 11% 13% 10% 13% 11% Better communication with my manager 6% 7% 7% 8% 9% 7% A better relationship with my coworkers 5% 5% 5% 3% 5% 5% While contribution drivers do vary significantly based on engagement levels, they also vary based on the regions we studied, and this should inform how an engagement strategy may be adjusted to be relevant to a regional office or facility (see next page).
  • 51. 15© 2013 by BlessingWhite, A Division of GP Strategies. Princeton, NJ. All rights reserved. Employee Engagement Research Update 01/13. Top 3 contribution drivers by region (across all engagement levels) North America Europe China India GCC Australia/NZ South America 1. More resources 1. More resources 1. Regular, specific feed- back about how I’m doing 1. Greater clarity about what the organization needs me to do – and why
  • 52. 1. Develop- ment oppor- tunities and training 1. Develop- ment oppor- tunities and training 1. Develop- ment oppor- tunities and training 2. Greater clarity about what the organization needs me to do – and why 2. A coach or a mentor other than my manager 2. Develop- ment oppor- tunities and training 2. Regular, specific feed-
  • 53. back about how I’m doing 2. Greater clarity about what the organization needs me to do – and why 2. More resources 2. Regular, specific feed- back about how I’m doing 3. A coach or a mentor other than my manager 3. Regular, specific feedback about how I’m doing / Greater clarity about what the organization needs me
  • 54. to do – and why [Tied for 3rd place] 3. Greater clarity about what the organization needs me to do – and why 3. Develop- ment oppor- tunities and training 3. Regular, specific feed- back about how I’m doing 3. Regular, specific feed- back about how I’m doing 3. Greater clarity about what the organization needs me to do – and why
  • 55. 16© 2013 by BlessingWhite, A Division of GP Strategies. Princeton, NJ. All rights reserved. Employee Engagement Research Update 01/13. Top satisfaction drivers by engagement level Satisfaction Engaged Almost Engaged Crash and Burners Honey- mooners and Hamsters Disengaged Overall More opportunities to do what I do best 24% 24% 25% 25% 23% 24% Career development opportunities and train- ing
  • 56. 24% 25% 26% 21% 23% 24% More flexible job condi- tions (e.g., control over how my work gets done, flex time, telecommuting) 13% 11% 12% 10% 11% 11% More challenging work 11% 10% 11% 10% 11% 11% Improved cooperation among my coworkers 10% 8% 6% 5% 7% 8% Greater clarity about what the organization needs me to do – and why 6% 8% 6% 14% 11% 8% Greater clarity about my own work preferences and career goals 7% 8% 8% 8% 8% 7% A better relationship with my manager 6% 6% 6% 8% 7% 6% It is worth noting that while “Improved cooperation among my coworkers” is chosen by 8% of
  • 57. employees overall, it is chosen by 14% of Executives (VP and above) as the item most likely to improve their satisfaction. This points to a deepening divergence of agendas and a clash of personalities higher up in organizations. 17© 2013 by BlessingWhite, A Division of GP Strategies. Princeton, NJ. All rights reserved. Employee Engagement Research Update 01/13. Top 3 satisfaction drivers by region (across all engagement levels) North America Europe China India GCC Australia/NZ South America 1. More opportuni- ties to do what I do best 1. More opportuni- ties to do what I do best 1. Career
  • 58. develop- ment oppor- tunities and training 1. Career develop- ment oppor- tunities and training 1. Career develop- ment oppor- tunities and training 1. Career develop- ment oppor- tunities and training 1. Career develop- ment oppor- tunities and training 2. Career develop- ment oppor- tunities and training 2. Career
  • 59. develop- ment oppor- tunities and training 2. More opportuni- ties to do what I do best 2. More opportuni- ties to do what I do best 2. More opportuni- ties to do what I do best 2. More opportuni- ties to do what I do best 2. More opportuni- ties to do what I do best 3. More flex-
  • 60. ible job conditions 3. More flex- ible job conditions 3. Greater clarity about my own work preferences and career goals 3. More chal- lenging work 3. More chal- lenging work 3. More flex- ible job conditions 3. Greater clarity about what the orga- nization needs me to do – and why
  • 61. Unlike contribution drivers, there is significant agreement on what would increase personal satisfaction: “More opportunities to do what I do best” and “Career development opportunities and training” rank highest in every region we studied. Career We articulated in previous research reports the importance of career to individuals, and the opportunity that exists for organizations to take the lead in defining career to align with the organization’s long- term talent requirements. Our 2012 data indicates that, worldwide, employees reporting having greater career opportunities than they did in early 2011 – today 59% of respondents agree or strongly agree to the statement, “I have career opportunities in this organization.” In 2011 only 50% agreed. “I have career opportunities in this organization” 2011 vs. 2012 21% 19% 29% 22% 50% 59% 0%
  • 63. 18© 2013 by BlessingWhite, A Division of GP Strategies. Princeton, NJ. All rights reserved. Employee Engagement Research Update 01/13. It’s clear that having career opportunities is a strong contributor to satisfaction for employees, but it’s also a strong indicator of whether or not employees see opportunities to align their skills and ambitions to the organization’s talent needs. “I have career opportunities in this organization” by engagement level – 2012 “I have career opportunities in this organization” by region - 2012 8% 13% 30% 22% 45% 14% 22%
  • 70. America Agree or Strongly Agree Neither Agree/Disagree Disagree or Strongly Disagree GCC 19© 2013 by BlessingWhite, A Division of GP Strategies. Princeton, NJ. All rights reserved. Employee Engagement Research Update 01/13. Trust in Managers The following graph speaks volumes about the correlation between manager trust and engagement. Looking at global data, we see a very tight relationship between engagement levels and manager trust: While this in itself does not point to causation it stands to reason that managers who develop an
  • 71. awareness of trust, and how to earn it, will have much greater success in engaging their team members. If we look at change since 2011, we notice an improvement in trust levels across the board with the biggest shift among the Crash & Burn group and a smaller gain among the Disengaged and Almost Engaged: “I trust my manager” responses by engagement level – 2012 “I trust my manager” favorable responses by engagement level, 2011 vs. 2012 Agree or Strongly Agree 2011 2012 Engaged 89% 90% Almost Engaged 81% 84% Crash & Burners 63% 70% Honeymooners & Hamsters 70% 70% Disengaged 48% 51% 20© 2013 by BlessingWhite, A Division of GP Strategies. Princeton, NJ. All rights reserved. Employee Engagement Research Update 01/13. While trust in one’s immediate manager varies from one region
  • 72. of the world to the next, managers generally enjoy decent levels of trust: “I trust my manager” responses by region - 2012 Managers: the importance of being known As part of our ongoing research, we have focused increasingly on the relationship between the individual and their immediate manager. We have found compelling correlations between an employee knowing their manager well as a person and key working dynamics such as effective use of talents, rewards and recognition, providing regular feedback etc. So who benefits the most from getting to know their manager as a person? We asked respondents to rank their manager on a number of important aspects of their working relationship such as delegating tasks and utilizing talents. We also asked them how well they knew their manager as a person. By cross-referencing the two we can see clear patterns of who most benefits from knowing their boss better. Naturally this correlation between knowing your manager as a person and working effectively day-to- day is closely correlated to engagement. While they do benefit greatly, Engaged employees appear much more tolerant of not knowing their manager as a person. When it comes to scoring their direct manager on these 8 critical items, the gap between engaged employees who know their manager well and those who don’t is not nearly as large as the gap for the other 4 less-engaged segments.
  • 76. Agree/Disagree Disagree / Strongly Disagree GCC 21© 2013 by BlessingWhite, A Division of GP Strategies. Princeton, NJ. All rights reserved. Employee Engagement Research Update 01/13. So while engaged employees have other factors to hold onto (interesting work, a sense of contribution, career hopes), less-engaged employees are far more dependent on knowing their manager as a person to reach higher levels of engagement. This becomes apparent if we look at the average gap over all 8 of the factors in our most recent study, by engagement level: So what does this mean in practice? While companies focus on equipping managers with tactical skills such as delegation or matching individual talents to tasks, engagement is driven more effectively through leadership and connection skills. Particularly difficult for a manager is the challenge of authenticity – because they are typically being taught how to behave, how to “play a role.” In actual fact, it’s becoming better known as a person to their direct reports – not being the person they think they ought to be – that will build the relationship needed to increase
  • 77. engagement. Trust in executives The way that employees interact with and perceive senior executives is very different from their relationship with their manager. It is important for us to understand this distinction in equipping every level of an organization to build a culture of engagement. Average gap in manager favorability between those who report knowing their manager well and those who don’t – 2012 Engaged Almost Engaged Crash and Burners Honeymoon- ers and Hamsters Disengaged Grand Total China 14% 10% 19% 12% 46% 30% Aus/NZ 37% 46% 37% 57% 79% 54% India 47% 51% 63% 67% 58% 58% North America
  • 78. 41% 49% 56% 59% 64% 59% South America 33% 56% 60% 15% 43% 48% GCC 16% 33% 57% 61% 61% 46% Europe 22% 48% 47% 59% 59% 52% Global 22% 48% 47% 59% 59% 52% 22© 2013 by BlessingWhite, A Division of GP Strategies. Princeton, NJ. All rights reserved. Employee Engagement Research Update 01/13. At a high level, trust in senior leaders has seen a slight increase overall, from 61% to 65% of employees who agree or strongly agree with the statement “I trust the senior leaders of this organization.” As we might expect this also correlates closely to engagement levels: 2011 2012 Engaged 85% 85% Almost Engaged 68% 70% Crash & Burners 40% 47% Honeymooners & Hamsters 57% 56% Disengaged 27% 30%
  • 79. Total 61% 65% “I trust senior leaders in this organization” responses by region – 2012 20% 4% 25% 7% 22% 18% 15% 22% 18% 25% 15% 21% 21%
  • 82. GCC 23© 2013 by BlessingWhite, A Division of GP Strategies. Princeton, NJ. All rights reserved. Employee Engagement Research Update 01/13. What are executives (perceived to be) good at? And where are they weak? While executives do not get to interact one-on-one with every employee, their role in building a culture of engagement is pivotal. Setting the tone, fostering a purposeful culture and establishing an inspiring vision of the future are all important prerequisites to building engagement across the enterprise. Along with trust levels, employees are scoring senior leaders marginally better on the four key engagement actions we have tracked between studies: % agree or strongly agree Change since 2011 (percentage points) Gap between the Engaged and Disengaged who agree
  • 83. (percentage points) Senior leaders act in alignment with our organiza- tion’s core values or guiding principles. 61% +2 17 Senior leaders communicate honestly. 56% +3 18 Senior leaders link the work of the organization to a larger purpose. 62% +2 18 Senior leaders have created a work environment that drives high performance. 50% +1 20 24© 2013 by BlessingWhite, A Division of GP Strategies. Princeton, NJ. All rights reserved. Employee Engagement Research Update 01/13. Notes 25© 2013 by BlessingWhite, A Division of GP Strategies. Princeton, NJ. All rights reserved. Employee Engagement Research Update 01/13. As we continue to track employee trends around the world, we
  • 84. are watching the evolution of the employee/employer relationship through economic cycles. But 3 key elements are essential to informing our approach to developing an engagement strategy: 1) How an employee relates to his or her job and employer (current and future). 2) How managers work with individual employees to address individual engagement drivers and foster positive team dynamics. 3) How executives create an inspiring vision for the future and foster a purposeful culture that makes engagement a core driver of business results. Engagement needs to be part of your culture Organizations that have made substantive progress in fueling business success through employee engagement have approached this transformation as a culture change exercise. They may not explicitly describe it that way, but the transformation was the result of a deliberate focus on establishing a foundation of employee engagement and driving engagement at every level of the organization. In the most successful organizations, engagement and results are discussed regularly – in the same breath. We identify 6 main elements for building a culture of engagement. While these are not lockstep phases in a process, there is a natural sequence: Recommendations Take Action
  • 85. Build Commitment Create Engagement Champions Equip People Measure Progress Align Practices 26© 2013 by BlessingWhite, A Division of GP Strategies. Princeton, NJ. All rights reserved. Employee Engagement Research Update 01/13. Build Commitment Does your organization have a shared, actionable defi- nition and a common language for discussing engage- ment? Most don’t, yet engage in extensive post-survey action planning. In building commitment you need to clarify what you and your company are committing to – and why it is impor- tant. Start with the business case and securing Senior Leader Buy-In. Create Engagement Champions Unless your organization is small, you cannot build a cul-
  • 86. ture of engagement on your own, even with the support of senior leaders. Champions allow your organization to: } Expand the engagement message reach. } Educate colleagues on what engagement is, why it is important, and how to influence it. } Help leaders interpret, communicate, and act on survey findings. } Support managers as they tackle engagement with their teams. } Help in gathering insights and feedback from the front lines. Equip People It may seem obvious, but if you need people to play par- ticular roles, you must prepare them to do so. Everyone needs to understand those expectations and assume own- ership of their piece of the puzzle. Provide the context, articulate the vision and equip every level. Align Practices Too often, engagement is undermined by policies and practices that drive only results – or are simply painfully bureaucratic. Successful culture change requires that your operational engine drive engagement as well as your strategic priorities. Measure Progress So how will you know if you are succeeding in creating a culture of engagement? Engagement surveys, pulse sur- veys, and the metrics you use already to run your busi- ness can provide insights.
  • 87. Stay close to the financial, customer, value chain, and human capital metrics that your organization already tracks. You may not be able to determine that higher engagement is explicitly driving success, but you will be able to show a strong correlation between your engage- ment efforts and improved numbers that matter. Take Action If you’re measuring progress toward creating a culture of engagement well, you’ll end up with actionable insights. Encouraging dialogue and planning at the team level provides a valuable feedback loop. The aim of this phase is to transition from a corporate objective (creating a culture of engagement) to actions that will tackle engagement at the local level. 27© 2013 by BlessingWhite, A Division of GP Strategies. Princeton, NJ. All rights reserved. Employee Engagement Research Update 01/13. A Daily Priority: the IME approach If you want to build a culture of engagement you need to move away from a survey-driven process that results in lists of remedial actions assigned to ill-prepared managers. If engagement is to become a daily priority, it has to be a shared responsibility. Leaders and managers cannot and should not shoulder the entire burden of engaging your workforce. Every member needs to play a role (or several roles), as individuals (I), managers (M), or executives (E).
  • 88. So you must develop a focus on engagement which maps out roles and responsibilities at each level of the organization. Individuals At the individual level, drivers of satisfaction and contribution will vary, as will longer-term aspirations and career goals. While the organization can help an individual examine and gain clarity on these, it does demand a partnership and a proactive participation from the individual. No individual can expect the organization to make them engaged. Individuals need to ACT on engagement, namely: priorities. put together a plan on how to address their personal engagement drivers to reach higher levels of contribution and satisfaction. – with their manager’s support start to change those items they can and track their progress throughout the year. Managers Managers tend to be on the sharp end of the wedge when it comes to engagement. They are under pressure from senior management to produce results, burdened with expectations that they can engage their teams, and often divided between managing others and completing their own tasks. When the annual engagement survey rolls around it’s on their shoulders
  • 89. that the action plans land, and typically they have been given little context and no option about participating or not. Finally, managers need to worry about their own personal engagement equation. Managers need to CARE about engagement, namely: satisfaction. organization’s strategy, mission, and values. out what’s important to both parties, while at the same time engaging themselves. 28© 2013 by BlessingWhite, A Division of GP Strategies. Princeton, NJ. All rights reserved. Employee Engagement Research Update 01/13. There is an important caveat to the CARE model. Managers must drop the veil of their position or title, and become better known to employees. That doesn’t necessarily mean being their buddy. But it does mean sharing personal motivation for work, challenges, appropriate weaknesses, the reasons they came to your organization, and why they stay there. Engagement is a case of give and take – of gaining satisfaction and giving contribution. Once engagement has been achieved there are many factors that may
  • 90. cause it to get out of balance, one being the constant shifting and redirecting of organizational strategy and direction. As each department or team changes tack, it is up to the manager to ensure that employees make course corrections to stay aligned with the most immediate priorities. Executives Executives are not in the position to coach and align the personal interests of each and every employee. They must set the direction that the workforce aligns to, communicate that direction to ensure a clear line-of-sight throughout your organization, and create a culture that fuels engagement and business results. They must also fulfill the role of manager and individual as previously described. We understand that this is a tall order. We need to look at the priorities of executives in leading a workforce to higher engagement from the perspective of the leaders’ followers. Our focus therefore is not on the intrinsic qualities that make an effective leader but instead is about asking, “What are the needs of followers that a leader needs to fulfill?” We find it useful to talk about how you build your CASE (Community, Authenticity, Significance, and Excitement). These are core needs of the 21st century workforce (the followers) and are useful in delivering results as well as engagement: Community for a sense of belonging and purpose
  • 91. – and raise the bar on – high performance 29© 2013 by BlessingWhite, A Division of GP Strategies. Princeton, NJ. All rights reserved. Employee Engagement Research Update 01/13. Organizational practices Finally, you need to take a look at the organizational level and critically revisit policies, practices and procedures and ask yourself: do these help or hinder in our engagement efforts? A common list of practices that we find fail to support engagement in many corporations include: around priorities and work preferences. awkward form-filling by managers and a once- a-year scorecard that fails to truly align employees to the organization’s priorities. nt opportunities and not individual potential. nobody challenges, and that add no value but have become a fixture. low-performing team member rather than seek to replace him or her with a higher-potential candidate.
  • 92. Alignment is key Increasingly, we find that a key to building engagement in most organizations is a focus on alignment. Never assume that staff understand and are able to align to what the organization needs. Many employees report “Greater clarity about what the organization needs me to do – and why” as a top driver of contribution. Furthermore, it is being able to contribute and know that this contribution is recognized that drives an employee’s satisfaction. In this sense contribution and satisfaction are mutually reinforcing. So while many organizations approach engagement from the perspective of “what will make our employees more satisfied,” the answer is sometimes surprising: it’s more opportunities to contribute! But opportunities that are also in line with the aspirations and strengths of the individual. Less, less, more, more – collect the data you need to understand local needs and take action Having the right data to inform your engagement efforts is important, especially if this data allows you to draw a straight line between engagement levels and organizational outputs. But beware: the survey scores are not the prize, and there is a risk of letting survey scores dictate rather than inform your efforts. Consequently we recommend: – achieving specific engagement targets or getting a passable scorecard is not the goal.
  • 93. – the survey process is too often used as a catch-all. effectively be used as a dashboard metric and not just a once-a-year audit. tied to the business’s current ambitions and strategic efforts. 30© 2013 by BlessingWhite, A Division of GP Strategies. Princeton, NJ. All rights reserved. Employee Engagement Research Update 01/13. Dialogue on career pays off Career (in the broad sense) remains high on every employee’s list of needs. As we detailed in the previous pages, two factors consistently top the list of satisfaction drivers for employees in nearly every region in the world and across every engagement level: “career development opportunities and training” and “more opportunities to do what I do best.” See the table called Top 3 Satisfaction Drivers by region (across all engagement levels) on page 17. Yet career development is often dismissed by management for several reasons: employees job hop, business plans change, the economy makes long-term planning difficult, and budgets simply aren’t available for career initiatives. While more people report having career opportunities today than in 2011, employees are largely
  • 94. cynical about their employer’s attempts to support their careers and disappointed by the resources they receive. For the most part, they believe, they will forge a career in spite of their company’s policies and procedures. But dig deeper, and you find that what is lacking is clarity: Most employees do not have clarity around their career aspirations or drivers of job satisfaction. As traditional career ladders disappear, it becomes important for organizations to help define the primary guideposts that individuals should use to redefine and navigate today’s uncharted career landscape. Employees who are truly striving to achieve full engagement for their own sake would ideally stop looking to a new employer and start developing a personal career path or series of projects internally, in accordance with the company’s shifting priorities. The bottom line: if employees understand what matters to them, what they offer, and where they can make a difference for their employer, they will be better able to make the right choices – and also position themselves as the right people to get the work done. Savvy enterprises see a bigger picture: career development is one critical piece in a more complex talent management strategy that often includes succession planning, performance management, redeployment, and targeted development to make sure the organization performs as its markets evolve. When employees see career as encompassing lateral moves, skill development, stretch assignments, and special projects – not just promotions or advancement – they
  • 95. will find more satisfying opportunities with you, their current employer. If you provide an exciting journey, people will stop wondering about what the stops are called along the way. 31© 2013 by BlessingWhite, A Division of GP Strategies. Princeton, NJ. All rights reserved. Employee Engagement Research Update 01/13. Start by establishing three cornerstones of career development success: 1. Individuals must own their careers and not rely on their employers or managers to take the initiative. 2. The organization must have a point of view about career development, and provide the tools and structure that allow employees to develop in their careers in the context of what the organization needs. 3. Managers stand at the crossroads where their team members’ capabilities and goals meet the organization’s priorities. They need to understand and buy- in to the organization’s career development point of view. They also must be competent and confident in supporting (not directing) employees’ career journeys. It is the role of your managers to help employees realistically align their aspirations with the organization’s goals. Disengaged cause drag: coach up or coach out Every sizable organization will have a proportion of its workforce in the Disengaged group. This is
  • 96. simply the dynamics of a modern workforce. It is tempting to invest a lot of time in re-engaging this group, but that is rarely the best use of time. Disengagement is contagious and causes drag in terms of low contribution, and failing to address disengagement may be a tacit signal that the organization (or the manager) tolerates sub-par performance. So what is a manager to do with a Disengaged team member? The answer is to coach up or coach out. Coach up Give the employee the opportunity to engage in a dialogue with the manager and address the root cause of their disengagement, seeking ways to contribute at a higher level – and in doing so get to higher levels of engagement. Coach out If the employee has turned an emotional corner and is unwilling to make the effort (or if the job fit is truly so bad that course correction is not enough) then it will be better for both parties to part ways. At the end of the day, a Disengaged employee should be given the two options above. The third option of staying put and doing nothing should not be on the table. 32© 2013 by BlessingWhite, A Division of GP Strategies. Princeton, NJ. All rights reserved. Employee Engagement Research Update 01/13.
  • 97. This report is based on 7,068 responses from around the world. Regions reported are those where sufficient number of responses were collected to provide meaningful regional analysis. South America and the GCC were not reported separately in the 2011 report. Methodology Our online survey consisted of 27 multiple-choice items. Everyone answered the first 25 items. The remaining items varied based on respondents’ answers to item 25, which explored intent to stay. The survey link was emailed to European and North American respondents in May to August 2012 and to Asian respondents in September to November 2012. Individuals invited to respond represented a cross-section of geographic regions, job functions, roles, and industries. To round out the multi-layered workforce perspective, we conducted about 30 interviews with HR and line leaders around the world. Many of these interviews were also featured in our 2012 book The Engagement Equation (Wiley). Global respondent profile n North America, 27% in India, 10% in Europe, 4% in Australia/New Zealand, 4% from the GCC, and 3.1% from South America 9% indicating that they are a vice
  • 98. president or above - 1964), 33% are Generation X (born 1965 - 1977), and 35% are Generation Y or Millennials (born 1978 - 1994) people and 57% work for organizations with fewer than 5,000 people same location, with only 13% labeling themselves as virtual workers and 31% have been with their organizations for more than 7 years year and 14% of employees have held their position for more than 7 years environment About this report A Division of GP Strategies
  • 99. LEADING TRANSITION: A NEW MODEL FOR CHANGE by William Bridges and Susan Mitchell Bridges Change is nothing new to leaders, or their constituents. We understand by now that organizations cannot be just endlessly "managed," replicating yesterday's practices to achieve success. Business conditions change and yesterday's assumptions and practices no longer work. There must be innovation, and innovation means change. Yet the thousands of books, seminars, and consulting engagements purporting to help "manage change" often fall short. These tools tend to neglect the dynamics of personal and organizational transition that can determine the outcome of any change effort. As a result, they fail to address the leader's need to coach others through the transition process. And they fail to acknowledge the fact that leaders themselves usually need coaching before they can effectively coach others. In years past, perhaps, leaders could simply order changes. Even today, many view it as a straightforward process: establish a task force to lay out what needs to be done, when, and by whom. Then all that seems left for the organization is (what an innocent sounding euphemism!) to implement the plan. Many leaders imagine that to make a change work, people needed only to follow the plan's implicit map, which shows how to get from here (where things stand now) to there (where they'll stand after the plan is implemented). "There" is also where the organization needs to be if it is to
  • 100. survive, so anyone who has looked at the situation with a reasonably open mind can see that the change isn't optional. It is essential. Fine. But then, why don't people "Just Do It"? And what is the leader supposed to do when they Just Don't Do It -- when people do not make the changes that need to be made, when deadlines are missed, costs run over budget, and valuable workers get so frustrated that when a headhunter calls, they jump ship. Leaders who try to analyze this question after the fact are likely to review the change effort and how it was implemented. But the details of the intended change are often not the issue. The planned outcome may have been the restructuring of a group around products instead of geography, or speeding up product time- to-market by 50 percent. Whatever it was, the change that seemed so obviously necessary has languished like last week's flowers. That happens because transition occurs in the course of every attempt at change. Transition is the state that change puts people into. The change is external (the different policy, practice, or structure that the leader is trying to bring about), while transition is internal (a psychological reorientation that people have to go through before the change can work). The trouble is, most leaders imagine that transition is automatic -- that it occurs simply because the change is happening. But it doesn't. Just because the computers are on everyone's desk doesn't mean that the new individually accessed customer database is transforming operations the way the consultants promised it would. And just because two companies (or hospitals or law
  • 101. firms) are now fully "merged" doesn't mean that they operate as one or that the envisioned cost savings will be realized. Even when a change is showing signs that it may work, there is the issue of timing, for transition happens much more slowly than change. That is why the ambitious timetable that the leader laid out to the board turns out to have been wildly optimistic: it was based on getting the change accomplished, not on getting the people through the transition. Transition takes longer because it requires that people undergo three separate processes, and all of them are upsetting. Saying Goodbye. The first requirement is that people have to let go of the way that things -- and, worse, the way that they themselves -- used to be. As the folk-wisdom puts it, "You can't steal second base with your foot on first." You have to leave where you are, and many people have spent their whole lives standing on LEADING TRANSITION: A NEW MODEL FOR CHANGE by William Bridges and Susan Mitchell Bridges first base. It isn't just a personal preference you are asking them to give up. You are asking them to let go of the way of engaging or accomplishing tasks that made them successful in the past. You are asking them
  • 102. to let go of what feels to them like their whole world of experience, their sense of identity, even "reality" itself. On paper it may have been a logical shift to self-managed teams, but it turned out to require that people no longer rely on a supervisor to make all decisions (and to be blamed when things go wrong). Or it looked like a simple effort to merge two work-groups, but in practice it meant that people no longer worked with their friends or reported to people whose priorities they understood. Shifting into Neutral. Even after people have let go of their old ways, they find themselves unable to start anew. They are entering the second difficult phase of transition. We call it the neutral zone, and that in- between state is so full of uncertainty and confusion that simply coping with it takes most of people's energy. The neutral zone is particularly difficult during mergers or acquisitions, when careers and policy decisions and the very "rules of the game" are left in limbo while the two leadership groups work out questions of power and decision making. The neutral zone is uncomfortable, so people are driven to get out of it. Some people try to rush ahead into some (often any) new situation, while others try to back-pedal and retreat into the past. Successful transition, however, requires that an organization and its people spend some time in the neutral zone. This time in the neutral zone is not wasted, for that is where the creativity and energy of transition are found and the real transformation takes place. It's like Moses in the wilderness: it was there, not in the Promised Land, that Moses was given the Ten Commandments; and it was there, and not in The Promised Land, that his
  • 103. people were transformed from slaves to a strong and free people (see "Lessons from the Wilderness"). Today, it won't take 40 years, but a shift to self-managed teams, for instance, is likely to leave people in the neutral zone for six months, and a major merger may take two years to emerge from the neutral zone. The change can continue forward on something close to its own schedule while the transition is being attended to, but if the transition is not dealt with, the change may collapse. People cannot do the new things that the new situation requires until they come to grips with what is being asked. Moving Forward. Some people fail to get through transition because they do not let go of the old ways and make an ending; others fail because they become frightened and confused by the neutral zone and don't stay in it long enough for it to do its work on them. Some, however, do get through these first two phases of transition, but then freeze when they face the third phase, the new beginning. For that third phase requires people to begin behaving in a new way, and that can be disconcerting -- it puts one's sense of competence and value at risk. Especially in organizations that have a history of punishing mistakes, people hang back during the final phase of transition, waiting to see how others are going to handle the new beginning. Helping Leaders to Lead Change Understanding the transition process is a requirement for almost any senior executive. However, it is when the organization is in transition that leaders themselves often need help. They are so close to the changes
  • 104. that have been launched that they may fail to terms with the necessary change -- and that their followers will need at least as long to do so (see figure) believe that their followers are ignorant, rigid, or outright hostile to the new direction themselves, that are holding people back and thereby threatening to make their change unworkable. http://www.leadertoleader.org/knowledgecenter/L2L/spring2000 /bridges.html#lessons http://www.leadertoleader.org/knowledgecenter/L2L/spring2000 /bridges.html#figure LEADING TRANSITION: A NEW MODEL FOR CHANGE by William Bridges and Susan Mitchell Bridges The Marathon Effect The higher a leader sits in an organization the more quickly he or she tends to move through the change process. Because they can see the intended destination before others even know the race has begun, senior managers can forget that others will take longer to make the transition: letting go of old ways, moving
  • 105. through the neutral zone, and, finally, making a new beginning. Most leaders come from backgrounds where technical, financial, or operational skills were paramount, and those skills provide little help when it comes to leading people through transition. Such leaders may be pushing the limits of their understanding of the future, and they need perspective and advice. That is where a trusted colleague, confidant, coach, or consultant can offer valuable counsel to the leader. This person's background or professional affiliation can vary widely; what matters is that she or he understands how to help people through transition. It is a role that is far more interpersonal and collaborative than is played by most consultants or trainers accustomed to teaching a skill or prescribing a solution. No training program can prepare a leader for managing a transition. Yet no leader can effectively lead change -- which is what leadership is all about -- without understanding and, ultimately, experiencing -- the transition process. What leaders need, instead, is individualized assistance whereby they learn to transition that they face -- not through generic "change." A trainer can teach leaders a generalized approach ("The Ten Steps..."), but a good coach can help the leaders to discover their own best approaches. create a development plan that prepares them for
  • 106. the future. Times of transition are becoming the rule rather than the exception. Yet few leaders know how to prepare for the changes that lie ahead. Transition leadership skills must be congruent with, must capitalize and build on, the leader's own strengths and talents. They cannot be found in a set of theoretical leadership skills. The transition adviser works collaboratively with each leader to assess the leader's place in the three-part transition process, the strengths the leader brings and how to leverage them, and what the current situation demands. It is a personal and completely customized process. Few leaders know how to prepare for the challenges ahead. LEADING TRANSITION: A NEW MODEL FOR CHANGE by William Bridges and Susan Mitchell Bridges A Method to Managing Transition Although the details of a transition management plan are unique to each situation, the adviser must help a
  • 107. leader with the following essential steps: 1. Learn to describe the change and why it must happen, and do so succinctly -- in one minute or less. It is amazing how many leaders cannot do that. 2. Be sure that the details of the change are planned carefully and that someone is responsible for each detail; that timelines for all the changes are established; and that a communications plan explaining the change is in place. 3. Understand (with the assistance of others closer to the change) just who is going to have to let go of what -- what is ending (and what is not) in people's work lives and careers -- and what people (including the leader) should let go of. 4. Make sure that steps are taken to help people respectfully let go of the past. These may include "boundary" actions (events that demonstrate that change has come), a constant stream of information, and understanding and acceptance of the symptoms of grieving, as well as efforts to protect people's interests while they are giving up the status quo. 5. Help people through the neutral zone with communication (rather than simple information) that emphasizes connections with and concern for the followers,. To keep reiterating the "4 P's" of transition communications: The purpose: Why we have to do this The picture: What it will look and feel like when we reach our
  • 108. goal The plan: Step-by-step, how we will get there The part: What you can (and need to) do to help us move forward. 6. Create temporary solutions to the temporary problems and the high levels of uncertainty found in the neutral zone. For example, one high-tech manufacturer, when announcing the closing of a plant, made interim changes in its usual reassignment procedures, bonus compensation plans, and employee communications processes to make sure that displaced employees suffered as little as possible, both financially and psychologically. Such efforts should include transition monitoring teams that can alert the leader to unforeseen problems -- and disband when the process is done. 7. Help people launch the new beginning by articulating the new attitudes and behaviors needed to make the change work -- and then modeling, providing practice in, and rewarding those behaviors and attitudes. For example, rather than announcing the grandiose goal of building a "world-class workforce," leaders of transition must define the skills and attitudes that such a workforce must have, and provide the necessary training and resources to develop them. Coaching for Change Since the ability to manage transition is tied to the realities of an actual leader in an actual situation, mutual trust between adviser and leader is essential. Only that way can
  • 109. leaders be honest enough to bring their fears and concerns to the surface quickly, hear what the situation is really "saying" rather than focusing on a program that a consultant is trying to sell, and gain the personal insight and awareness of the transition process that can be carried into the future. Because this transition management relationship is a close and ongoing one, the adviser gets to know the leader's situation well and follows it as it changes. Understanding the dynamics of transition is far removed from the kind of leadership training most organizations provide. Traditional trainers and consultants seldom possess such intimate knowledge of their client. Whatever personal coaching they provide is usually LEADING TRANSITION: A NEW MODEL FOR CHANGE by William Bridges and Susan Mitchell Bridges subsumed to the teaching of a generic skill or body of knowledge. And because the relationship is time- limited, there is a natural pressure to produce quick, clear results. However, because transition advisers work within the context of the situation at hand, their focus is not on how to "be a leader" or even how to "change an organization" but on how to provide the particular kind of leadership that an organization in transition demands. For that reason, the results of the relationship are
  • 110. very specific: the development of new skills and behaviors geared to the needs of the unique time and circumstances in which the person leads. New Models of Leadership Once you understand transition, you begin to see it everywhere. You realize that many of the issues commonly addressed as leadership, learning, or organizational development challenges are really an inevitable part of transition. Indeed, in today's organizations, without experiencing and successfully managing a difficult transition, no leader can be effective for very long. That suggests reinventing most models of leadership development. The best leadership development programs implicitly address the challenge of understanding change -- they are experiential, tailored to the needs of the leader, and based on delivering real-world results. But most could be strengthened by explicit attention to transition management. The final lesson that the process of transition holds for leadership development is that the relationship between adviser and leader is not much different from that between a leader and the people that she or he "leads." We treat that word ironically because the leadership that is appropriate to a modern, fast-moving organization -- where work is based on task and mission rather than job description, and is distributed among contributors inside and outside one's organization -- takes on a new meaning. It is not the drum- major-at-the-head-of-the-parade leadership appropriate to yesterday's organization; rather it is the give- and-take, person-centered leadership by which the sports coach gets the best effort out of each member of a team.
  • 111. The kind of leadership most effective today is similar to the kind of service that the best consultant gives a client: collaborative assistance that is both problem-solving and developmental. Its target is both the situation and the professional capability of the person. Today's leader, in a fundamental sense is a coach, and the leader can best learn that role by being coached. Copyright © 2000 by William Bridges and Susan Mitchell Bridges. Reprinted with permission from Leader to Leader, a publication of the Leader to Leader Institute and Jossey-Bass. Without successfully managing a difficult transition, no leader can be effective for very long.