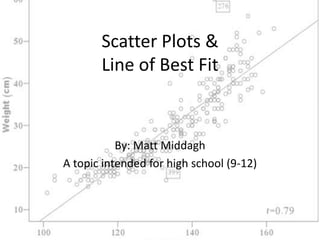
SlideShare a Scribd company logo
1 of 20
Scatter Plots &
       Line of Best Fit


           By: Matt Middagh
A topic intended for high school (9-12)
Technology Integration Rationale
              (click title to view YouTube video)


When teaching a lesson on scatter plots and line
 of best fit, technology is necessary to gain a
 large quantity of data from various
 sources, assist in plotting graphs and can help
 create the line of best fit. Using technology
 students can research up to date data and
 interesting statistics regarding meaningful
 topics to them. Technology is also a great way
 to reinforce previously learned skills through
 the endless games and projects offered.
Internet Content
• The Internet offers a wide array of content
  related to statistics. There are numerous
  resources for students of all ages from games to
  work on their skills to projects relating to real life
  current issues or topics of interest. The internet
  also offers numerous instructional videos for
  students to gain an extra edge amongst their
  classmates. There is endless data, constantly
  updating, which provide opportunities for
  students to do research to a topic of interest to
  them.
Blogs


(click to access blog)
Podcasts


(click to access podcast)
YouTube Video


  (click to view video)
Internet Resources
The internet offers a wide variety of statistical
  data that students and teachers can use to
  pull data from to help assist in teaching a
  lesson on scatter plots and line of best fit. The
  following three slides gives three examples of
  government agencies which can offer material
  regarding this topic.
(click to access website)


The United States Census is a great source for
data relative to the people living in the U.S.
Students can use to data provided by the
census to gather information of people from
the entire country and try to find relationships
between different statistics or different parts
of the country.
(click to access website)

The National Center for Education Statistics is a
great website which offers data relating to schools
and education around the country. This is a great
way for students to compare statistics which may
hit them more at home, as they pertain directly to
them and the education system that they are
currently going through. This website offers
information and statistics regarding real problems
and situations that are going on in the school
systems today.
(click to access website)


Monitoring the future is a website setup through the
University of Michigan, and it contains information
regarding the behaviors and attitudes of students in
high schools and colleges. It also offers publications
and survey projects. Students can use this source to
find information and interpret whether there is a
relationship between two behaviors or attitudes.
Steps to Finding Line of Best Fit
Teaching Materials


                                  (click to access worksheet)
      (click to access project)
Above is a project and a worksheet from
  Yummymath.com. The first is one involving the
  popular board game Monopoly where students are
  required to check for a relationship between the
  amount of rent and spaces from go for a property.
  The other is a worksheet which has students practice
  plotting points and coming up with relationships and
  equations for the line of best fit
Teaching Materials Cont.

                  (click to access site)
Above is a link to a sports reference page, where
  I plan to use for a project or performance task.
  It will involve students selecting data from
  their favorite sports, then comparing two
  statistics. They will find if there is any
  correlation between something like wins and
  losses, then they will have to do box-and-
  whisker plots for the data as well.
Teaching Materials Cont.
Onlinemathlearning.com offers a wide variety of
 statistics games for students to play to review
 the topics being discussed in class. It also
 offers worksheets that can be used for later
 lessons in statistics.
Subject Specific Internet Source


This website is a great resource for teaching
any level of math. Teachers can find
activities and lesson plans for just about any
subject. Teachers can search by grade level
or subject matter.
Internet Uses


Online Statistics Education is an online textbook
developed in Rice University as well as University of
Houston Clear Lake and Tufts University. It offers a
textbook in statistics that students can access for free,
as well as simulations to accompany each section.
Internet Uses Cont.
http://www.shodor.org/interactivate/activities/S
  catterPlot/
This is a interactive website where students can
  input data points on to a customized
  graph, generate a line of best fit, and even
  print out their graphs to turn in as
  assignments.
WolframAlpha is an app available for
iPhone, iPad, and Android. It is a great app for math
reference. Students can type in any equation and get
an explanation and solution for it. You can also look
up vocabulary terms for examples and descriptions.
Web 2.0


Evernote is where students can share notes
with each other, as well as collaborate with
others on projects and upload them for
teacher access and comment on.
Rubrics


Rubistar makes it easy to create rubrics for
projects where students are asked to do
research and create their own scatter plots. I
can use the rubric generator to assess them on
things like neatness of the work, accuracy, their
data tables and much more.

More Related Content

What's hot

Data Science and Online Education
Data Science and Online EducationData Science and Online Education
Data Science and Online EducationGeoffrey Fox
 
BrenSchoolofICSAnnualReport2015
BrenSchoolofICSAnnualReport2015BrenSchoolofICSAnnualReport2015
BrenSchoolofICSAnnualReport2015UC Irvine
 
Experimental Economics and Machine Learning workshop
Experimental Economics and Machine Learning workshopExperimental Economics and Machine Learning workshop
Experimental Economics and Machine Learning workshopDmitrii Ignatov
 
Black Box Learning Analytics? Beyond Algorithmic Transparency
Black Box Learning Analytics? Beyond Algorithmic TransparencyBlack Box Learning Analytics? Beyond Algorithmic Transparency
Black Box Learning Analytics? Beyond Algorithmic TransparencySimon Buckingham Shum
 
2020_12_11 «Opening Education with Artificial Intelligence» - Mitja Jermol
2020_12_11 «Opening Education with Artificial Intelligence» - Mitja Jermol2020_12_11 «Opening Education with Artificial Intelligence» - Mitja Jermol
2020_12_11 «Opening Education with Artificial Intelligence» - Mitja JermoleMadrid network
 
Computer science advocacy
Computer science advocacyComputer science advocacy
Computer science advocacyGoose12
 
DataCamp investor pitch deck April 2017
DataCamp investor pitch deck April 2017DataCamp investor pitch deck April 2017
DataCamp investor pitch deck April 2017Jonathan Cornelissen
 
Collaborating Across Boundaries to Engage Journalism Students in Computationa...
Collaborating Across Boundaries to Engage Journalism Students in Computationa...Collaborating Across Boundaries to Engage Journalism Students in Computationa...
Collaborating Across Boundaries to Engage Journalism Students in Computationa...Kim Pearson
 
Computer science advocacy
Computer science advocacyComputer science advocacy
Computer science advocacyDonghua Gu
 
Data Science Curriculum at Indiana University
Data Science Curriculum at Indiana UniversityData Science Curriculum at Indiana University
Data Science Curriculum at Indiana UniversityGeoffrey Fox
 
Why should we study Data Science
Why should we study Data ScienceWhy should we study Data Science
Why should we study Data ScienceAn Mai
 
Portfolio - just some things I'm working on - July 2021
Portfolio - just some things I'm working on - July 2021Portfolio - just some things I'm working on - July 2021
Portfolio - just some things I'm working on - July 2021Christian Bokhove
 

What's hot (20)

Data Science and Online Education
Data Science and Online EducationData Science and Online Education
Data Science and Online Education
 
BrenSchoolofICSAnnualReport2015
BrenSchoolofICSAnnualReport2015BrenSchoolofICSAnnualReport2015
BrenSchoolofICSAnnualReport2015
 
DataMind Pitch August 2013
DataMind Pitch August 2013DataMind Pitch August 2013
DataMind Pitch August 2013
 
Experimental Economics and Machine Learning workshop
Experimental Economics and Machine Learning workshopExperimental Economics and Machine Learning workshop
Experimental Economics and Machine Learning workshop
 
Rcademy pitch 2012
Rcademy pitch 2012Rcademy pitch 2012
Rcademy pitch 2012
 
Statisiticians
StatisiticiansStatisiticians
Statisiticians
 
Black Box Learning Analytics? Beyond Algorithmic Transparency
Black Box Learning Analytics? Beyond Algorithmic TransparencyBlack Box Learning Analytics? Beyond Algorithmic Transparency
Black Box Learning Analytics? Beyond Algorithmic Transparency
 
2020_12_11 «Opening Education with Artificial Intelligence» - Mitja Jermol
2020_12_11 «Opening Education with Artificial Intelligence» - Mitja Jermol2020_12_11 «Opening Education with Artificial Intelligence» - Mitja Jermol
2020_12_11 «Opening Education with Artificial Intelligence» - Mitja Jermol
 
Computer science advocacy
Computer science advocacyComputer science advocacy
Computer science advocacy
 
DataCamp investor pitch deck April 2017
DataCamp investor pitch deck April 2017DataCamp investor pitch deck April 2017
DataCamp investor pitch deck April 2017
 
Collaborating Across Boundaries to Engage Journalism Students in Computationa...
Collaborating Across Boundaries to Engage Journalism Students in Computationa...Collaborating Across Boundaries to Engage Journalism Students in Computationa...
Collaborating Across Boundaries to Engage Journalism Students in Computationa...
 
WEBOMETRICS 2010
WEBOMETRICS 2010WEBOMETRICS 2010
WEBOMETRICS 2010
 
Computer science advocacy
Computer science advocacyComputer science advocacy
Computer science advocacy
 
Data Science Curriculum at Indiana University
Data Science Curriculum at Indiana UniversityData Science Curriculum at Indiana University
Data Science Curriculum at Indiana University
 
DataCamp investor deck April 2015
DataCamp investor deck April 2015DataCamp investor deck April 2015
DataCamp investor deck April 2015
 
Why should we study Data Science
Why should we study Data ScienceWhy should we study Data Science
Why should we study Data Science
 
Pick a Crowd
Pick a CrowdPick a Crowd
Pick a Crowd
 
Job Seeker
Job SeekerJob Seeker
Job Seeker
 
Crltc10
Crltc10Crltc10
Crltc10
 
Portfolio - just some things I'm working on - July 2021
Portfolio - just some things I'm working on - July 2021Portfolio - just some things I'm working on - July 2021
Portfolio - just some things I'm working on - July 2021
 

Similar to Mattmiddaghscatterplotppt

Grande, david math in sports
Grande, david math in sportsGrande, david math in sports
Grande, david math in sportsDave Grande
 
Advancing Statistical Education using Technology and Mobile Devices
Advancing Statistical Education using Technology and Mobile DevicesAdvancing Statistical Education using Technology and Mobile Devices
Advancing Statistical Education using Technology and Mobile DevicesIOSR Journals
 
MAT Technology Module Performance Task PowerPoint
MAT Technology Module Performance Task PowerPointMAT Technology Module Performance Task PowerPoint
MAT Technology Module Performance Task PowerPointgburkart3
 
Technology presentation
Technology presentationTechnology presentation
Technology presentationStephietelli
 
Technology in mathematics_and_science_instruct
Technology in mathematics_and_science_instructTechnology in mathematics_and_science_instruct
Technology in mathematics_and_science_instructsm-slaviero
 
Factoring PowerPoint
Factoring PowerPointFactoring PowerPoint
Factoring PowerPointmlonofrio
 
Stephanies powerpoint
Stephanies powerpointStephanies powerpoint
Stephanies powerpointguest098324d
 
Spinetti.david probability and statistics
Spinetti.david probability and statisticsSpinetti.david probability and statistics
Spinetti.david probability and statisticsDavid Spinetti
 
Mobile Math and Science
Mobile Math and ScienceMobile Math and Science
Mobile Math and Sciencesgrossusa
 
Technology in Mathematics and Science IDT285
Technology in Mathematics and Science IDT285Technology in Mathematics and Science IDT285
Technology in Mathematics and Science IDT285psych369
 
McKinley, Grace Percentages
McKinley, Grace PercentagesMcKinley, Grace Percentages
McKinley, Grace PercentagesGrace McKinley
 
What is the Relation between Statistics and Probability.pptx
What is the Relation between Statistics and Probability.pptxWhat is the Relation between Statistics and Probability.pptx
What is the Relation between Statistics and Probability.pptxSample Assignment
 
Spreadsheets in education
Spreadsheets in educationSpreadsheets in education
Spreadsheets in educationjessicaajanee
 
Dylan DeNuzzo- MAT tech PPT
Dylan DeNuzzo- MAT tech PPTDylan DeNuzzo- MAT tech PPT
Dylan DeNuzzo- MAT tech PPTDylan Ross
 
Integrating online-learning-into-elementary-classroom. (1)
Integrating online-learning-into-elementary-classroom. (1)Integrating online-learning-into-elementary-classroom. (1)
Integrating online-learning-into-elementary-classroom. (1)Sophita Senatham
 
Impact of social media in learning mathematics
Impact of social media in learning mathematicsImpact of social media in learning mathematics
Impact of social media in learning mathematicsDr. C.V. Suresh Babu
 
Ab research actual document
Ab research actual documentAb research actual document
Ab research actual documentShauna Sanders
 
2webquest Srkthomas Statistics
2webquest Srkthomas Statistics2webquest Srkthomas Statistics
2webquest Srkthomas Statisticssrthomas
 
Descriptive Statistics in the NCAA
Descriptive Statistics in the NCAADescriptive Statistics in the NCAA
Descriptive Statistics in the NCAAsrkthomas
 
Webquest Descriptive Statistics of the NCAA
Webquest Descriptive Statistics of the NCAAWebquest Descriptive Statistics of the NCAA
Webquest Descriptive Statistics of the NCAAsrthomas
 

Similar to Mattmiddaghscatterplotppt (20)

Grande, david math in sports
Grande, david math in sportsGrande, david math in sports
Grande, david math in sports
 
Advancing Statistical Education using Technology and Mobile Devices
Advancing Statistical Education using Technology and Mobile DevicesAdvancing Statistical Education using Technology and Mobile Devices
Advancing Statistical Education using Technology and Mobile Devices
 
MAT Technology Module Performance Task PowerPoint
MAT Technology Module Performance Task PowerPointMAT Technology Module Performance Task PowerPoint
MAT Technology Module Performance Task PowerPoint
 
Technology presentation
Technology presentationTechnology presentation
Technology presentation
 
Technology in mathematics_and_science_instruct
Technology in mathematics_and_science_instructTechnology in mathematics_and_science_instruct
Technology in mathematics_and_science_instruct
 
Factoring PowerPoint
Factoring PowerPointFactoring PowerPoint
Factoring PowerPoint
 
Stephanies powerpoint
Stephanies powerpointStephanies powerpoint
Stephanies powerpoint
 
Spinetti.david probability and statistics
Spinetti.david probability and statisticsSpinetti.david probability and statistics
Spinetti.david probability and statistics
 
Mobile Math and Science
Mobile Math and ScienceMobile Math and Science
Mobile Math and Science
 
Technology in Mathematics and Science IDT285
Technology in Mathematics and Science IDT285Technology in Mathematics and Science IDT285
Technology in Mathematics and Science IDT285
 
McKinley, Grace Percentages
McKinley, Grace PercentagesMcKinley, Grace Percentages
McKinley, Grace Percentages
 
What is the Relation between Statistics and Probability.pptx
What is the Relation between Statistics and Probability.pptxWhat is the Relation between Statistics and Probability.pptx
What is the Relation between Statistics and Probability.pptx
 
Spreadsheets in education
Spreadsheets in educationSpreadsheets in education
Spreadsheets in education
 
Dylan DeNuzzo- MAT tech PPT
Dylan DeNuzzo- MAT tech PPTDylan DeNuzzo- MAT tech PPT
Dylan DeNuzzo- MAT tech PPT
 
Integrating online-learning-into-elementary-classroom. (1)
Integrating online-learning-into-elementary-classroom. (1)Integrating online-learning-into-elementary-classroom. (1)
Integrating online-learning-into-elementary-classroom. (1)
 
Impact of social media in learning mathematics
Impact of social media in learning mathematicsImpact of social media in learning mathematics
Impact of social media in learning mathematics
 
Ab research actual document
Ab research actual documentAb research actual document
Ab research actual document
 
2webquest Srkthomas Statistics
2webquest Srkthomas Statistics2webquest Srkthomas Statistics
2webquest Srkthomas Statistics
 
Descriptive Statistics in the NCAA
Descriptive Statistics in the NCAADescriptive Statistics in the NCAA
Descriptive Statistics in the NCAA
 
Webquest Descriptive Statistics of the NCAA
Webquest Descriptive Statistics of the NCAAWebquest Descriptive Statistics of the NCAA
Webquest Descriptive Statistics of the NCAA
 

Mattmiddaghscatterplotppt

  • 1. Scatter Plots & Line of Best Fit By: Matt Middagh A topic intended for high school (9-12)
  • 2. Technology Integration Rationale (click title to view YouTube video) When teaching a lesson on scatter plots and line of best fit, technology is necessary to gain a large quantity of data from various sources, assist in plotting graphs and can help create the line of best fit. Using technology students can research up to date data and interesting statistics regarding meaningful topics to them. Technology is also a great way to reinforce previously learned skills through the endless games and projects offered.
  • 3. Internet Content • The Internet offers a wide array of content related to statistics. There are numerous resources for students of all ages from games to work on their skills to projects relating to real life current issues or topics of interest. The internet also offers numerous instructional videos for students to gain an extra edge amongst their classmates. There is endless data, constantly updating, which provide opportunities for students to do research to a topic of interest to them.
  • 6. YouTube Video (click to view video)
  • 7. Internet Resources The internet offers a wide variety of statistical data that students and teachers can use to pull data from to help assist in teaching a lesson on scatter plots and line of best fit. The following three slides gives three examples of government agencies which can offer material regarding this topic.
  • 8. (click to access website) The United States Census is a great source for data relative to the people living in the U.S. Students can use to data provided by the census to gather information of people from the entire country and try to find relationships between different statistics or different parts of the country.
  • 9. (click to access website) The National Center for Education Statistics is a great website which offers data relating to schools and education around the country. This is a great way for students to compare statistics which may hit them more at home, as they pertain directly to them and the education system that they are currently going through. This website offers information and statistics regarding real problems and situations that are going on in the school systems today.
  • 10. (click to access website) Monitoring the future is a website setup through the University of Michigan, and it contains information regarding the behaviors and attitudes of students in high schools and colleges. It also offers publications and survey projects. Students can use this source to find information and interpret whether there is a relationship between two behaviors or attitudes.
  • 11. Steps to Finding Line of Best Fit
  • 12. Teaching Materials (click to access worksheet) (click to access project) Above is a project and a worksheet from Yummymath.com. The first is one involving the popular board game Monopoly where students are required to check for a relationship between the amount of rent and spaces from go for a property. The other is a worksheet which has students practice plotting points and coming up with relationships and equations for the line of best fit
  • 13. Teaching Materials Cont. (click to access site) Above is a link to a sports reference page, where I plan to use for a project or performance task. It will involve students selecting data from their favorite sports, then comparing two statistics. They will find if there is any correlation between something like wins and losses, then they will have to do box-and- whisker plots for the data as well.
  • 14. Teaching Materials Cont. Onlinemathlearning.com offers a wide variety of statistics games for students to play to review the topics being discussed in class. It also offers worksheets that can be used for later lessons in statistics.
  • 15. Subject Specific Internet Source This website is a great resource for teaching any level of math. Teachers can find activities and lesson plans for just about any subject. Teachers can search by grade level or subject matter.
  • 16. Internet Uses Online Statistics Education is an online textbook developed in Rice University as well as University of Houston Clear Lake and Tufts University. It offers a textbook in statistics that students can access for free, as well as simulations to accompany each section.
  • 17. Internet Uses Cont. http://www.shodor.org/interactivate/activities/S catterPlot/ This is a interactive website where students can input data points on to a customized graph, generate a line of best fit, and even print out their graphs to turn in as assignments.
  • 18. WolframAlpha is an app available for iPhone, iPad, and Android. It is a great app for math reference. Students can type in any equation and get an explanation and solution for it. You can also look up vocabulary terms for examples and descriptions.
  • 19. Web 2.0 Evernote is where students can share notes with each other, as well as collaborate with others on projects and upload them for teacher access and comment on.
  • 20. Rubrics Rubistar makes it easy to create rubrics for projects where students are asked to do research and create their own scatter plots. I can use the rubric generator to assess them on things like neatness of the work, accuracy, their data tables and much more.

Editor's Notes

  1. The blog here offers examples of statistics used in real life examples and he is constantly updating it with current issues. Students can access this to learn more and gain a deeper understanding into the world of statistics as well as see real life applications for statistics. Image found by Google image search and is found at: http://artgoneglobal.com/2011/01/25/throw-a-blog-in-with-that/Blog was found through a Google search.
  2. Podcasts like the one here can be used to build upon ones knowledge of statistics. This one is an introduction course into the world of statistics, which can help reinforce the topics being taught in class.Image found on the website: https://itunes.apple.com/us/podcast/introduction-to-statistics/id355120108.The podcast was found by searching the iTunes store.
  3. YouTube offers numerous walkthroughs and lessons on statistics, here is a simple way of explaining scatter plots and finding the line of best fit. This can be used to further a student’s knowledge and understanding of statistics.The image was taken from youtube.com, and the video was found through a YouTube search.
  4. This is a reliable government agency. The image was obtained from the website census.gov.
  5. This website is affiliated with the U.S. Department of education.The image was found on their website: www.nces.ed.gov
  6. This website was set up and run through the University of Michigan, and the image was found on the website www.monitoringthefuture.org.
  7. This step by step process for finding line of best fit was created using Inspiration 9. It is useful because it gives the students a step by step process to follow when trying to find the line of best fit. It enhances their learning and understanding by the use of visuals throughout each step of the process.
  8. Both images were found through a Google search. They can also be found here: http://asdfhj.com/tag/free-monopoly-codes and
  9. Image found on the website www.sports-reference.com
  10. Source found in the “Resources” page of BlackBoard. Image was found at the website www.illuminations.nctm.org.
  11. Image found from a Google search and can be found at http://smartmobilestudio.com/documentation/get-the-book/
  12. Image found through Google image search and can also be found at: http://androidfren.blogspot.com/2012/12/download-wolfram-alpha-180-apk.html.
  13. Image found at www.evernote.com.
  14. This website was found through the list of rubric sites provided on Blackboard (Module 6, task 6).Image found at www.rubistar.4teachers.org.