SlideShare a Scribd company logo
1 of 154
TemplateP 10-04Name:Section:Enter the appropriate amount or
item in the shaded cells. Use the drop-down lists when
available.An asterisk (*) will appear next to an incorrect entry
in the outlined cells.Leave no cell blank. Ensure to enter "0"
wherever applicable. Round PV factors to three decimal
places.1.a.Net present value methodYearNet Cash Inflows012%
Factor=Present Value0000=00000=00000=00000=00000=0Total
present value0Less purchase price of machine0Net present
value0b.Accounting Rate of Return=000Average Annual Net
IncomeAverage Annual Cash inflows=000Average Investment
CostTotal Investment=0Residual Valuec.Payback period
methodTotal cash investment0Less cash flow
recovery:Year000000000Unrecovered investment0Payback
period is0years2.Net present value0Accounting rate of
return0Payback period0years
Enter as a negative value.
Round answer to one decimal place. Ignore "%" in your
response. Example "25.6"
Round answer to one decimal place.
Enter as a negative value.
Round answer to one decimal place. Ignore "%" in your
response. Example "25.6"
Round answer to one decimal place.
Enter all amounts as positive values in this column.
Enter as a negative value.
Solution
P 24-04_SolName:SOLUTIONSection:Enter the appropriate
amount or item in the shaded cells. Use the drop-down lists
when available.An asterisk (*) will appear next to an incorrect
entry in the outlined cells.Leave no cell blank. Ensure to enter
"0" wherever applicable. Round PV factors to three decimal
places.1.a.Net present value methodYearNet Cash Inflowsx12%
Factor=Present Value1$ 75,000x0.893=$
66,975270,000x0.797=55,790365,000x0.712=46,280460,000x0.
636=38,160425,000x0.636=15,900Total present value$
223,105Less purchase price of machine250,000Net present
value$ (26,895)b.Accounting Rate of Return=Average Annual
Net Income/Average Investment CostAverage Annual Net
IncomeAverage Annual Cash inflows=$ 11,250/$
137,500Average Investment CostTotal
Investment=8.2%Residual Valuec.Payback period methodTotal
cash investment$ 250,000Less cash flow recovery:Year1$
75,000270,000365,000440,000(250,000)Unrecovered
investment0Payback period is3.7years2.Net present value$
(26,895)Accounting rate of return8.2%Payback period3.7years
Round answer to one decimal place. Ignore "%" in your
response. Example "25.6"
Enter as a negative value.
Round answer to one decimal place.
Enter as a negative value.
Round answer to one decimal place. Ignore "%" in your
response. Example "25.6"
Round answer to one decimal place.
Enter all amounts as positive values in this column.
Enter as a negative value.
Schroeder, R. G., Goldstein, S. M., & Rungusanatham, M. J.
(2013). Operations management in the supply chain: Decisions
and cases (6th ed.). New York, NY: McGraw-Hill/Irwin.
If the products sell extremely well, we will
build more in season, and will be back on the
shelves in a few weeks. And we'll build even
more, and even more, and even more, in that
same season. We're not going to wait with a
hot new product until next year, when hope-
fully the same trend is alive.
-Ronald Snyder, CEO of Crocs, lnc. 1
On May 3, 2007, Crocs, Inc. released its results for the
first quarter of the year. The footwear company,
which had sold its first shoes in 2003, reported reve-
nues of $142 million for the quarter, more than three
times its sales for the first quarter of 2006. Net in-
come, at $0.61 per share was more than 17 percent
of sales, nearly four times higher than the previous
year. 2 These results far exceeded market expecta-
tions, which had been for earnings of $0.49 per share
on $114 million of revenue. 3 As part of the earnings
release, the company announced a two-for-one stock
split. Immediately after the announcement, the stock
price jumped 15 percent.
The growth and profitability of Crocs, which made
funky, brightly colored shoes using an extremely com-
fortable plastic material, had been astounding. Much
of this growth had been made possible by a highly
flexible supply chain which enabled the company to
build additional product to fulfill new orders quickly
within the selling season, allowing it to respond to un-
expectedly high demand-a capability that was previ-
ously unheard of in the footwear industry. This ability
to fulfill the needs of retailers also made the company
a very popular supplier to shoe sellers.
This success also raised questions about how
the company should grow in the future. Should it
vertically integrate or grow through product line
1 Quotations are from interviews w ith the authors, unless oth-
erwise specified.
2 Press Release, "Crocs, Inc. Reports Fiscal 2007 First Quarter
Financial Results," May 3, 2007. Online at http://www.crocs.
com/consumer/press_details/688244 (accessed May 4, 2007).
3 Rick Munarriz, "Ugly Shoes, Pretty Profits," The Motley
Fool,
May 4, 2007. Online at http://www.fool.com/investing/high-
g rowth/2007 /05/04/ug ly-shoes-pretty-profits.aspx (accessed
May 7, 2007).
extension? Should it grow organically or through ac-
quisition? Would potential growth paths exploit
Crocs' core competencies or defocus them?
CROCS, INC.
In 2002, three friends from Boulder, Colorado went
sailing in the Caribbean. One brought a pair of foam
clog shoes that he had bought from a company in
Canada. The clogs were made from a special mate-
rial that did not slip on wet boat decks, was easy
to wash, prevented odor, and was extremely com-
fortable. The three, Lyndon "Duke" Hanson, Scott
Seamans, and George Boedecker, decided to start a
business selling these Canadian shoes to sailing en-
thusiasts out of a leased warehouse in Florida, as
Hanson said, "so we could work when we went on
sailing trips there." 4 The founders wanted to name
the shoes something that captured the amphibious
nature ofthe product. Since "Alligator" ha.d already
been taken, they chose to name the shoes "Crocs."
The shoes were an immediate success, and word
of mouth expanded the customer base to a wide
range of people who spent much of their days stand-
ing, such as doctors and gardeners. In October 2003,
as the business began to grow, they contacted Ronald
Snyder, a college friend, to become a consultant for
the company. Snyder had been an executive with
Flextronics, a leading electronics contract manufac-
turer, heading up the company's design division. He
had extensive experience in manufacturing opera-
tions, mergers and acquisitions, and sales and mar-
keting. When he first started consulting with Crocs,
Snyder said, "I thought I would work a few hours a
day. I thought it would be restful." 5 But seeing the
rapid growth of the company based on word-of-
mouth marketing, Snyder joined Crocs in June 2004
as its president, becoming CEO in January 2005.
When Snyder joined the company it was head-
quartered in Colorado, but essentially distributing
shoes made by the Canadian manufacturer Finpro-
ject NA. One of Snyder's first moves was to purchase
4 Diane Anderson, "When Crocs Attack," Business 2.0,
November 1, 2006.
5 1 bid.
David Hoyt and Amanda Silverman prepared this case under the
supervision of Michae l Marks, Professors Chuck Holloway
and Hau Lee as the basis for class discussion rather than to
illustrate either effective or ineffective handling of an adminis-
trative situation.
Copyright© 2007 by the Board of Trustees of the Leland
Stanford Junior University. All rights reserved. No part of this
publication may be reproduced, stored in a retrieval system,
used in a spreadsheet, or transmitted in any form or by any
means-electronic, mechanical, photocopying, recording, or
otherwise-without the permission of the Stanford Graduate
School of Business. Reprinted with permission.
492
Crocs: Revolutionizing an Industry's Supply Chain Model for
Competitive Advantage 493
Finproject, which was renamed "Foam Designs ."
Crocs now owned the formula for the proprietary
resin "croslite™" that gave the shoes their unique
properties of extreme comfort and odor resistance.
The company now also controlled manufacturing.
EXHIBIT 1 Crocs executives and directors.
Snyder encouraged the company to think big. He
brought in a number of key executives from Flex-
tronics, and built infrastructure in preparation for
growth. (See Exhibit 1 for Crocs executives and direc-
tors.) He also launched the product worldwide.
Executive Background
Ronald Snyder, President, CEO, Director
Peter Case, SVP, Finance, CFO, Treasure
John McCarvel, SVP, Global Operations
Michael Margol is, VP, Sales and Marketing .
Director
Raymond Croghan
Ronald Frasch
Michael Marks
Marie Holman-Rao
Richard Sharp, Chairman
Thomas Smach
Ronald Snyder
With Cross since June 2004 (consultant since October
2003). Senior executive with Flextronics. Founder of
The Di i Group, w hich was acqu ired by Flextronics.
With Crocs since April 2006. Previously EVP, CFO, and
treasurer of publicity held sports apparel and
accessor ies company.
With Crocs since January 2005 (consultant beginning in
2004). Previously an executive w ith Flextronics and
The Dii Group.
With Crocs since January 2005. Led Crocs sales group
as a consultant beginning in October 2003. Previously,
founder and executive with an apparel and
merchandising compan y.
Background
Board member since August 2004. Prior to retirement
in 1999, ran a healthcare information technology
consulting firm. Also on the board of several privately-
held compan ies.
Board member since 2006. Vice Chairman of Saks Fifth
Avenue. Background in global retailing.
Board member since August 2004. Member of Kohlberg
Kravis Roberts & Co., a private equity firm, as a member
of the firm since January 1, 2006 . Chairman of
Flectronics. Previously, he was wi th Flextronics from
1991-2005, serving as CEO and chairman. Also a
director of SanDisk Corporation and Schlumberger Limited.
Board member since 2006. Background in the apparel
business, including Limited Brands, Inc., Gap, Inc.,
Banana Republic, and Ann Taylor.
Board cha irman since April 2005. With Circuit City from
1982 to 2002, serving as president, CEO, and chairman.
Also a board member of Flextron ics (formerly chair).
And of Carmax, Inc., the nation's largest specialty
retailer of used cars and light trucks.
Boa rd member since Apri l 2005. With Flextronics since
2000, as CFO, and SVP of finance. Previously SVP, CFO
and treasure of The Dii Group, Inc., which was acquired
by Flextronics. Also serves on the board of ADVA AG
Optical Networking.
President of Crocs. See background above under
Executives.
Sources: Crocs w ebsite, "Board and Management Profiles,"
http://www.crocs.com/ company/ ln
vestor_Relations/Board_Management.jsp
(April 23, 2007}, Crocs Proxy, October 2006.
494 Part Six Case Studies
Snyder explained the rationale behind launching
worldwide at an early point in the company's life:
The plan was, we're going to launch the world in
order to get a brand out that would be a sustain-
able brand with th is funky looking, strange
product. Other, larger shoe companies, or even
larger apparel companies, could have knocked us
off, and could have gone into Europe before we
got there if they had infrastructure in Europe.
So, being Flextronics guys, and understanding
that the world is flat, and you can get every-
where fairly quickly, we said, "we need to launch
the world pretty much at once." We delayed a
bit in South America, but now we're there fairly
strong, too. But we needed to launch every-
where in order to have us be the brand that had
sustainability. That's what we've been able to
pull off at this point. We were in every country
you can think of before anybody else had any
real capability to ship product in other countries
besides the U.S. Certainly, there are knock-offs in
all those other places, but they are just known as
knock-offs. They are not known as originals,
which is what we were hoping to achieve.
Crocs started its sales efforts on a grass-roots basis
in the U.S. The company participated in many trade
shows in every industry that could benefit from the
product, such as garden shows, boat shows, and pool
supply shows . As stores began carrying the shoes,
Crocs personnel worked closely with the stores. Snyder
observed, "If you just put up a rack of funny-looking
shoes, I don't think they would have done anything.
But we got in there with some of our own people, or
our reps, and stood around and got people excited."
Crocs also went to a wide range of events, such as con-
certs, festivals, and sports tournaments, to talk to cus-
tomers about the shoes. The company took a similar
approach in other countries, but the momentum gen-
erated in the U.S. helped foreign adoption.
The company initially used representatives and
distributors in the U.S., but brought this function in-
house in order to control costs. In other countries,
Crocs had its own sales staff wherever possible, but
as of mid-2007 had some 3rd party distributors in
some locations.
In addition to a popular product and a global
strategy, Crocs developed a supply chain that pro-
vided a competitive advantage. Traditional industry
practice was for retail distributors to place bulk or-
ders for each season's inventory many months in ad-
vance, with little ability to adjust to changes during
the selling season. The Crocs model did not impose
these limitations on retailers-the company could
fill new orders within the season, quickly manufac-
turing and shipping new product to retail stores.
The traditional practice, and the Crocs supply chain
will be described in detail below.
From 2003 through 2006 the company had
phenomenal growth. Revenue in 2003 had been
$1.2 million . By 2006, it was $355 million, with a net
income· of $64 million (18 percent of revemk). Crocs
went public in February 2006, with an initial market
capitalization of over $1 billion. After the Q1 2007
earnings release, the market cap passed $2.7 billion.
Sales outside of North America grew from 5 percent
of total revenue in 2005 to 25 percent in 2006. In its
Q1 2007 earnings release, the company said that it
expected 2007 revenue to be between $670 and
$680 million. (The company had historically reported
results that comfortably exceeded expectations. 6 )
(See Exhibits 2 and 3 for company financial informa-
tion .) Crocs' financial performance was far superior
in many respects to others in the footwear industry
(Exhibit 4).
The Crocs Shoe
The original Crocs shoe was a clog design. Visually,
its two most distinctive features were large ventila-
tion holes and bold colors. The key to the shoe, how-
ever, was the croslit~ material. This proprietary
closed-cell foam material molded to the shape of
the wearer's foot, providing an exceptionally com-
fortable shoe. It was extremely light, did not skid,
was odor resistant, and did not mark surfaces. It
could also be washed with water. Croslite could be
produced in any color, and the company chose bold
colors (described by some as "crayon" colors) which
further enhanced the distinctive, funky look. Crocs
shoes generally sold for about $30-which was not
marked down, as retailers found they did not need
to unload excess inventory through clearance sales
at the end of a selling season.
As Crocs grew, it added additional shoe designs.
The two original models, Beach and Cayman, ac-
counted for about 62 percent of footwear sales in
2006.7 These two models also formed the basis of
some of the other Crocs models. By April 2007, the
company had a wide range of shoes and other prod-
ucts . Its website showed 31 basic footwear models,
ranging from sandals to children's rain boots to
shoes designed for professionals, such as nurses,
who had to stand all day. Some of its shoes were
made under a license agreement with Disney, and
incorporated Disney characters. In addition, Crocs
offered four models of shoes (CrocsRX) that were
6 Munarriz, loc. cit.
7 Crocs Form 1 OK for 2006, pp. 15-16.
Crocs: Revolutionizing an Industry's Supply Chain Model for
Competitive Advantage 495
EXHIBIT 2 Crocs' financial performance through 2006.
All amounts in $ millions, except as noted.
2006 2005 2004 2003 2002
Revenue 354.7 108.6 13 .5 1.2 0.0
Cost of goods sold 154.2 47.8 7.2 0.9 0.0
Gross profit 200.6 60.8 6.4 0.3 0.0
Gross profit margin 56.5% 56.0% 47 0% 23.3% 33.3%
SG&A expense 97.2 30.6 7.2 1.4 0.5
Depreciation &
amortization 8 .1 3.3 0.7 0.1 0.0
Operating income 95.3 26.9 (1 6) (1 .2) (0.4)
Operating margin 26.9% 24.8%
Net income after taxes 64.4 17.0 (1 .5) (1.2) (0.4)
Net profit margin 18.2% 15.6%
Geographic distribution
of revenue(% of total)
North America 265.5 (75%) 102.8 (95%) 135 (100%)
Asia 54.4 (15%) 4.7 (4%)
Europe 30.3 (9%) 1.0 (1%)
All Other 4.6 (1%) 0.1
Shoes as percent of
total revenue 96% 94% 81%
Selected Balance Sheet Items
(Calendar year end, all values in $ millions)
2006 2005 2004 2003
Cash 71.2 37.8 6.9 0.5
Net receivables 69.3 20.0 3.3 0.2
Inventories 86.2 28.5 2.4 0.4
Net fixed assets 34.8 14.8 3.7 0.3
Accounts payable 71.2 37.8 6.9 0.5
Short-term debt 0.5 8.5 1.0
Long-term debt 0.1 3.2 1.4
Sources: Hoovers. Product and geographic distribution of
revenue from Crocs Form 1 OK for 2006, pp. F-27, 28.
EXHIBIT 3 Financial results, Q1 2007.
The following results were released May 3, 2007, for the
quarter ended March 31, 2007 (dollar values in
millions, except as otherwise stated):
Q1 2007 Q1 2006 % Change
Revenues 142.0 44.8 317%
Gross profit 84.4 23.7 356%
Gross profit(% of sales) 59.4% 52.9%
SG&A expenses 47.3 137 345%
Net income, after tax 24.9 6.4 389%
Net income(% of sales) 17.5% 14.3%
Net income per share, diluted $0.61 $0.17 359%
Source: Crocs Press Release, May 3, 2007, loc. cit.
496 Part Six Case Studies
EXHIBIT 4 Industry comparisons.
Comparisons of Crocs with companies selected as "best of
group" and industry median.
Deckers Industry
Median Crocs Outdoor Nike Timberland
Annual sales ($ million) 355 304 14,9 55 1,568
Market capita lization ($ million) 2,102 897 10,06 5 1,306
Profitability
Gross profit margin 56.5% 46.4%
Pre-tax profit margin 27.2% 17.8%
Net profit margi n 18.2% 10.4%
Return on equity 56.7% 16.1%
Return on assets 34.1% 13.7%
Return on invested capital 51.1% 15. 9%
Operations
Inve ntory turnover 3.5 5.0
Receivables turn over 8.0 6.0
Valuation
Price/Sales ratio 5.9 3.0
Price/Earnings ratio 30.4 28.3
Price/C ash fl ow ratio 170.3 18.5
Growth
12 month revenue growth 227% 15%
12 month net income growth 280% (1.0%)
12 month EPS growth 239% (2.3%)
43.7% .
13 .1%
8.7%
21.6%
14.4%
18.4%
4.3
6.5
1.3
20.0
14.1
8.8%
0.4%
2.9% <
47.3%
10.4%
6.8%
19.5 %
13 .0%
19.0 %
4.7
7.4
0.8
15.3
11.7
0.1%
(35.3%)
(3 1.5 %)
24.5%
3.2%
2.7 %
15.5 %
3.4%
4.7%
5.6
6.6
0.8
20.1
10.6
7.5%
53.2%
50 .0%
Source: Hoovers Online Competitive Landscape (April 27,
2007). Crocs growth numbers are for cale ndar years 2005 and
2006. Crocs in ventory turns
from Crocs.
designed to meet the special needs of those with
medical problems that affected the feet, such as dia-
betes. The company offered 17 models of collegiate
models that were made in school colors, with the
school logos . Universities such as USC, UCLA, Notre
Dame, Cal, and Ohio State participated in the pro-
gram. (By the start of the 2007/8 academic year,
Crocs expected to include many other institutions in
its catalog of university logo shoes.) Crocs sponsored
the AVO beach volleyball tour, and offered two
models with the AVP logo .8 (See Exhibit 5 for photos
of selected Crocs products.)
While shoes comprised 96 percent of company
revenues in 2006. 9 Crocs also branched out into
other accessory products, such as caps, shirts, shorts,
hats, socks, and backpacks. It had products such as
kneepads and kneelers that utilized croslite to pro-
vide functionality. It also sold decorative inserts that
could be put into the shoe ventilation holes, origi-
nally made by a family-owned company (Jibbitz)
that Crocs purchased in December 2006.
8 Product links from Crocs home page: http://www.crocs.com/
home .jsp (Accessed April 24, 2007) .
9 Crocs Form 10K for 2006, p. F-27 .
Crocs made other acquisitions in 2006 and earl y
2007 in the sports protection equipment and ap-
parel market, and in action footwear. These acquisi -
tions further broadened the company's product line,
and introduced products that incorporated conven-
tional materials such as leather. (See Exhibit 6 for a
list of Crocs acquisitions.)
Producing a Crocs Shoe
The ra w materials for the croslite in Crocs shoes are
relatively inexpensive chemicals purchased in pellet
form from suppliers such as Dow Chemical. These
chemicals are then combined in a process called
"compounding," in w hich they are converted into a
slurry, mixed, and then reformed into new pellets .
As part of the compounding process, color dyes are
added. The compounded pellets are then ready to
be molded into croslite products.
Croslite components for Crocs products are made
by injection molding. This requires an injection
molding machine, and molds for each style and size.
After the parts are molded, they must be assembled.
This might involve gluing croslite parts together, or
stitching, in the case of components made of leather,
canvas, or other materials which had been added to
Crocs : Revolutionizing an Industr y's Supply C hain Model for
Compe ti tive Advantage 497
- BIT 5 Selected Crocs products.
~ ~ ~
beach cayman disney beach
Beach was the company's most Beach and Cayman were the first
two Disney beach was a version of
po pular model. Beach and Cayman Crocs products, and formed
the basis the Beach model produced
ac counted for 62 percent of 2006 for some other shoe models.
under license from Disney.
shoe sales.
~ ~TM ~ 1-professional jibbitz
kneepads
Professional was intended for Jibbitz were used to customize
Crocs Crocs produced items such as
people such as nurses who spent shoes by filling the ventilation
kneepads that took advantage
all day working on their feet. holes in the shoes. of the
properties of croslite.
~
~ ti ~
crocs 1" wristband cloud block letter t-shirt
Crocs offered branded accessories Cloud was designed to meet
the Crocs offered a range of shirts
such as wristbands, caps, and socks. special needs of diabetic
patients. and shorts.
5ource: Crocs w ebsite (www. crocs.com, accessed Apr il 23,
2007). Images © Crocs, Inc. , reprinted w ith perm ission .
EXHI BIT 6 Crocs acquisitions, 2004-2006.
Acquisition, Date Acquired, Purshase Price2
Foam Des igns (fo rmerly Finproject NA)
June 2004
Fury (formerly 55 Hockey Products)
October 2006 1
EXO ltalia
October 2006 1
Jibb itz
December 2006
$13.5 mill ion
Ocean Minded, LLC
January 2007
Notes
$1 .75 mill ion plus potential earn -out
of up to $3.75 million.
1. The aggregate purchase price for Fury and EXO ltalia was
$9.6 million .
2. Purcha se prices include acquisition-related costs.
Description
Original man ufacturer of Crocs products and owner
of crosl ite intellectual property.
Manufacturer of hockey and lacrosse products.
Crocs developing protection gear based on croslite ,
w hich offers low w eight, ene rgy absorption,
and mi crob ial resistance.
Designer of ethylene vinyl acetate (EVA) products,
primarily for the f ootw ear industry.
Family ow ned company specializing in colorful
snap-on products designed as accessories for Crocs
footw ear.
Designer and manufacturer of high quality leather and
EVA ba sed sanda ls for the beach, adventure, and
action sports markets. Uses recycled and recyclable
material s w henever poss ible. Products target young
men and w omen w ho w ant high qua lity fashion
sandals w ith an emphasi s on style and comfort.
Source : Crocs Form 10K for the year ending December
31,2006, pp. F-11, F-1 2, F-30.
498 Part Six Case Studies
the Crocs product line in late 2006 and early 2007.
The finished products are then tagged and placed in
boxes containing 24 pairs of shoes for distribution to
retailers. Standard industry practice -was for each
pack of 24 to contain only one style and color. Crocs,
however, would custom configure 24-packs to meet
the needs of its smaller customers.
CROCS REVO LUTIONIZES THE FOOTWEAR
SU PPLY CHAIN
The footwear industry was oriented around two
seasons-spring and fall. The standard practice was
fo r footwear companies preparing for the upcoming
fall season to take their products to shows around
the world in January. Buyers would book orders for
fall delivery following these shows ("pre-books").
The fall orders that were received at the begin-
ning of the year would be planned for delivery in
August, September, October, and November. These
scheduled shipments would drive the production
plan . The manufacturers would add some excess to
the build, typ ically about 20 percent of the pre-
booked orders, to take advantage of potential ad-
ditional orders . A very aggressive compan y might
add 50 percent to the build, but all the product
would be manufactured before the season began .
Most shoes were produced in Asia (primarily China
and Vietnam), with some manufactu red in South
America.
This production and supply model had obvious
limitations. Retailers had to estimate what their cus-
tomers would want well in advance of the selling
season. If they underestimated, they w ould have
empty shelves and forego potential sales. If they
overestimated , they would be stuck w ith unsold
stock at the end of the season and be f orced to have
clearance sales in order to get rid of this excess stock
at discounted prices . Making this even more difficult
was the consideration that fashion was subject to
trends that were difficult to predict-history was of
only limited value, particula r ly w ith new product s
that incorporated novel design elements that might
either become wildly popular or fall flat.
The Cro cs Supply Chain
Crocs looked at the supply chain from a ve ry differ-
ent perspective than traditional shoe companies.
Coming f rom their electronics contract manufactur-
ing backgrounds, Snyde r and ot her key Crocs execu-
tives were accustomed to producing what the
customer needed, when it was needed, and respond-
ing rapidly to changes in demand. They decided to
develop a model focused on customer needs-when
a custome r needed more product, they would get it.
Snyder described the new model as follows, "If th e
products sell extremely well, we will build more in
season, and will be back on the shelves in a fe w
weeks. And we'll build even more, and even more,
and even more, in that same season . We're not go-
ing to w ait with a hot new product until next year,
when hopeful ly the same trend is alive."
· Under the Crocs model, retailers would not
need to take a big risk in January by placing large
orders for their fall season-they could place
smaller pre-booked orders, and order more whe n
they saw how w ell the products sold . Traditiona lly,
customers had to guess which pr oducts would be
hot, and could not get mo re of a product that was
in higher demand than they had guessed (and take
the risk of end-of-season sales to unload excess in -
ventory at reduced prices) . Crocs wanted customers
to be able to get more of a product during the sea-
son in order to take advantage of unexpectedly
high demand. To do that, Crocs would have to be
able to make the products during the season, and
ship them to customers quickly. One analyst re-
marked, "They've surprised everybody. Their re-
plenishment system is unheard-of in the retail
footwear space." 10
The positive• relationship that Crocs developed
with its retailers resulted in additional benefits. As
Crocs became important to big retailers, they ap-
proached Crocs to suggest increasing the Crocs pres-
ence . Snyder described one large retailer who said:
"Bring us new products, bring us apparel, accesso-
ries, T shirts, socks, hats, Jibbitz, and we'll give you a
whole area that will be dedicated to the current
Crocs offerings and any new stuff you come out
w ith." Snyde r observed, "Once you have retail space,
it's pretty valuable."
Developi ng the Crocs Supply Chain
Phase One: Taking over Production As mentioned
earlier, one of Snyder's first moves was buying the
manufacturer of Crocs shoes (Foam Designs) in
June 2004 so that it could own the propr ietary
croslite resin and control manufactu r ing. At that
point, Crocs purchased the raw material pellets
from a variety of companies in Europe and the
United States, and shipped them to a third-party
compounding company in Italy. The Italian com-
pany had been the parent of Foam Designs, and
had previously done the compounding, so continu-
ing to use them for this function avoided supply
chain interruptions.
10 Jim Duffy of Thomas W eisel Partners, quoted in Anderson,
loc. cit.
Crocs: Revo lutionizing an Industry's Supply Chain Model for
Competitive Advantage 499
-e co mpounded, colorized pellets were then
back to Foam Designs in Canada, where shoes
_ =mo lded and assembled. The finished products
= : h en shipped to a third-party distribution
--::>any in Denver that warehoused the shoes, and
- -~ged and shipped them to customers.
-;.:e Tw o: Global Production Using Contract
.:- 'acturers Crocs started production in China in
2005, using a large contract manufacturer. The
materials were still being sent to Italy for com-
=- di ng, but the compounded pellets were now
=-=~a both Canada and China. The shoes that were
.::::e in China were shipped to the Denver ware-
=~e f or packaging orders and distribution .
o cs began to enter the Asian and European
-=r ets in the spring of 2005. As described earlier,
'€ co mpany's strategy was to launch worldwide, so
- ::rou ght on manufacturing capacity to support this
=:::> oach. It added capacity through contract manu -
:~urers in Florida, Mexico, and Italy (due to the lo-
...::. presence of the compounding company).
oming from the contract manufacturing business,
::-. d er and his team expected that the benefits of
=-- r act manufacturing they had experienced in the
· ronics industry would also be present in this new
= iness . Electronics contract manufacturers in all
--rts of the world were highly responsive to customer
:::=mands, and quick to increase or stop production as
_ ui red. They soon found that this was not the case
· f ootwear manufacturing. Snyder explained:
W e realized very quickly that third party [manu-
f acturers] with our new model weren't going to
w ork [outside of Asia]. Third parties in Asia are
absolutely great. They are very flexible. They can
b e both flexible and high volume . They move
very quickly. They [contract manufacturers] take
ri sks with us, where they buy equipment. They
invest in helping us grow the business. No [third
party manufacturers in] other countries were
w illing to even entertain that. We'd have to give
t hem long term forecasts, long term contracts,
w e'd have to sign away the next few kids . Noth-
ing was good about using contractors in any
other part of the world, to be honest ....
[Third party manufacturers outside of Asia]
w ould want to know what we're shipping four
months from now, not next week. We were tell-
ing them, "no, we actually need you to change
to morrow, and start shipping different stuff
next week, if that's what's required, since that's
o ur model." [And they said,] "Oh no, no, we
can't do that!"
Phase Three: Bringing the Global Supply Chain In-House
When Snyder realized that contractor manufacturers
outside of Asia would not be able to adopt the com-
pany's supply chain model, he developed company-
owned manufacturing operations in Mexico, and
Italy. Crocs set up a manufacturing operation in Brazil
that was scheduled to open by the end of June 2007.
It w as also exploring potential manufacturing sites
in India, and expected to start production there by
the end of the year.
Crocs had used a contract manufacturer in Romania
to serve European customers, and considered sev-
eral options to replace the contractor, including:
buying the contractor, setting up a new facility in
Romania, or looking elsewhere. They were ap-
proached by a company in Bosnia that made shoes
for Nike, and seemed to understand the Crocs
model. The two companies agreed to an arrange-
ment whereby Crocs owned the molding equipment
and molds, using the contract company's personnel
for labor. If this approach did not meet Crocs' re-
quirements for flexibility and rapid response to de-
mand, it would move to an entirely company-owned
manufacturing facility.
The Chinese contract manufacturer, who could
meet Crocs' needs for flexibility and responsiveness,
was maintained. (In 2006, 55 percent of Crocs' unit
volume was produced in China 11 ) Crocs also kept the
Florida contract manufacturer, who was only making
one high volume product, and could ship with a
Made in USA label, and continued to manufacture in
Canada.
While manufacturing in each geographic region
added both capacity and the ability to respond to
local customers, having the compounding done in
Italy led to supply chain inefficiencies. Compounded
material had to be sent from Italy to each produc-
tion site, in the correct amounts and colors. This re-
sulted not only in inefficient shipping of materials
around the world, but also reduced manufacturing
fle xibility in each location, since they could only pro-
cess the colors that they had in stock. The raw mate-
rials were inexpensive, so centralizing compounding
did not result in significant savings through inven-
tory consolidation .
In 2006, Crocs took control of the compounding
activity, creating state-of-the-art compounding fa-
cilities in Canada, China, and Mexico. Crocs could
now ship raw materials to each of these plants . The
plants could compound material as need for
production, delaying the colorizing decision until a
11 Crees Form 1 OK for 2006, p. 8.
500 Part Six Case Studies
specific color product was needed. Snyder described
the results:
We can get an order now, and we don't even
have to make the compound and colorize it yet,
and we can ship it in two weeks. So now the
model is starting to really take shape, where we
don't have to take risks on even color compound
at this point. Now we have that in place, which
makes a huge difference.
Moving compounding in-house also provided IP pro-
tection for the croslite compound.
Crocs also changed its warehousing model. The
company had used a contract warehousing and dis-
tribution firm in Colorado to handle all its ship-
ments. All production came to the contractor's
Colorado warehouse in bulk, where every shoe was
removed and labeled, then warehoused. Customer
orders were then filled from this central warehouse.
This arrangement was inefficient, since bulk orders
from large customers could have been shipped
directly from the factory to the customers if ware-
housing and distribution had been located near
each factory.
To address these problems, the company added
warehousing operations to each factory, including
labeling and other value added activities such as in-
stalling hand tags and putting products into bags or
boxes. For customers that ordered large quantities,
such as Nordstrom, Dillard's, or Dick's Sporting
Goods, the orders could be shipped directly from the
Chinese warehouse. The Chinese warehouse was
owned by one of the Crocs suppliers, but run by
Crocs' personnel and Crocs' systems. Other w are-
houses were owned by Crocs, or being transitioned
to Crocs ownership (as in the case of Japan). The in-
tent was for Crocs to control order fulfillment activi-
ties in Asia.
Crocs had a similar experience with warehousing
contractors as it had with contract manufacturers.
The company had tried using a number of third
party warehousers, in the U.S. and elsewhere. Crocs
found that these companies did a good job for a
short time, but soon lost interest . As Snyder noted,
"We don't lose interest in our own stuff," leading to
the decision to have the company take control of
warehousing.
Additional Considerations and Benefits of the Crocs
Supply Chain Model
Small vs. Large Retail Customers Crocs' early sales
were to small retailers. These stores were willing to
take more risk than the large chains, and work with
a new, rapidly growing supplier-particularly one
that provided a high level of support and rapi d sr ;-
ment of product. Small stores were willing to we~
with Crocs through problems such as stockouts a-:.
shipment delays-large retailers generally im pose:.
financial penalties for such problems. Crocs sa w.:.-=
small retailers as important to building the bra -:.
and providing a brand presence, even after th e r=-
jority of sales went to large retailers .
After Crocs' initial success in small stores, large ~=-
tailers approached the company. Since the lar;;:=
retailers had seen the market acceptance of ~=
Crocs shoes, Crocs was in a much stronger neg otic--
ing position than it would have been earlier in -'""'
development-it could negotiate favorable te r.-.-
which did not include the financial penalties
would previously have been required. By mid-2
about 75 percent of revenue came from large reta -
ers, split approximately evenly between shoe st ore
department stores, and sporting goods stores . 'f-.:;
rest of the revenue came from a large number ::-
small shops representing many different seg me-c~
such as gift shops, bicycle retailers, specialty fo od-=-
tailers, health and beauty stores, surf shops, and ... -
osks. These small shops ad :ounted for a much l a r~~
percentage of orders (although at much lower do1 :.-
levels) than the large retailers, requiring a differe-
approach to distribution.
To meet the needs of small customers, prod~=-
would be shipped to the company-owned w a ·=.-
house in Colorado, where the orders were con~;;:-
ured and shipped. Snyder explained the comp a
approach to fulfilling orders for these custom ers-
follows :
We had to be able to service that customer baSE
[small retailers], because it was a pretty big
chunk of our business. Those guys could neve r
take stuff direct from the factory. So, we fe lt ".E
st ill needed to ha ve a warehouse for quick shi
ments for the big guys and refills for the sm all
independents that don't have the warehous in"'
capabilities that the larger guys would have . A::.
almost none of them have distribution cente rs
of course-we ship direct to their shops. So, WE
still need the Denver operation which ships
about half of our product now.
While these stores might send orders to Crocs-
fax for small quantities to be delivered direct ly:::
their stores, the large retailers had an entirely di
ent fulfillment model. These companies had trE
own distribution centers, and sent orders electro~-
cally. Their orders were packed and shipped frc-::
the Crocs factories to the customers' distrib utT::-
Crocs: Revolutionizing an Industry's Supply Chain Model for
Competitive Advantage 501
=--:er. The customer would then ship it to the ap-
- ri ate retail store .
: == ing with Explosive Gro wth The Cr ocs suppl y
::.·n w as able to support the company's explos ive
~ _ ·lth, enabling the company to ride t he w ave of
__ o mer enthusiasm for its products. For instance,
er described a new flip-flop sandal that w as
-~ d uced in 2006 . This w as Crocs ' first product in
- .s segment, and the company did not know how
::. y w ould be purchased. Since it w as unique and
=-:: emely comfortable, they decided to make
:.= ,000 pairs-far more than they had pre-booked
: ers for, and perhaps as many as any model selling
at category in the world.
:a rly in the selling season, there were ind ications
-- ::. t he new flip-flop w as going to be even more
:: ou lar than they expected, so Crocs made sure that
-~ad excess injection molding machine capacity and
- Id s available . It continued to get orders, and
::~ il d more product to meet the new orders . By the
:=c-d of the season in September, they had shipped
-ear ly 2.5 million pairs-more than 10 times what
--ey w ould have shipped if they had operated under
- -e tr adi t ional model of making all of a season's
_ d uct ion prio r to the season based on pre-booked
:· ers.
he primary requirements for adding capacity
er e having enough injection molding machines,
::. d having enough molds for the desired product.
-·ocs purchased molding machines from t w o pri-
~a ry suppliers, who could init (ally de liver new ma -
- ines in about three months . However, as the
:~ppl iers observed Crocs' rap id growth, they man-
::.;ed to have new machines available soone r-by
ori l 2007, the company could generally get them
· hin si x weeks . Molds generally started to arrive in
ut si x weeks, but it would be about th ree months
:;efore Crocs would have a full set of all sizes .
Cro cs would move equipment from one location
an other to bette r meet its production needs.
ol d ing machines were not t ransferred often , but
en they we r e, the company tried to have ma -
- in es from just one vendor at each site. Molds,
- w ever, were frequently transferred betw een pro-
:. ct io n locations. If they needed fast response to
- eet a growing demand in the U.S., they might
-ove p roduction to Mexico, which was closer to
: e cust omers Y Fo r products with lots of pre-
oo ked orders, a relatively dependable forecast,
= I a sty le failed in the mar ketp lace (which had not yet
-appene d as of April 2007), molds co uld be rew orked to
-a e d iffe rent styles.
and high volume, production might be shifted to
China.
As part of a licensing agreement with Disney,
Crocs introduced a shoe with a Mickey Mouse head
replacing a Crocs hole . The product was very popu-
lar, and the company decided it needed production
flexibility, so it moved molds to Mexico to meet U.S.
demand. However, product destined for Asian cus-
t omers was made in China, and product going to
European customers was made in Europe .
In order to be able to respond immediately to in-
creases in demand, Crocs kept total manufacturing
capacity at about 1 million pairs per month beyond
the actual production plan . This capacity could be
turned on at a moment's notice. The company also
planned its infrastructure (both systems and people)
slightly ahead of demand, so that it could respond
quick ly. In marketing, it spent according to what it
could afford-when sales went up, it increased mar-
keting spending. Consequently, it had ad campaigns
ready to go within a week if the business took off
enough to support added spend ing .
Shifting Production to Reduce Duty Payments The
footwear industry was subject to considerable du-
ties. For instance, the U.S. imposed duties on all of
Crocs shoes coming from China, with tariffs ranging
from 3 to 37 .5 percent depending on the materials in
the shoe. Shoes that were entirely molded had a low
tariff, while those which used leather or other mate-
rials would have a high tariff. 13 On the other hand,
under the North American Free Trade Agreement,
Crocs paid no duty for products made in Mexico and
shipped to the U.S. There were trade agreements
between many countr ies that allowed duty-free
shipments-for instance, there was no duty on Mex-
ican shoes sold in Europe.
The duty situation was considered from the early
stages of new product development. The operations
people would tell the designers what duty costs
w ould be incurred based on the materials in the new
product . They would also look at the processes
needed to make the new product. This would be in-
cluded in the product strategy. If a Ch inese-produced
product had a high tariff, they would consider
13 The tariff classification w as extremel y difficult to
determine.
Crees submitted model s to the customs, authorities for a ruling
.
If they bel ieved that a product w as put into a category w ith
too
high a ta riff, t hey w ould appeal. To get a sense of the compli-
cate d nature of the tariff classifications, see: United States In-
ternational Trade Commission, " Harm oni zed Ta ri ff Schedule
of
th e United States (2007)(Rev. 1) Section XII, Chapter 64,"
http://hotdocs.us it c. gov/docs/tata/hts/bychapter/0701 c64.pdf
(M ay 7, 2007).
502 Part Six Case Studies
production in a low-tariff location. However, if the
product required production processes that were
not yet available in the low-tariff country, those pro-
cesses might be developed as part of the new prod-
uct plan. Crocs might also make a high-tariff shoe in
China at the start, with a plan to reduce costs later
by moving the production.
The Canadian manufacturing operation was re-
tained in part because of duty considerations. For
instance, Canada and Israel had a duty-free relation-
ship. Crocs shoes were extremely popular in Israel,
having sold 1.2 million pairs in the country in 2006 .
(The Canadian operation was also very helpful in
selling within Canada, as the Made in Canada label
provided an important marketing advantage .)
New, More Complicated Products In 2007, Crocs was
expanding its product lines beyond croslite molded
shoes. In part due to its February 2007 acquisition of
Ocean Minded, it was starting to make shoes with
uppers made of leather and other conventional
footwear materials, with croslite used for the shoe
soles. This introduced additional complication into
the production process. Leather and other materials
were also more expensive than croslite.
Even with a more complicated production pro-
cess, Crocs intended to apply the same fast-response
model it had brought from Flextronics and had opti-
mized for molded shoes. Snyder commented:
Now, it does become more complex-people could
throw darts at this thing by saying "but they only
make injection molded shoes, so they have an ad-
vantage over other shoe manufacturers out there."
Yes, we certainly did. But now we've got the same
model going for more standard shoes, where it
might have a croslite bottom, and it would have
more standard uppers-it might have canvas,
leather, suede, whatever. But we still are using the
same model, where if something is popular, hot in
the season, we are going to be able to make more.
It may not be as much in the first year, as the extra
2 million we did of the sandal, but even the sandal
was a difficult process. It wasn't just molding. It
had gluing and everything involved.
But the model is still there. We are not going to
say "no" to a demand of a very popular new prod-
uct. That's going to be our model going forw ard,
and we still have a lot of room to get better in our
flexible manufacturing sites. We are continuing to
do things in Mexico and Canada and in Europe to
make those even more flexible to be able to get
stuff to the market faster than the 2, 4, 6 weeks,
whatever it would take now depending on theca-
pacity or the demand at a given factory.
Introducing New Products In its first few yea rs
sales, Crocs observed that all products sold eq ua
well in each market around the world. This provide-~
an attractive opportunity. A new shoe model co u1::
be tested in the spring/summer season in the soif'J"~
ern hemisphere, and the results could be used to i:--
dicate how it might be accepted in the U.S . ar:::
Europe. If the product was a huge hit, productio~
could be planned accordingly for the northern herr:
sphere launch. On the other hand, if the pro du
sold slowly, those not bought in the southern herr.·
sphere could be sold in the northern hemisphe re
its spring/summer season.
Snyder elaborated:
Now we're in a situation where we can bring o~ .•
new products that might have more complexity
in the supply chain-more leather and more
other types of materials, grommets, sewing ma-
chines, whatever is required . We can now la un
those into half of the countries, still be agg res-
sive with our build, still build much more tha n
the pre-books, thinking that a given product is
going to be hot. Suppose we launch a produ ct ir
North America first. We've got other seasons
coming along in other parts of the world, an d
we've got another 10-15,000 stores we can
launch this particular new product into very
quickly. So, we don't take a huge risk by do ing
that. We don't take a huge risk by ordering extrc:
raw materials, and even building up extra sh oe
stock as we launch a new product. If it sells o ut
in the U.S., we build more, and if all that sells
out in the US, that's OK-we'll launch in Europe
or Asia the next year.
Supply Chain Planning As of mid-2007, Crocs was us-
ing a home-grown database system for plan nin"'
that had evolved over time. However, it was in t he
process of bringing up a commercial enterpris e re-
source planning system. They had launched th e in-
ventory module, which allowed them a global vie
of inventory, and provided information for the plar·-
n ing system. The new planning system was be in
brought online.
Crocs had planning people in the U.S., Asia , an
Europe. Each country had to generate its own re-
quirements plan, but there was also a global plan-
ning activity for each model type. The glo ba
planning personnel worked with the local staff o
the requirements for each market.
Product planning w as based on pre-books to~
each model, as well as information on what reta ile
w ere picking up the model. Crocs analyzed the ex-
pected sales of each model, but built the act ua
Crocs : Revolutionizing an Industr y's Supply C hain Model for
Competitive Advantage 503
product after it could see the demand hit to avoid
ending up with unsold inventory.
While Crocs did not build inventory in excess of
expected orders, the company did acquire excess ca-
pacity (sometimes as much as 2 to 3 times the ex-
pected capacity) in the form of molds and molding
machines so that it could quickly ramp capacity in
case a product took off.
MOVING INTO THE FUTURE
Crocs had been enormously successful from its first
sales in 2003 through the first quarter of 2007 . It had
developed a supply chain that was revolutionary in
the industry, and had been a critical factor in this suc-
cess. It had products that were very popular in the
marketplace. It had positive relationships with its re-
tail customers. How could it best build on its success?
Discussion Questions
1. What are Croc's core competencies?
2. How do they exploit these competencies in the
future? Consider the following alternatives:
a. Further vertical integration into materials
b. Growth by acquisition
c. Growth by product extension
3. To what degree do the alternatives in question 2
fit the company's co re competencies, and to what
degree do they defocus the company away from
its core competencies?
4. How should Crocs plan its production and inven-
tory? How do the company's gross margins affect
this decision?
134
Lean Thinking and
Lean Systems
Chapter outline
7.1 Evolution of lean
7.2 Lean tenets
7.3 Stabilizing the master schedule
7.4 Controlling flow with the kanban system
7.5 Reducing setup time and lot sizes
7.6 Changing layout and maintaining equipment
7.7 Cross-training, rewarding, and engaging workers
7.8 Guaranteeing quality
7.9 Changing relationships with suppliers
7.10 Implementation of lean
7.11 Key points and terms
Jefferson Pilot Financial, a full-service life insurance firm,
learned what so many
other firms had learned before it: using the concepts of lean
thinking and lean sys-
tems for processing life insurance applications improved
performance. Jefferson's
goals for its application processing process were twofold. First,
it wanted to re-
duce throughput time, from receiving an application to issuing a
policy, which
was averaging between one to two months. Second, it wanted to
reduce its 10 per-
cent error rate because each error meant that rework and
reprocessing were
needed. Using the basic lean tenets presented in this chapter,
Jefferson was able to
achieve a 70 percent reduction in throughput time and a 40
percent reduction in
errors. 1
Lean thinking and lean systems have been applied in a wide
variety of indus-
tries and settings. They are used to improve operations
processes in manufactur-
ing and services. Lean ideas are also used to improve processes
outside of
operations, including software application development and
maintenance, annual
budgeting, and even for collecting on delinquent accounts!
What is lean and how
do firms use lean ideas to improve their business?
1 Swan k (2003)
Chapter 7 Lean Thinking and Lean Systems 135
In this chapter we introduce the lean concepts, principles, and
techniques that a
host of organizations have adopted for performance
improvement. These concepts,
principles, and techniques can be deployed to reform not only
manufacturing sys-
tems but also administrative systems, service systems, and
entire supply chains. We
begin by looking at the evolution of lean before presenting lean
thinking as a set of
five tenets. We then characterize the lean system-particularly
the lean production
system-that is created when companies pursue lean. We
conclude by highlighting
implementation issues to consider when a company is deploying
lean.
7.1 EVOLUTION OF LEAN
"Tri-State:
~onverting to
JIT," Vol. V
After World War II the U.S. system of mass production was the
envy of the world.
Mass production-the production of standardized discrete
products in high vol-
ume by means of repetitive manufacturing technologies-was the
norm. Materi-
als were produced in large batches, and machines were made to
run faster to
reduce costs. In some cases this resulted in sacrificing quality
in the name of effi-
ciency and creating narrow jobs that led to worker
dissatisfaction, but still the
world bought products manufactured in the United States.
In the 1960s a Japanese miracle started at the Toyota
manufacturing company.
After visiting U.S. manufacturing companies, Toyota
determined that it could not
copy their system of mass production. Not only was demand for
Toyota automo-
biles low at that time, there was a severe lack of resources.
Because of the lack of
resources, Toyota developed a strong aversion to waste. Scrap
and rework were
deemed wasteful, and so was inventory that tied up storage
space and valuable
resources. Toyota realized that it needed to produce automobiles
in much smaller
batches, with much lower inventory, using simple but high-
quality processes and
involving workers as much as possible. This realization became
the foundation for
what is known today as the Toyota Production System (TPS)
and Just-In-Time
(JIT) manufacturing. This production system is now known and
used around
the world. See the Operations Leader Box titled "TPS at the
Toyota Plant in
Georgetown, Kentucky, USA."
JIT manufacturing came to the United States in 1981 at the
Kawasaki motorcy-
cle plant in Nebraska, which used some of the TPS ideas.
However, instead of
transforming the entire system, JIT manufacturing focused
primarily on inventory
reduction but ignored other aspects of Toyota's complete
system. As a result, many
U.S. companies that attempted to copy and implement the
Toyota Production Sys-
tem achieved only partial improvement.
In 1990 Womack, Jones, and Roos studied JIT automobile
manufacturing in
Japan, the United States, and Europe and popularized the term
lean production
in their famous book The Machine That Changed the World:
The Story of Lean
Production. 2 Lean production was defined as systematically
eliminating waste
in all production processes by providing exactly what the
customer needs and
no more. They reported that the best plants using lean
production had a big
edge in automobile assembly performance anywhere in the
world. Labor pro-
ductivity in the best plants exceeded that in the worst plants in
all three regions
by a factor of 2 to 1, defects were reduced by half, and
inventory was reduced
2 The phrase "lean production" was coined in the late 1980s by
John Krafcik, who was worki ng w ith
Jam es P. Womack and colleagues on the International Motor
Vehicle Program at the Massachusetts
Institute of Techn ology (http://www.a utofieldgu
ide.com/articles/01 0502.html ).
136 Part Two Process Design
Operations Leader TPS at the Toyota Plant in Georgetown,
Kentucky, USA
®
TOYOTA
Toyota Motor Manufacturing
Kentucky, Inc. (TMMK), is
Toyota's flagship manufactur-
ing facility in the United States,
currently producing 500,000 ve-
hicles annually. Established in
1986, TMMK occupies 1300 acres in Georgetown,
Kentucky, is over 7.5 million square feet in size, and
employs approximately 7000 employees to build the
Camry, the Avalon, and the Venza.
At TMMK, employees have been trained not only
in required job skills but also in problem-solving and
continuous improvement methods. Job tasks have
been standardized to minimize waste and assure qual-
ity. Employees can stop and are strongly encouraged
to stop the production line when a quality problem is
detected. Employees are, moreover, actively involved
in suggesting ways to improve their work and work
environments, with an astounding 100,000 sugges-
tions on average per year.
Toyota has done more than transfer the Toyota Pro-
duction System to TMMK. Realizing that the perfor-
mance of TMMK depends on its suppliers, it has worked
aggressively to help its 350 U.S.-based suppliers to imple-
ment the Toyota Production System. TMMK created the
Toyota Supplier Support Center in Erlanger, Kentucky,
to provide consulting services to suppliers. Suppliers, in
fact, deliver to TMMK frequently, allowing TMMK to
hold inside its facility, on average, enough inventory to
last for just four hqurs of production.
Source: http://www.toyotageorgetown.com/; A. Harris,
"Automotive Special Report-Made in the USA-Uprooting
the Toyota Production System and Transplanting It to
Kentucky in the United States Has Proved to be a Great
Success for Toyota," Manufacturing Engineer 86, no. 1
(2007), pp. 14-19.
from two weeks, worth to only enough to maintain production
for two hours.
The best U.S.-owned plants, indeed, had labor productivity
(vehicle assembly
hours) and quality comparable to the best Japanese -owned
plants in the United
States, while European plants lagged behind. This showed that
the best U.S.
plants could adopt the TPS and compete with Japanese plants,
but average U.S.
Lean thinking is applied in a wide variety of industries,
including hospital emergency rooms to speed patient
treatment.
plants were still far behind, particularly behind
plants located in Japan.
Today, the concepts, principles, and techniques
underlying lean production are often referred to as
lean thinking and are being deployed across a
broad spectrum of global firms. In the United
States, 3M, Bendix, Black & Decker, Briggs &
Stratton, Deere & Company, Delta Airlines, Eaton,
Ford, General Electric, Hewlett-Packard, Honeywell,
IBM, United Health Care, Wells Fargo, and Wipro
are just a few examples of well-known firms
pursuing lean thinking. In virtually all instances,
benefits such as increased inventory turnover (50
to 100 times per year), superior quality, and sub-
stantial costs savings (15 to 20 percent) have been
reported.
Chapter 7 Lean Thinking and Lean Systems 137
7.2 LEAN TENETS
Lean thinking, as the name signals, is a way of thinking about
processes at work
(and even processes at home). This way of thinking is built
around five tenets that
subsume specific concepts, principles, and techniques. The five
tenets aim to
deliver value to customers efficiently.
The first tenet in lean thinking is to specify precisely what
about a product or service
creates value from the customer's perspective. Recall from
Chapter 1 that value is
defined by the customer and provided in the p roduct or service
the customer needs
at a place, time, and price the customer is willing to pay. Value
is not what the firm
says but what the customer says. Value is often a solution to a
problem a customer is
facing that the customer is willing to pay for. Value, as such, is
dynamic in nature
and changes over time. Firms should design and deliver product
and service
features that customers value and stop doing activities that are
not valued by cus-
tomers (unless required for other reasons, for example, legal).
This may mean re-
moving unvalued product features or eliminating waiting times
in service systems.
Waste, in lean thinking, is anything that does not contribute
value to the product
or service being produced and delivered to the customer; rather
than adding value,
waste adds costs . The Japanese term for waste is muda. In
many manufacturing,
administrative, and service processes only 5 to 10 percent of
total throughput time
adds value for the customer. Firms want to eliminate obvious
waste, but many
forms of waste are hidden. For example, the v alue-added time
to produce a product
may be only three hours, but it takes a week to complete it. The
muda or non-value-
adding time might include waiting for machines or labor to
become available, deal-
ing with backlogs, searching for materials, or correcting
processing errors.
Table 7.1 defines the seven forms of waste originally identified
by Taiichi Ohno,
Toyota's former chief engineer, who is considered the father of
the Toyota Produc-
tion System. Womack and Jones in their book on lean thinking
introduced an
eighth form of waste: underutilization of workers. This stems
from not recognizing,
developing, and utilizing the mental, creative, and physical
abilities of employees.
Contributing to this waste are factors such as poor hiring and
training practices,
high employee turnover, and an organization culture that does
not respect people.
The second teriet in lean thinking is to identify, study, and
improve the value stream
of the process for each product or service. The value stream
identifies all the processing
steps and tasks undertaken to complete a product or deliver a
service from
• Overproduction: Producing more than the demand of
customers, resulting in unnecessary inven-
tory, handling, paperwork, and warehouse space.
• Waiting time: Operators and machines waiting for parts or
work to arrive from supp li ers or other
operations; customers waiting in line.
• Unnecessary transportation: Double or triple movement of
materials due to poor layouts, lack of
coordination, and poor workplace organization.
• Excess processing: Poor design or inadequate maintenance of
processes, req uiring additional
labor or machine time. ·
• Too much inventory: Excess inventory due to larg e lot sizes,
obsolete items, poor forecasts, or
improper production planning.
• Unnecessary motion: Wasted movements of people or extra
walking to get materials.
• Defects: Use of material, labor, and capacity for production of
defects, sorting out bad parts, or
warranty costs with customers.
138 Part Two Process Design
FIGURE 7.1 Health care value stream map.
Source: Adapted from Sylvia Bush ell, Joyce Mobley, and
Becky Shelest, "Discovering Lean Thinking at Progressive H
ealth Care," Journal of Quality &
Participation 25, no. 2 (Summer 2002), pp. 161- 191.
Xo
Patient In
15 minutes
Wait
40 minutes
Check-in
Doctor Visit
Information Flow ·
Xo
Patient Out
20 minutes 45 minutes 120 minutes Wait Time
Visit Prep Visit Doctor
11 minutes 40 minutes Processing
Time
Pharmacy, 1160 minutes u Total
Blood Test Throughp u t
 Time
beginning to end. A typical value stream thus can include both
value-added and
non-value -added processing steps and tasks. The goal in
studying the value
stream is to eliminate the non-value-adding processing steps
and tasks.
One technique supporting this tenet is value stream mapping,
which creates a
visual representation of the value stream of a process, much like
process flowcharting
(discussed in Chapter 6). Value stream mapping requires direct
observation of work
and the flow of work within a process so that opportunities for
improvement can be
identified. The Japanese refer to such direct observation of
work as gemba. There-
sulting value stream map shows the beginning and ending points
of the process, the
steps and tasks between those points, and relevant performance
information abou
the process. Figure 7.1 is a simplified value stream map
showing how patients flm ,-
through a multispecialty clinic. Improvements to the process
come from studying the
value stream map and then asking and answering the question,
"Is this step or task
necessary in creating value to the customer?" Processing steps
and tasks that are n ot
necessary or are non-value-adding, such as the numerous
waiting times in the figure,
should then be reduced or removed to improve performance and
ultimately enhance
value in the product or service provided to the customer.
The third tenet in lean thinking is to ensure that flow within a
process is simple,
smooth, and error-free, thereby avoiding waste . To appreciate
this tenet, look at Fig-
ure 7.2, where production is viewed as a stream and the water
level as the inventory
of raw materials, work-in-progress, and finished goods. At the
bottom of the stream
are rocks, which represent problems related to quality,
suppliers, delivery, machine
breakdowns, and so forth. The traditional approach is to hold
inventory high
enough to cover up the rocks (problems) and thus keep the
stream flowing. Lean
- RE 7.2 Simple, smooth, and nonwasteful flow: A stream
analogy.
Original situation
¥en tory covers problems)
Water level lowered
(problems are exposed)
Chapter 7 Lean Thinking and Lean Sys tems 139
Water flows smoothly
(once problems are solved)
thinking calls for the opposite: lowering the water (inventory)
level to expose the
rocks (problems) . When the rocks have been pulverized (i.e.,
the problems have
been solved), the water is lowered again to expose more rocks.
This sequence is iter-
ated until all rocks are turned into pebbles and the stream
(production system) flows
smoothly and simply at the desired output rate while only
needing a low level of
inventory at any given time. Inventory in this analogy is a form
of waste that hides
problems that contribute to other forms of waste besides
inventory.
The idea of simple, smooth, and error-free flow means that
production flows are
simple and direct, and do not change from one production run or
one customer to
another. Such predictable flows ensure that the exact
appropriate resources, includ-
ing labor and equipment, can be devoted to each production
step. It also means that
workers should.understand the connection of their own work to
work performed
upstream (before them in the production process) as well as
work that follows their
own. These direct and unambiguous links in the process provide
complete certainty
about exactly who has performed what work within the process.
The goal is to avoid
repeating the same activities more than once, for example,
retightening a bolt, rein-
specting paperwork, or reasking the customer for the same
information.
There are many techniques that are used to help smooth the
production flow.
These techniques are covered later in the chapter.
The goal of ensuring simple, smooth, error-free flow can be
extended up the sup-
ply chain to include suppliers. In lean manufacturing, both
workers and suppliers
are charged with the responsibility of producing quality parts
just in time to support
the next production process. In a production plant, workers are
required to stop the
production process by pulling a cord that triggers a call for
help.3 In addition to hav-
ing greater responsibility for production in a lean system,
workers and suppliers are
also charged with developing ideas for improving the
production process. Through
quality teams, suggestion systems, and other forms of
participation by workers and
suppliers, the process of production is improved. The idea is
that the workers who
are performing the work know the most about the work and,
therefore, are in the
best position to improve the way the work is completed. Thus,
lean thinking encour-
ages the use of the capabilities of workers and suppliers to a
great extent.
The fourth tenet in lean thinking is to produce only what is
pulled by the customer.
Complying with this tenet requires replacing the push system
typical in traditional
3 This specific responsibility is known as Jidoka in Japanese (or
Autonomation ). The cord that triggers a
visual ca ll for help is ca lled an andon cord .
140 Part Two Process Design
mass production with the pull system of lean production. A push
system aims to
produce goods or ensure delivery of services well in advance of
demand, often ac-
cording to a schedule or plan created from potentially
inaccurate forecasts. Large
batches of materials are pushed from one process or machine to
the next regardless
of whether the inventory is needed. This allows machines and
processes to be u ti-
lized at full capacity, and inventory is considered a valuable
asset. A pull system, on
the contrary, waits for the process customer to signal a need for
a good or service
before producing it to fulfill that need. The signal from the
customer is then sent vi-
sually up the various stages of production-and even the supply
chain-to signal
what and when production and delivery are needed. No
upstream process is autho-
rized to produce a good or service until a downstream customer
asks for it, thu
minimizing inventory throughout the production system. An
example of a push
system is the "hub and spoke" system used by many of the
major airlines. Flying
point to point by some airlines is a pull system based on what
the customer wants.
No customer wants to connect through a hub to get to their
destination.
The fifth tenet in lean thinking is to strive for pe1jection.
Striving for perfection
requires continuous improvement of all processes as well as
radical redesign when
necessary. When continuous improvement is undertaken, more
value is provided
by the firm in its search for ultimate perfection for the
customer. The definition of
perfection used here is an affordable good or service, delivered
rapidly and on
time, that meets the needs of the customer. When customer
needs change, the def-
inition of value changes and so does the definition of what
constitutes perfection .
There is therefore no end to the improvements that can b e
sought and made.
In lean thinking, the process changes necessary in seeking
perfection must b e
made using scientific methods, including designing experiments
and testing h y-
potheses. Employees are discouraged from changing a process
based on intuition
alone. Rather, lean thinking promotes decision making based on
scientifically de-
rived evidence.
One simple and relatively powerful technique for improving a
production pro-
cess is the 5 Whys technique. This problem-solving technique
systematically ex-
plores the cause-and-effect relationships that underlie an
observed problem (e.g., a
defect in a product or lateness in delivery) . By asking why at
least five times, this
technique is used to deliver insights into the root cause of an
observed problem so
that proper corrective action can be taken to prevent the root
cause from re-creating
the observed problem. Here is an example: The truck will not
start. Why? The bat-
tery is dead. Why? The alternator is not functioning. Why? The
alternator belt is
broken. Why? The alternator b elt was well beyond its useful
life and not replaced.
Why? The truck was not maintained according to the
recommended service sched-
ule. Why? Replacement parts are not available because the truck
is old. Asking why
helps move toward potential solutions: Find a source for
replacement parts or pur-
chase a different truck that is maintainable.4
Another well-known technique supporting lean thinking is SS.
This is a tech-
nique for organizing a workspace (e.g., production shop floor,
office space, hospital
station, tool shop) to improve employee morale, environmental
safety, and process
efficiency. The name of this technique comes from five
Japanese terms, all of which
when transliterated and translated begin with the letters. These
terms are defined in
Table 7.2. Underlying the SS technique is the belief that when a
workspace is well
organized, time will not be wasted looking for "things" (e.g., a
tool or paperwork);
misplaced items also will be readily noticed. By having
employees decide which
4 Adapted from w ikipedia. org (201 2).
Chapter? LeanThinkingandLeanS ys tems 141
Operations Leader ss +Safety= 6S! , ·
The U.S. Environmenta l Protection Agency provides
training materials to businesses for safe storage of
hazardous chemicals in work environments, calling
t he program 65, which stands for 55 + Safety. The
training uses standard 55 methods on removing un-
used chemicals that are lingering in storage areas,
d ecentralizing chemicals by moving them to where
th ey are used in work processes, and organ izing and
labeling storage areas so that the chemicals are easy
t o find and their absence is easily noticed.
The photos show an examp le from one manufac-
t u ring p lant where, before 55 activities w ere con -
ducted, chemica ls were disorganized and difficult to
locat e. Following 55, the storage cabinet contains
o n ly chemica ls that are needed nearby, in quantities
th at last only a few days, and labeled shelves can be
easily restocked as needed . "A helpful ru le of
thumb is that an yone should be ab le to find any
item in 30 seconds or less ."
The sixth 5 for safety is integrated with standard
55 methods. To promote safe use and storage of
chemicals, 65 training helps businesses develop ap-
propriate visual warnings in areas near chemica ls,
locate spill kits nearby for cleanup , and clear and
clean the space around storage cabinets to avoid
t ripping hazards.
Lean concepts like 55, as seen in this example, can
be customized to the pa rticular needs of an organi-
zation or situation. Safety is integrated here w ith 55,
a logical connection when hazardous chemica ls are
being used.
Source: Adapted from www. epa .gov, 2012 .
items should be kept where as well as how they sh ould be
stored, SS can instill in
employees a sense of ownership, help standardize work, assure
a safe work envi-
ronment, and keep processes from becoming overly complex.
See the Operations
Leader b ox titled "SS + Safety = 6S!"
As you can see, the five tenets of lean thinking have many
techniques and con-
cepts associated with them. In the following sections, we dive
into more d etail on
several of the most commonly u sed techniques .
Term Translation
Seiri To sort
Seiton To straighten or set in
order
Seiso To shine, sweep, or
clean
Seiketsu To standardize
Shitsuke To sustain
Meaning
Decide what things should be kept and w hat things
should be discarded so that on ly the essential things
remain.
Arrange essential things in a manner that sup ports an efficient
flow of work.
Assure cleanl iness by returning things to thei r storage
locations and removing things that do not belong.
Standardize work and adopt seiri-seiton-seiso t hrougho ut
so that all employees know w hat their responsibilities are.
Mainta in seiri-seiton-seiso-seikutsu as a hab it of work
and a way to operate.
.. - - -
142 Part Two Process Design
7.3 STABILIZING THE MASTER SCHEDULE
One of the ways that firms can move toward achieving the lean
tenet of simp-=-
smooth, and error-free flow is to level the amount of work that
is performed ea.-
day. For a service, this might mean scheduling a certain number
of customers ea-
day or using methods such as advertising or pricing to even out
the numb er
customers who want the service each day. This practice is
referred to as stab iliz-
ing the master schedule. Although this terminology is generally
not used in
vices, the concept still applies, as we will see. The process of
production plannic;
for manufacturing starts with a long-range production plan,
which then is bro~
down into annual, monthly, and daily plans. As part of this
production planninc
sales are considered, profit planning is done, and capacity is
planned. This p lan-
ning process starts with an aggregate production plan and then
breaks it dm~
into the daily production volume needed to meet the planned
demand.
Master scheduling for products is done to achieve a uniform
load, the assign-
ment of approximately equal amounts of work to each machine
or worker. Th
production horizon must be set at least one week in advance and
possibly one o:
two months in advance, depending on lead times for production,
purchasing
and capacity changes. Assume for the purpose of discussion that
a one-mon tl;
rolling schedule is used in which one month of production is
scheduled ir..
advance . Also assume that the schedule, calls for 10,000 units
of product A
5000 units of product B, and 5000 units of product C. If there
are 20 days of pro-
duction in the month, the daily schedule will call for V20 of
each model produceci
in each day: 500A, 250B, and 250C. Furthermore, the individual
units will be
mixed as they go down the production line. The sequence will
be I AABC t
AABC/AABC /. Note how two units of A are produced for every
unit of Band C.
Then the sequence is repeated continually. Automobile
assembly processes are
often sequenced in this manner when multiple models are
produced on the same
line, ensuring that production of each model is completed at
approximately th e
same rate that it is purchased.
Matching supply to demand is illustrated by the concept of takt
time. Takt is the
German word for the baton that an orchestra director uses to
regulate the speed of
the music. In lean production systems takt time is the time
between successive
units of production; this represents the speed of output. For
example, a takt time
of 2 minutes means that one unit is produced every 2 minutes,
or 30 units are pro-
duced in an hour (60/ 2) . In lean production systems the takt
time of production
should be set equal to the average demand rate of the market to
match production
with demand and thus minimize inventories.
To establish the beat of the market, takt time can be computed
by dividing the time
available for production (being sure to subtract for
nonproductive time such as holi-
days and lunch breaks) by the demand over the same period. For
example, if market
demand is 1000 units of a product per day and there are 7 hours
of production time
available in the day (or 420 minutes), the takt time is then (420
+ 1000) = 0.42 minute
per unit. So, given the available production time, production of
one unit will have to
be completed every 0.42 minute (about 25 seconds) to meet
market demand. Produc-
ing at rates less than the takt time will result in shortages in
meeting the demand, and
producing at rates greater than takt time will result in building
up inventory. The
idea of takt time is to produce at a constant rate that equals
average demand.
Once the monthly master schedule has been set, this information
must be trans-
mitted to all work centers and suppliers. They will then plan
their capacity in
Chapter 7 Lean Th inking and Lean Systems 143
terms of numbers of workers needed, overtime, subcontracting,
and possibly new
equipment. Enough lead time must be given so they can obtain
the resources they
need to complete the scheduled work on time.
The lean production system does not allow overproduction once
the daily
quota has been set, since production is scheduled just in time to
meet demand.
For example, if the daily quota is met in six hours, production is
stopped and
workers do maintenance or have quality-team meetings.
Similarly, if production
falls behind, it is usually made up by overtime the same day.
This is facilitated by
shift scheduling, which allows some time between shifts. For
example, a two-
shift operation might be scheduled from 7 a.m. to 3 p.m. and
from 5 p.m. to 1 a.m.
Maintenance and overtime occur between shifts. The objective
of the lean pro-
duction system is to produce the right quantity each day-no
more and no less .
Master scheduling thus closely resembles average customer
demand on a daily
basis . This minimizes finished-goods inventory since the
production output is
closely matched to demand. This type of master schedule also
helps reduce work-
in-process and raw-materials inv entories, since stabilizing the
master schedule
provides nearly constant demands on all work centers and
outside suppliers.
Contrast this with traditional mass-production processes in
which lot sizes are
large, and are not matched to market demand, resulting in large
inventories of
finished goods, work in process, and raw materials.
A stable master schedule and uniform load are desirable for
gaining the most
benefit from a lean system. But they are not strictly required
elements of lean sys-
tems. For example, Minneapolis Heart Institute (MHI) designed
a patient treat-
ment protocol based on lean thinking. 5 Heart attack patients at
rural hospitals
throughout Minnesota are rapidly transported via air or ground
ambulance to a
Minneapolis hospital for specialized treatment that is not
available in rural areas.
Since heart attacks occur randomly, demand for this service
cannot be stabilized or
use a takt time in the same manner that these concepts are
applied in manufactur-
ing. But eliminating non-value-adding activities and creating
simple and rapid
flow through the treatment process have enabled MHI to reduce
average treat-
ment times to 95 minutes from 3 to 4 hours prior to lean
thinking. And mortality
rates for these p atients are about half of the national average.
We can see from this
example that not every lean technique must necessarily be used
in every situation.
Lean is a flexible system and its techniques can be applied as
needed.
CONTROLLING FLOW WITH THE KANBAN SYSTEM
Kanb an is the method of production authorization and materials
movement in the
lean production system that supports the tenet of producing only
what is pulled by
the customer. Kanban in the Japanese language means a marker
(card, sign, plaque, or
other device) used to control the timing and sequencing of work
through a sequential
process. The kanban system is a simple and visual "parts
withdrawal system" involv-
ing cards and containers to pull parts from one work center to
the next just in time. In
services, a kanban system might be used to pull many types of
work such as paper-
work, or even the customer! Since kanbans are mostly
associated with manufacturing,
we'll discuss how they are used to pull inventory through a
production system.
The purpose of the kanban system is to signal the need for more
parts and en-
sure that those parts are produced just in time to support
subsequent work centers.
5 Shah et al. (2 008).
144 Part Two Process Des ign
_.,_
....
--
'~
" " .
---
KANBAN SQUARE AT HONEYWELL. The kanban
square marked by the dashed rectangle signals the need
for the production of a cabinet. Only one cabinet is placed
on this square at a time. When the square is emptied by
subsequent production, another cabinet is produced.
Parts are kept in small containers, and only a J~ _
cific number of those containers are provid--
When all the containers are filled, production
stopped, and no more parts are produced until ::-
subsequent (receiving) work center provides c:
empty container. Thus, work-in-process invento:-
is limited to available containers, and parts a:_
provided only as needed.
The final assembly schedule is used to p
parts from one work center to the next just in tilr.:e
to support production needs, which are align--
with market demand. Only the final assembly line
receives a schedule from the dispatching office
and this schedule is nearly the same from day -
day. All other machine operators and suppliers ~
ceive production orders (kanban cards) from th.._
subsequent (receiving) work centers. If productior
stops for a time in the receiving work centers, th
supplying work centers also stop soon beca
their parts containers become full since they n
longer receive kanban orders for more materieL
The kanban system can be extended to supplie~
so that the suppliers also respond only to demam.d generated by
the factory.
To see how the kanban system works as a physical control
system, assume tha:
eight containers are used between work centers A and B (A
supplies B) and tha:
each container holds exactly 20 parts. The maximum inventory
that can exist be-
tween these two work centers is 160 units (8 X 20) since
production at work center
A will stop when all the containers are filled .
In the normal course of a day, the eight containers might be
distributed as
shown in Figure 7.3. Three containers filled with parts are
located at work center
FIGURE 7.3 Kanban system.
roduction _ ~ 11
Production card
anban post ~ -
Input
area
Output
In transit
Withdrawal card
Input
area
~
~
~
Output
area
_/Twithdrawal
~ 6 kanbanpost
"Process System
Improvement:
Implementation
"F"eaturing Gortrac,"
Vol. X
Chapter 7 Lean Th inking and Lean Systems 145
A in the output area. One container is currently being filled by
the machine at
work center A. One full container is being moved from A to B,
two full containers
are sitting in the input area of work center B, and one container
is being used at B.
These eight containers are needed since w ork center A also p ro
duces parts for
other work centers, machines at A may break down, and move
times from A to B
are not always exactly predictable.
Some companies control the movement of containers b y u sing
two types
of kanban cards : production cards and withdrawal (move) cards
. These cards
are used to authorize production and to identify the parts in any
container.
Kanban cards may be made of paper, metal, or plastic, and they
generally con-
tain the information shown in Figure 7.4 . Kanban cards take the
place of the
shop paperwork used in traditional mass production. Instead of
using cards,
production can also be controlled by kanban squares that v
isually signal the
need for work (to fill the kanban squa re) , or by visual control
of the empty
containers .
Most importantly, the kanban system is visual in nature . All
parts are neatly
placed in containers of a fixed size. As empty containers
accumulate, it is clear
that the producing work center is falling behind . When all the
containers are
filled, production is stopped. The production lot size is exactly
equal to one con-
tainer of parts . All of these are visual indicators of the work
that should be done
or stopped .
The number of containers needed to operate a work center is a
function of the
demand rate, container size, and the lead time for a container.
This is illustrated by
the follow ing formula :6
DT
n =-
C
where n = total number of containers
D =demand rate of the using work center
C = container size, in number of p arts, usually less than 10
percent of daily
d emand
T = time for a container to complete an entire circuit: filled ,
wait, moved,
u sed, and returned to be filled again (also called lead time)
RE 7.4 Kanban cards.
~wmber __ W_ 2_6_2 __________ __
_·arn e WHE EL
Cap acity Box Type Issue No.
- B 4 of 8 -
Withdrawal Kanban
Preceding Process
STAMPING
A12
Subsequent Process
RUBBER T I RE
B6
Par t Number Y16032
Part Name WH EE L RIM
Stock Location at
Wh ich to Store:
1 879-2
Container Capacity: 2 0
Production Kanban
Process
STAMPI NG
A1 2
6 Safety stock can be added to the numerator of th e formula to
account for uncertainty in demand or the time.
146 Part Two Process Design
Suppose demand at the receiving work center B is 2 parts per m
in ute .::-
standard container holds 25 parts. Also assume that it takes 100
minutes oi:::
time for a container to make a complete circuit from work
center A to work -
ter Band back to A again, including all setup, run, move, and
wait time. The r
ber of containers needed in this case is eight:
2(100) = 8
n = 25
The maximum inventory is equal to the container size times the
number of
tainers (200 units = 8 X 25), since the most we can have is all
containers filleci:
Maximum inventory = nC = DT
Inventory can be decreased by reducing the size of the
containers or the ntc"
ber of containers used. This is done by reducing the lead time,
the time requireG.-
circulate a container. When any of these times have been
reduced, managemc:-
can remove kanban cards from the system and remove a
corresponding numb er
containers. It is the responsibility of managers and workers in a
lean system-
reduce inventory by means of a constant cycle of improvement.
Reducing lea-
time by reducing the fill, wait, move, use, or return times is the
key.
A complete kanban system can link all work centers in a
production fa cili._
It can, moreov er, link the production facility to its suppliers, as
show n ::.::-
Figure 7.5. With such a kanban system, all material is pulled
through t::...
FIGURE 7.5 Linking work centers and suppliers w ith a kanban
system.
Source: Rober t W. Hall, Driving the Productivity Machine:
Production Planning and Control in Japan (Falls Church, VA:
American Production and Inventory
Control Society, 1981) .
Input
area
' ••  .. 
',·· ...•
Supplier
1
Input
area
_.,. ~ .. ~ ..
,.~ ... ·· ~
~ •• lit
~ .. ~
I
•••• .. ~ .. ..~ . __ ,.~
Supplier
2
Input
area
~
,.------
; "" ...... ,
•••• •••• •
•••••• '!( ,.; ------
Input
area
Final
assembly
line
.. ~
· ·~
- - + Withdrawal kanban ---··~ Production kanban • • • • • • • .
Physical materials flow
··•
Chapter 7 Lean T hinking and Lean Systems 147
production system by the final assembly schedule, based on a
highly visible
shop-floor and supplier control system.
REDUCING SETUP TIME AND LOT SIZES
Additional techniques for applying lean thinking to remove non-
value-adding
activities include reducing setup time and lot or batch sizes.
Setup time is the
nonproductive time when machines are being adjusted before
beginning work
on a new batch of parts . In a service setting, it might include
readying a cus-
tomer for service, for example, guiding a customer from the
waiting room to an
exam chair, and adjusting the chair position for a dental exam.
Red ucing setup
tim e is important in lean production systems because it
increases available capac-
ity, increases flexibility to meet schedule changes, and reduces
inventory. As setup
time approaches zero, the idea1 lot size of one unit can be
reached.
Manufacturing managers have typically concentrated on
reducing run times
per unit and more or less ignored setup times. When long runs
of thousands of
units are anticipated, run times naturally are more important
than setup times.
A better solution is to concentrate on reducing both setup times
and run times.
This requires additional attention by engineers, managers, and
workers to the
setup process .
Since setup time has received so little attention, phenomenal
reductions are
possible. For example, at General Motors the time required to
change a die in a
large punch press was reduced from 6 hours to 18 minutes. This
allowed dramatic
reductions in inv entory at this work center from $1 million to
$100,000, a reduc-
tion in lead times, and greater utilization of capacity.
Single setup s are being sought in many companies. This refers
to a setup time
that is completed in single digit minutes. One-tou ch se tu p s
are also being
pursued; this refers to a setup of less than one minute. These
low setup times can
be achieved by designing a two-step setup process. First,
external and internal
setups are separated. The term internal setup refers to actions
that require the
machine to be stopped, whereas an external setup can be done
while the
machine is operating. The external setup is analogous to the on-
deck batter in
baseball; the player is warmed up and ready to move into
position as soon as the
prior batter is finished. After internal and external setups are
separated, as much
of the setup as possible is converted from internal
to external. This is done, for example, by using
two sets of dies, one inside the machine and one
outside; having quick change adjustments; and
employing cleverly designed tools and fixtures .
Once the machine is stopped, it can be quickly
readied for a new product since internal setup has
been minimized . Much improvement in setup
time can be accomplished once people realize its
importance in reducing waste (waiting time).
In some companies, the workers even practice
setups to reduce the time. For example, hospital
personnel practice moving patients from the emer-
gency room to surgery so they can resolve (before
make quick changeovers of race cars. a real patient arrives)
problems such as slow or
148 Part Two Process Design
unavailable elevators that might cause a delay. A good example
of quick char-~~
over comes from the racetrack. Race cars are quickly fueled,
tires are changed, c:::
the windshield is washed in short pit stops, the racing
equivalent of a setup ,- _
highly coordinated and trained pit crews using specialized tools
and equipmez:
Southwest Airlines is renowned for its quick turnaround (setup)
times w i
planes, utilizing the techniques discussed here. Much of its
success has been -
tributed to its ability to keep planes productive in the air while
minimizing ·
spent on the ground.
Reduced setup times are particularly useful when multiple
product models=
produced using the same work centers. Earlier in the chapter,
we discussed b
models should be sequenced during production to match their
market demc:::
rate. Such sequencing may presume that setups between models
are small or r.e
zero. When setup time cannot be reduced, it may not be possible
or economica:.
achieve perfectly mixed production at final assembly. In such
cases, small~
should be scheduled while continuing efforts to further reduce
the lot size. :--
goal of single-unit production, a lot size of one, should not be
abandoned sinG:>
may help to further reduce total system costs.
7.6 CHANGING LAYOUT AND MAINTAINING EQUIPMENT
Installation of a lean production system has a natural effect on
layout and e~-
ment. The manufacturing or service facility evolves toward a
more streamlir.
flow because lot sizes are reduced, inventory is held close to
where it is used, c:::
problems are resolved with standardized solutions so that the
problems d o ::-
arise again in the future. Moreover, since inventory is typically
kept low-onl:
few hours or days of supply- work spaces can be much smaller
because of :_
reduced storage space needed. One comparison of
manufacturing plants shm·-~
that only one-third of the space was needed in lean plants,
compared with n.
lean plants.
The effect of lean thinking on layout in a manufacturing plant is
shovvr..
Figure 7.6. In part a of the figure, a non-lean layout is shown in
which suppG:!
deliver to stockrooms and parts are returned to the stockrooms
after cer:c.
stages of production are completed. In part b, a lean production
system has bee:::-
implemented, and all stockrooms have been eliminated. In this
case, all sto6
kept on the shop floor as part of the lean system. Part c of the
figure shows ._;...
the lean layout has evolved to a group technology (GT), or
cellular manufa
ing, layout. In this case, the work centers have been redesigned
so that parts c.:
flow smoothly from one work center to the next. Most of the
inventory buffe:-
which are next to each machine, have been eliminated as the
parts flow from
station to the next. It is a natural consequence of lean thinking
to evolve tm•;c:::
cellular manufacturing and feeder-line types of layouts. Effort
is still made to __
duce lot sizes to a single unit.
With a lean production system, preventative maintenance of
equipmen:
extremely important. Since inventories have been cut to
minimal levels as work
strictly adhere to the daily plan for production, it is critical to
avoid unplam:
equipment failures. A lean system requires the right amount of
capacity, the ri~
amount of inventory, the right number of workers, and
everything operating
planned-each and every day. Workers take responsibility for
most of their o·
equipment and workspace maintenance, and this gives them
more control o · ·-
FIGURE 7.6 Improving layout with lean and group technology.
Final
Work Centers Assembly
(a) Initial layout before lean
Line 1
Line2
(c) Lean layout with GT
Chapter 7 Lean Thinking and Lean Systems 149
(b) Lean layout
Final
Assembly
Final
Assembly
their work and work environment. Maintenance time is provided
between shifts
for routine and preventive maintenance actions so that it does
not disrupt the
regular daily work schedule.
CROSS-TRAINING, REWARDING, AND ENGAGING
WORKERS
One of the critical elements needed to make a lean production
system successful is
multifunction workers, who have a much broader set of skills
than their counter-
parts in traditional environments. Cross-training of workers is
therefore a critical
human resources responsibility. In most cases, each worker
must be able to oper-
ate several machines in a manufacturing setting or perform a
variety of tasks in a
service setting. In manufacturing, since parts are not produced
unless they are
needed, the worker must be able to shut down one work center
and move on to
another work center where parts are needed. The worker also
must be able to set
up machines, do routine maintenance, and inspect the parts. The
main benefit of
cross-trained workers is that they provide flexibility to the
production system.
150 Part Two Process Design
~~
Nurses who can be moved to different hospital units and
production workers who
can be shifted to a different production area help to place labor
resources just
where they are needed at any given time. This reduces the need
to have excess la-
bor in specific work areas just in case capacity is needed on
short notice.
TemplateP 10-04NameSectionEnter the appropriate amount or item i.docx

More Related Content

Similar to TemplateP 10-04NameSectionEnter the appropriate amount or item i.docx

This case was prepared by Richard T. Bliss, Professor of F
This case was prepared by Richard T. Bliss, Professor of FThis case was prepared by Richard T. Bliss, Professor of F
This case was prepared by Richard T. Bliss, Professor of FGrazynaBroyles24
 
Summary Of BaconS Essay Of Death. Online assignment writing service.
Summary Of BaconS Essay Of Death. Online assignment writing service.Summary Of BaconS Essay Of Death. Online assignment writing service.
Summary Of BaconS Essay Of Death. Online assignment writing service.Yolanda Allrich
 
Interbrand Breakthrough Brands Report 2021
Interbrand Breakthrough Brands Report 2021 Interbrand Breakthrough Brands Report 2021
Interbrand Breakthrough Brands Report 2021 Social Samosa
 
Fight Against Corruption India Essay. Online assignment writing service.
Fight Against Corruption India Essay. Online assignment writing service.Fight Against Corruption India Essay. Online assignment writing service.
Fight Against Corruption India Essay. Online assignment writing service.Heather White
 
1Running head NIKE COMPANYPAGE 12NIKE COMPANYNIKE C.docx
1Running head  NIKE COMPANYPAGE  12NIKE COMPANYNIKE C.docx1Running head  NIKE COMPANYPAGE  12NIKE COMPANYNIKE C.docx
1Running head NIKE COMPANYPAGE 12NIKE COMPANYNIKE C.docxeugeniadean34240
 
Zara Case Study Swot Analysis And Pestle Analysis
Zara Case Study Swot Analysis And Pestle AnalysisZara Case Study Swot Analysis And Pestle Analysis
Zara Case Study Swot Analysis And Pestle AnalysisMyAssignmenthelp.com
 
Crocs, inc reasearch
Crocs, inc reasearchCrocs, inc reasearch
Crocs, inc reasearchEsraaFarghaly
 
An Evaluation Of Nike Inc.
An Evaluation Of Nike Inc.An Evaluation Of Nike Inc.
An Evaluation Of Nike Inc.Brenda Zerr
 
Business Quiz Prelims with Answers
Business Quiz Prelims with AnswersBusiness Quiz Prelims with Answers
Business Quiz Prelims with AnswersQuest-SGGSCC
 
Strategic Management Presentation
Strategic Management PresentationStrategic Management Presentation
Strategic Management PresentationZeeshan Chaudhry
 
Rossignol, Final project (Quality Management)
Rossignol, Final project (Quality Management)Rossignol, Final project (Quality Management)
Rossignol, Final project (Quality Management)Aliaksey Narko
 
Sports industry footwear report
Sports industry footwear reportSports industry footwear report
Sports industry footwear reportAli Akbar Sahiwala
 

Similar to TemplateP 10-04NameSectionEnter the appropriate amount or item i.docx (17)

This case was prepared by Richard T. Bliss, Professor of F
This case was prepared by Richard T. Bliss, Professor of FThis case was prepared by Richard T. Bliss, Professor of F
This case was prepared by Richard T. Bliss, Professor of F
 
Summary Of BaconS Essay Of Death. Online assignment writing service.
Summary Of BaconS Essay Of Death. Online assignment writing service.Summary Of BaconS Essay Of Death. Online assignment writing service.
Summary Of BaconS Essay Of Death. Online assignment writing service.
 
Dale Chihuly
Dale ChihulyDale Chihuly
Dale Chihuly
 
Nike
NikeNike
Nike
 
Interbrand Breakthrough Brands Report 2021
Interbrand Breakthrough Brands Report 2021 Interbrand Breakthrough Brands Report 2021
Interbrand Breakthrough Brands Report 2021
 
Fight Against Corruption India Essay. Online assignment writing service.
Fight Against Corruption India Essay. Online assignment writing service.Fight Against Corruption India Essay. Online assignment writing service.
Fight Against Corruption India Essay. Online assignment writing service.
 
Nike
NikeNike
Nike
 
1Running head NIKE COMPANYPAGE 12NIKE COMPANYNIKE C.docx
1Running head  NIKE COMPANYPAGE  12NIKE COMPANYNIKE C.docx1Running head  NIKE COMPANYPAGE  12NIKE COMPANYNIKE C.docx
1Running head NIKE COMPANYPAGE 12NIKE COMPANYNIKE C.docx
 
Zara Case Study Swot Analysis And Pestle Analysis
Zara Case Study Swot Analysis And Pestle AnalysisZara Case Study Swot Analysis And Pestle Analysis
Zara Case Study Swot Analysis And Pestle Analysis
 
Crocs, inc reasearch
Crocs, inc reasearchCrocs, inc reasearch
Crocs, inc reasearch
 
Nike_Industry Visit
Nike_Industry VisitNike_Industry Visit
Nike_Industry Visit
 
An Evaluation Of Nike Inc.
An Evaluation Of Nike Inc.An Evaluation Of Nike Inc.
An Evaluation Of Nike Inc.
 
CROCS - MISSION STATEMENT
CROCS - MISSION STATEMENTCROCS - MISSION STATEMENT
CROCS - MISSION STATEMENT
 
Business Quiz Prelims with Answers
Business Quiz Prelims with AnswersBusiness Quiz Prelims with Answers
Business Quiz Prelims with Answers
 
Strategic Management Presentation
Strategic Management PresentationStrategic Management Presentation
Strategic Management Presentation
 
Rossignol, Final project (Quality Management)
Rossignol, Final project (Quality Management)Rossignol, Final project (Quality Management)
Rossignol, Final project (Quality Management)
 
Sports industry footwear report
Sports industry footwear reportSports industry footwear report
Sports industry footwear report
 

More from mattinsonjanel

The changes required in the IT project plan for Telecomm Ltd would.docx
The changes required in the IT project plan for Telecomm Ltd would.docxThe changes required in the IT project plan for Telecomm Ltd would.docx
The changes required in the IT project plan for Telecomm Ltd would.docxmattinsonjanel
 
The Catholic University of America Metropolitan School of .docx
The Catholic University of America Metropolitan School of .docxThe Catholic University of America Metropolitan School of .docx
The Catholic University of America Metropolitan School of .docxmattinsonjanel
 
The Case of Frank and Judy. During the past few years Frank an.docx
The Case of Frank and Judy. During the past few years Frank an.docxThe Case of Frank and Judy. During the past few years Frank an.docx
The Case of Frank and Judy. During the past few years Frank an.docxmattinsonjanel
 
The Case of MikeChapter 5 • Common Theoretical Counseling Perspe.docx
The Case of MikeChapter 5 • Common Theoretical Counseling Perspe.docxThe Case of MikeChapter 5 • Common Theoretical Counseling Perspe.docx
The Case of MikeChapter 5 • Common Theoretical Counseling Perspe.docxmattinsonjanel
 
THE CHRONICLE OF HIGHER EDUCATIONNovember 8, 2002 -- vol. 49, .docx
THE CHRONICLE OF HIGHER EDUCATIONNovember 8, 2002 -- vol. 49, .docxTHE CHRONICLE OF HIGHER EDUCATIONNovember 8, 2002 -- vol. 49, .docx
THE CHRONICLE OF HIGHER EDUCATIONNovember 8, 2002 -- vol. 49, .docxmattinsonjanel
 
The chart is a guide rather than an absolute – feel free to modify.docx
The chart is a guide rather than an absolute – feel free to modify.docxThe chart is a guide rather than an absolute – feel free to modify.docx
The chart is a guide rather than an absolute – feel free to modify.docxmattinsonjanel
 
The Challenge of Choosing FoodFor this forum, please read http.docx
The Challenge of Choosing FoodFor this forum, please read http.docxThe Challenge of Choosing FoodFor this forum, please read http.docx
The Challenge of Choosing FoodFor this forum, please read http.docxmattinsonjanel
 
The Civil Rights Movem.docx
The Civil Rights Movem.docxThe Civil Rights Movem.docx
The Civil Rights Movem.docxmattinsonjanel
 
The Churchill CentreReturn to Full GraphicsThe Churchi.docx
The Churchill CentreReturn to Full GraphicsThe Churchi.docxThe Churchill CentreReturn to Full GraphicsThe Churchi.docx
The Churchill CentreReturn to Full GraphicsThe Churchi.docxmattinsonjanel
 
The Categorical Imperative (selections taken from The Foundati.docx
The Categorical Imperative (selections taken from The Foundati.docxThe Categorical Imperative (selections taken from The Foundati.docx
The Categorical Imperative (selections taken from The Foundati.docxmattinsonjanel
 
The cave represents how we are trained to think, fell or act accor.docx
The cave represents how we are trained to think, fell or act accor.docxThe cave represents how we are trained to think, fell or act accor.docx
The cave represents how we are trained to think, fell or act accor.docxmattinsonjanel
 
The Case Superior Foods Corporation Faces a ChallengeOn his way.docx
The Case Superior Foods Corporation Faces a ChallengeOn his way.docxThe Case Superior Foods Corporation Faces a ChallengeOn his way.docx
The Case Superior Foods Corporation Faces a ChallengeOn his way.docxmattinsonjanel
 
The Case You can choose to discuss relativism in view of one .docx
The Case You can choose to discuss relativism in view of one .docxThe Case You can choose to discuss relativism in view of one .docx
The Case You can choose to discuss relativism in view of one .docxmattinsonjanel
 
The Case Study of Jim, Week Six The body or text (i.e., not rest.docx
The Case Study of Jim, Week Six The body or text (i.e., not rest.docxThe Case Study of Jim, Week Six The body or text (i.e., not rest.docx
The Case Study of Jim, Week Six The body or text (i.e., not rest.docxmattinsonjanel
 
The Case of Missing Boots Made in ItalyYou can lead a shipper to.docx
The Case of Missing Boots Made in ItalyYou can lead a shipper to.docxThe Case of Missing Boots Made in ItalyYou can lead a shipper to.docx
The Case of Missing Boots Made in ItalyYou can lead a shipper to.docxmattinsonjanel
 
The Cardiovascular SystemNSCI281 Version 51University of .docx
The Cardiovascular SystemNSCI281 Version 51University of .docxThe Cardiovascular SystemNSCI281 Version 51University of .docx
The Cardiovascular SystemNSCI281 Version 51University of .docxmattinsonjanel
 
The Cardiovascular SystemNSCI281 Version 55University of .docx
The Cardiovascular SystemNSCI281 Version 55University of .docxThe Cardiovascular SystemNSCI281 Version 55University of .docx
The Cardiovascular SystemNSCI281 Version 55University of .docxmattinsonjanel
 
The Case of Jeff Pedophile in InstitutionJeff is a 35-year-old .docx
The Case of Jeff Pedophile in InstitutionJeff is a 35-year-old .docxThe Case of Jeff Pedophile in InstitutionJeff is a 35-year-old .docx
The Case of Jeff Pedophile in InstitutionJeff is a 35-year-old .docxmattinsonjanel
 
The British Airways Swipe Card Debacle case study;On Friday, Jul.docx
The British Airways Swipe Card Debacle case study;On Friday, Jul.docxThe British Airways Swipe Card Debacle case study;On Friday, Jul.docx
The British Airways Swipe Card Debacle case study;On Friday, Jul.docxmattinsonjanel
 
The Case Abstract Accuracy International (AI) is a s.docx
The Case  Abstract  Accuracy International (AI) is a s.docxThe Case  Abstract  Accuracy International (AI) is a s.docx
The Case Abstract Accuracy International (AI) is a s.docxmattinsonjanel
 

More from mattinsonjanel (20)

The changes required in the IT project plan for Telecomm Ltd would.docx
The changes required in the IT project plan for Telecomm Ltd would.docxThe changes required in the IT project plan for Telecomm Ltd would.docx
The changes required in the IT project plan for Telecomm Ltd would.docx
 
The Catholic University of America Metropolitan School of .docx
The Catholic University of America Metropolitan School of .docxThe Catholic University of America Metropolitan School of .docx
The Catholic University of America Metropolitan School of .docx
 
The Case of Frank and Judy. During the past few years Frank an.docx
The Case of Frank and Judy. During the past few years Frank an.docxThe Case of Frank and Judy. During the past few years Frank an.docx
The Case of Frank and Judy. During the past few years Frank an.docx
 
The Case of MikeChapter 5 • Common Theoretical Counseling Perspe.docx
The Case of MikeChapter 5 • Common Theoretical Counseling Perspe.docxThe Case of MikeChapter 5 • Common Theoretical Counseling Perspe.docx
The Case of MikeChapter 5 • Common Theoretical Counseling Perspe.docx
 
THE CHRONICLE OF HIGHER EDUCATIONNovember 8, 2002 -- vol. 49, .docx
THE CHRONICLE OF HIGHER EDUCATIONNovember 8, 2002 -- vol. 49, .docxTHE CHRONICLE OF HIGHER EDUCATIONNovember 8, 2002 -- vol. 49, .docx
THE CHRONICLE OF HIGHER EDUCATIONNovember 8, 2002 -- vol. 49, .docx
 
The chart is a guide rather than an absolute – feel free to modify.docx
The chart is a guide rather than an absolute – feel free to modify.docxThe chart is a guide rather than an absolute – feel free to modify.docx
The chart is a guide rather than an absolute – feel free to modify.docx
 
The Challenge of Choosing FoodFor this forum, please read http.docx
The Challenge of Choosing FoodFor this forum, please read http.docxThe Challenge of Choosing FoodFor this forum, please read http.docx
The Challenge of Choosing FoodFor this forum, please read http.docx
 
The Civil Rights Movem.docx
The Civil Rights Movem.docxThe Civil Rights Movem.docx
The Civil Rights Movem.docx
 
The Churchill CentreReturn to Full GraphicsThe Churchi.docx
The Churchill CentreReturn to Full GraphicsThe Churchi.docxThe Churchill CentreReturn to Full GraphicsThe Churchi.docx
The Churchill CentreReturn to Full GraphicsThe Churchi.docx
 
The Categorical Imperative (selections taken from The Foundati.docx
The Categorical Imperative (selections taken from The Foundati.docxThe Categorical Imperative (selections taken from The Foundati.docx
The Categorical Imperative (selections taken from The Foundati.docx
 
The cave represents how we are trained to think, fell or act accor.docx
The cave represents how we are trained to think, fell or act accor.docxThe cave represents how we are trained to think, fell or act accor.docx
The cave represents how we are trained to think, fell or act accor.docx
 
The Case Superior Foods Corporation Faces a ChallengeOn his way.docx
The Case Superior Foods Corporation Faces a ChallengeOn his way.docxThe Case Superior Foods Corporation Faces a ChallengeOn his way.docx
The Case Superior Foods Corporation Faces a ChallengeOn his way.docx
 
The Case You can choose to discuss relativism in view of one .docx
The Case You can choose to discuss relativism in view of one .docxThe Case You can choose to discuss relativism in view of one .docx
The Case You can choose to discuss relativism in view of one .docx
 
The Case Study of Jim, Week Six The body or text (i.e., not rest.docx
The Case Study of Jim, Week Six The body or text (i.e., not rest.docxThe Case Study of Jim, Week Six The body or text (i.e., not rest.docx
The Case Study of Jim, Week Six The body or text (i.e., not rest.docx
 
The Case of Missing Boots Made in ItalyYou can lead a shipper to.docx
The Case of Missing Boots Made in ItalyYou can lead a shipper to.docxThe Case of Missing Boots Made in ItalyYou can lead a shipper to.docx
The Case of Missing Boots Made in ItalyYou can lead a shipper to.docx
 
The Cardiovascular SystemNSCI281 Version 51University of .docx
The Cardiovascular SystemNSCI281 Version 51University of .docxThe Cardiovascular SystemNSCI281 Version 51University of .docx
The Cardiovascular SystemNSCI281 Version 51University of .docx
 
The Cardiovascular SystemNSCI281 Version 55University of .docx
The Cardiovascular SystemNSCI281 Version 55University of .docxThe Cardiovascular SystemNSCI281 Version 55University of .docx
The Cardiovascular SystemNSCI281 Version 55University of .docx
 
The Case of Jeff Pedophile in InstitutionJeff is a 35-year-old .docx
The Case of Jeff Pedophile in InstitutionJeff is a 35-year-old .docxThe Case of Jeff Pedophile in InstitutionJeff is a 35-year-old .docx
The Case of Jeff Pedophile in InstitutionJeff is a 35-year-old .docx
 
The British Airways Swipe Card Debacle case study;On Friday, Jul.docx
The British Airways Swipe Card Debacle case study;On Friday, Jul.docxThe British Airways Swipe Card Debacle case study;On Friday, Jul.docx
The British Airways Swipe Card Debacle case study;On Friday, Jul.docx
 
The Case Abstract Accuracy International (AI) is a s.docx
The Case  Abstract  Accuracy International (AI) is a s.docxThe Case  Abstract  Accuracy International (AI) is a s.docx
The Case Abstract Accuracy International (AI) is a s.docx
 

Recently uploaded

_Math 4-Q4 Week 5.pptx Steps in Collecting Data
_Math 4-Q4 Week 5.pptx Steps in Collecting Data_Math 4-Q4 Week 5.pptx Steps in Collecting Data
_Math 4-Q4 Week 5.pptx Steps in Collecting DataJhengPantaleon
 
Alper Gobel In Media Res Media Component
Alper Gobel In Media Res Media ComponentAlper Gobel In Media Res Media Component
Alper Gobel In Media Res Media ComponentInMediaRes1
 
Science 7 - LAND and SEA BREEZE and its Characteristics
Science 7 - LAND and SEA BREEZE and its CharacteristicsScience 7 - LAND and SEA BREEZE and its Characteristics
Science 7 - LAND and SEA BREEZE and its CharacteristicsKarinaGenton
 
MENTAL STATUS EXAMINATION format.docx
MENTAL     STATUS EXAMINATION format.docxMENTAL     STATUS EXAMINATION format.docx
MENTAL STATUS EXAMINATION format.docxPoojaSen20
 
Class 11 Legal Studies Ch-1 Concept of State .pdf
Class 11 Legal Studies Ch-1 Concept of State .pdfClass 11 Legal Studies Ch-1 Concept of State .pdf
Class 11 Legal Studies Ch-1 Concept of State .pdfakmcokerachita
 
Paris 2024 Olympic Geographies - an activity
Paris 2024 Olympic Geographies - an activityParis 2024 Olympic Geographies - an activity
Paris 2024 Olympic Geographies - an activityGeoBlogs
 
BASLIQ CURRENT LOOKBOOK LOOKBOOK(1) (1).pdf
BASLIQ CURRENT LOOKBOOK  LOOKBOOK(1) (1).pdfBASLIQ CURRENT LOOKBOOK  LOOKBOOK(1) (1).pdf
BASLIQ CURRENT LOOKBOOK LOOKBOOK(1) (1).pdfSoniaTolstoy
 
How to Configure Email Server in Odoo 17
How to Configure Email Server in Odoo 17How to Configure Email Server in Odoo 17
How to Configure Email Server in Odoo 17Celine George
 
Presiding Officer Training module 2024 lok sabha elections
Presiding Officer Training module 2024 lok sabha electionsPresiding Officer Training module 2024 lok sabha elections
Presiding Officer Training module 2024 lok sabha electionsanshu789521
 
Accessible design: Minimum effort, maximum impact
Accessible design: Minimum effort, maximum impactAccessible design: Minimum effort, maximum impact
Accessible design: Minimum effort, maximum impactdawncurless
 
18-04-UA_REPORT_MEDIALITERAСY_INDEX-DM_23-1-final-eng.pdf
18-04-UA_REPORT_MEDIALITERAСY_INDEX-DM_23-1-final-eng.pdf18-04-UA_REPORT_MEDIALITERAСY_INDEX-DM_23-1-final-eng.pdf
18-04-UA_REPORT_MEDIALITERAСY_INDEX-DM_23-1-final-eng.pdfssuser54595a
 
How to Make a Pirate ship Primary Education.pptx
How to Make a Pirate ship Primary Education.pptxHow to Make a Pirate ship Primary Education.pptx
How to Make a Pirate ship Primary Education.pptxmanuelaromero2013
 
Mastering the Unannounced Regulatory Inspection
Mastering the Unannounced Regulatory InspectionMastering the Unannounced Regulatory Inspection
Mastering the Unannounced Regulatory InspectionSafetyChain Software
 
Crayon Activity Handout For the Crayon A
Crayon Activity Handout For the Crayon ACrayon Activity Handout For the Crayon A
Crayon Activity Handout For the Crayon AUnboundStockton
 
“Oh GOSH! Reflecting on Hackteria's Collaborative Practices in a Global Do-It...
“Oh GOSH! Reflecting on Hackteria's Collaborative Practices in a Global Do-It...“Oh GOSH! Reflecting on Hackteria's Collaborative Practices in a Global Do-It...
“Oh GOSH! Reflecting on Hackteria's Collaborative Practices in a Global Do-It...Marc Dusseiller Dusjagr
 
Kisan Call Centre - To harness potential of ICT in Agriculture by answer farm...
Kisan Call Centre - To harness potential of ICT in Agriculture by answer farm...Kisan Call Centre - To harness potential of ICT in Agriculture by answer farm...
Kisan Call Centre - To harness potential of ICT in Agriculture by answer farm...Krashi Coaching
 
Call Girls in Dwarka Mor Delhi Contact Us 9654467111
Call Girls in Dwarka Mor Delhi Contact Us 9654467111Call Girls in Dwarka Mor Delhi Contact Us 9654467111
Call Girls in Dwarka Mor Delhi Contact Us 9654467111Sapana Sha
 
POINT- BIOCHEMISTRY SEM 2 ENZYMES UNIT 5.pptx
POINT- BIOCHEMISTRY SEM 2 ENZYMES UNIT 5.pptxPOINT- BIOCHEMISTRY SEM 2 ENZYMES UNIT 5.pptx
POINT- BIOCHEMISTRY SEM 2 ENZYMES UNIT 5.pptxSayali Powar
 
Solving Puzzles Benefits Everyone (English).pptx
Solving Puzzles Benefits Everyone (English).pptxSolving Puzzles Benefits Everyone (English).pptx
Solving Puzzles Benefits Everyone (English).pptxOH TEIK BIN
 
Organic Name Reactions for the students and aspirants of Chemistry12th.pptx
Organic Name Reactions  for the students and aspirants of Chemistry12th.pptxOrganic Name Reactions  for the students and aspirants of Chemistry12th.pptx
Organic Name Reactions for the students and aspirants of Chemistry12th.pptxVS Mahajan Coaching Centre
 

Recently uploaded (20)

_Math 4-Q4 Week 5.pptx Steps in Collecting Data
_Math 4-Q4 Week 5.pptx Steps in Collecting Data_Math 4-Q4 Week 5.pptx Steps in Collecting Data
_Math 4-Q4 Week 5.pptx Steps in Collecting Data
 
Alper Gobel In Media Res Media Component
Alper Gobel In Media Res Media ComponentAlper Gobel In Media Res Media Component
Alper Gobel In Media Res Media Component
 
Science 7 - LAND and SEA BREEZE and its Characteristics
Science 7 - LAND and SEA BREEZE and its CharacteristicsScience 7 - LAND and SEA BREEZE and its Characteristics
Science 7 - LAND and SEA BREEZE and its Characteristics
 
MENTAL STATUS EXAMINATION format.docx
MENTAL     STATUS EXAMINATION format.docxMENTAL     STATUS EXAMINATION format.docx
MENTAL STATUS EXAMINATION format.docx
 
Class 11 Legal Studies Ch-1 Concept of State .pdf
Class 11 Legal Studies Ch-1 Concept of State .pdfClass 11 Legal Studies Ch-1 Concept of State .pdf
Class 11 Legal Studies Ch-1 Concept of State .pdf
 
Paris 2024 Olympic Geographies - an activity
Paris 2024 Olympic Geographies - an activityParis 2024 Olympic Geographies - an activity
Paris 2024 Olympic Geographies - an activity
 
BASLIQ CURRENT LOOKBOOK LOOKBOOK(1) (1).pdf
BASLIQ CURRENT LOOKBOOK  LOOKBOOK(1) (1).pdfBASLIQ CURRENT LOOKBOOK  LOOKBOOK(1) (1).pdf
BASLIQ CURRENT LOOKBOOK LOOKBOOK(1) (1).pdf
 
How to Configure Email Server in Odoo 17
How to Configure Email Server in Odoo 17How to Configure Email Server in Odoo 17
How to Configure Email Server in Odoo 17
 
Presiding Officer Training module 2024 lok sabha elections
Presiding Officer Training module 2024 lok sabha electionsPresiding Officer Training module 2024 lok sabha elections
Presiding Officer Training module 2024 lok sabha elections
 
Accessible design: Minimum effort, maximum impact
Accessible design: Minimum effort, maximum impactAccessible design: Minimum effort, maximum impact
Accessible design: Minimum effort, maximum impact
 
18-04-UA_REPORT_MEDIALITERAСY_INDEX-DM_23-1-final-eng.pdf
18-04-UA_REPORT_MEDIALITERAСY_INDEX-DM_23-1-final-eng.pdf18-04-UA_REPORT_MEDIALITERAСY_INDEX-DM_23-1-final-eng.pdf
18-04-UA_REPORT_MEDIALITERAСY_INDEX-DM_23-1-final-eng.pdf
 
How to Make a Pirate ship Primary Education.pptx
How to Make a Pirate ship Primary Education.pptxHow to Make a Pirate ship Primary Education.pptx
How to Make a Pirate ship Primary Education.pptx
 
Mastering the Unannounced Regulatory Inspection
Mastering the Unannounced Regulatory InspectionMastering the Unannounced Regulatory Inspection
Mastering the Unannounced Regulatory Inspection
 
Crayon Activity Handout For the Crayon A
Crayon Activity Handout For the Crayon ACrayon Activity Handout For the Crayon A
Crayon Activity Handout For the Crayon A
 
“Oh GOSH! Reflecting on Hackteria's Collaborative Practices in a Global Do-It...
“Oh GOSH! Reflecting on Hackteria's Collaborative Practices in a Global Do-It...“Oh GOSH! Reflecting on Hackteria's Collaborative Practices in a Global Do-It...
“Oh GOSH! Reflecting on Hackteria's Collaborative Practices in a Global Do-It...
 
Kisan Call Centre - To harness potential of ICT in Agriculture by answer farm...
Kisan Call Centre - To harness potential of ICT in Agriculture by answer farm...Kisan Call Centre - To harness potential of ICT in Agriculture by answer farm...
Kisan Call Centre - To harness potential of ICT in Agriculture by answer farm...
 
Call Girls in Dwarka Mor Delhi Contact Us 9654467111
Call Girls in Dwarka Mor Delhi Contact Us 9654467111Call Girls in Dwarka Mor Delhi Contact Us 9654467111
Call Girls in Dwarka Mor Delhi Contact Us 9654467111
 
POINT- BIOCHEMISTRY SEM 2 ENZYMES UNIT 5.pptx
POINT- BIOCHEMISTRY SEM 2 ENZYMES UNIT 5.pptxPOINT- BIOCHEMISTRY SEM 2 ENZYMES UNIT 5.pptx
POINT- BIOCHEMISTRY SEM 2 ENZYMES UNIT 5.pptx
 
Solving Puzzles Benefits Everyone (English).pptx
Solving Puzzles Benefits Everyone (English).pptxSolving Puzzles Benefits Everyone (English).pptx
Solving Puzzles Benefits Everyone (English).pptx
 
Organic Name Reactions for the students and aspirants of Chemistry12th.pptx
Organic Name Reactions  for the students and aspirants of Chemistry12th.pptxOrganic Name Reactions  for the students and aspirants of Chemistry12th.pptx
Organic Name Reactions for the students and aspirants of Chemistry12th.pptx
 

TemplateP 10-04NameSectionEnter the appropriate amount or item i.docx

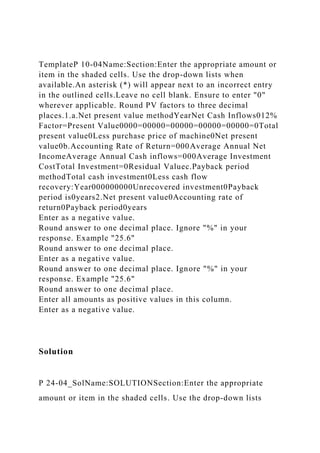
  • 1. TemplateP 10-04Name:Section:Enter the appropriate amount or item in the shaded cells. Use the drop-down lists when available.An asterisk (*) will appear next to an incorrect entry in the outlined cells.Leave no cell blank. Ensure to enter "0" wherever applicable. Round PV factors to three decimal places.1.a.Net present value methodYearNet Cash Inflows012% Factor=Present Value0000=00000=00000=00000=00000=0Total present value0Less purchase price of machine0Net present value0b.Accounting Rate of Return=000Average Annual Net IncomeAverage Annual Cash inflows=000Average Investment CostTotal Investment=0Residual Valuec.Payback period methodTotal cash investment0Less cash flow recovery:Year000000000Unrecovered investment0Payback period is0years2.Net present value0Accounting rate of return0Payback period0years Enter as a negative value. Round answer to one decimal place. Ignore "%" in your response. Example "25.6" Round answer to one decimal place. Enter as a negative value. Round answer to one decimal place. Ignore "%" in your response. Example "25.6" Round answer to one decimal place. Enter all amounts as positive values in this column. Enter as a negative value. Solution P 24-04_SolName:SOLUTIONSection:Enter the appropriate amount or item in the shaded cells. Use the drop-down lists
  • 2. when available.An asterisk (*) will appear next to an incorrect entry in the outlined cells.Leave no cell blank. Ensure to enter "0" wherever applicable. Round PV factors to three decimal places.1.a.Net present value methodYearNet Cash Inflowsx12% Factor=Present Value1$ 75,000x0.893=$ 66,975270,000x0.797=55,790365,000x0.712=46,280460,000x0. 636=38,160425,000x0.636=15,900Total present value$ 223,105Less purchase price of machine250,000Net present value$ (26,895)b.Accounting Rate of Return=Average Annual Net Income/Average Investment CostAverage Annual Net IncomeAverage Annual Cash inflows=$ 11,250/$ 137,500Average Investment CostTotal Investment=8.2%Residual Valuec.Payback period methodTotal cash investment$ 250,000Less cash flow recovery:Year1$ 75,000270,000365,000440,000(250,000)Unrecovered investment0Payback period is3.7years2.Net present value$ (26,895)Accounting rate of return8.2%Payback period3.7years Round answer to one decimal place. Ignore "%" in your response. Example "25.6" Enter as a negative value. Round answer to one decimal place. Enter as a negative value. Round answer to one decimal place. Ignore "%" in your response. Example "25.6" Round answer to one decimal place.
  • 3. Enter all amounts as positive values in this column. Enter as a negative value. Schroeder, R. G., Goldstein, S. M., & Rungusanatham, M. J. (2013). Operations management in the supply chain: Decisions and cases (6th ed.). New York, NY: McGraw-Hill/Irwin. If the products sell extremely well, we will build more in season, and will be back on the shelves in a few weeks. And we'll build even more, and even more, and even more, in that same season. We're not going to wait with a hot new product until next year, when hope- fully the same trend is alive. -Ronald Snyder, CEO of Crocs, lnc. 1 On May 3, 2007, Crocs, Inc. released its results for the first quarter of the year. The footwear company, which had sold its first shoes in 2003, reported reve- nues of $142 million for the quarter, more than three times its sales for the first quarter of 2006. Net in- come, at $0.61 per share was more than 17 percent
  • 4. of sales, nearly four times higher than the previous year. 2 These results far exceeded market expecta- tions, which had been for earnings of $0.49 per share on $114 million of revenue. 3 As part of the earnings release, the company announced a two-for-one stock split. Immediately after the announcement, the stock price jumped 15 percent. The growth and profitability of Crocs, which made funky, brightly colored shoes using an extremely com- fortable plastic material, had been astounding. Much of this growth had been made possible by a highly flexible supply chain which enabled the company to build additional product to fulfill new orders quickly within the selling season, allowing it to respond to un- expectedly high demand-a capability that was previ- ously unheard of in the footwear industry. This ability to fulfill the needs of retailers also made the company a very popular supplier to shoe sellers. This success also raised questions about how the company should grow in the future. Should it vertically integrate or grow through product line 1 Quotations are from interviews w ith the authors, unless oth-
  • 5. erwise specified. 2 Press Release, "Crocs, Inc. Reports Fiscal 2007 First Quarter Financial Results," May 3, 2007. Online at http://www.crocs. com/consumer/press_details/688244 (accessed May 4, 2007). 3 Rick Munarriz, "Ugly Shoes, Pretty Profits," The Motley Fool, May 4, 2007. Online at http://www.fool.com/investing/high- g rowth/2007 /05/04/ug ly-shoes-pretty-profits.aspx (accessed May 7, 2007). extension? Should it grow organically or through ac- quisition? Would potential growth paths exploit Crocs' core competencies or defocus them? CROCS, INC. In 2002, three friends from Boulder, Colorado went sailing in the Caribbean. One brought a pair of foam clog shoes that he had bought from a company in Canada. The clogs were made from a special mate- rial that did not slip on wet boat decks, was easy to wash, prevented odor, and was extremely com- fortable. The three, Lyndon "Duke" Hanson, Scott Seamans, and George Boedecker, decided to start a business selling these Canadian shoes to sailing en- thusiasts out of a leased warehouse in Florida, as
  • 6. Hanson said, "so we could work when we went on sailing trips there." 4 The founders wanted to name the shoes something that captured the amphibious nature ofthe product. Since "Alligator" ha.d already been taken, they chose to name the shoes "Crocs." The shoes were an immediate success, and word of mouth expanded the customer base to a wide range of people who spent much of their days stand- ing, such as doctors and gardeners. In October 2003, as the business began to grow, they contacted Ronald Snyder, a college friend, to become a consultant for the company. Snyder had been an executive with Flextronics, a leading electronics contract manufac- turer, heading up the company's design division. He had extensive experience in manufacturing opera- tions, mergers and acquisitions, and sales and mar- keting. When he first started consulting with Crocs, Snyder said, "I thought I would work a few hours a day. I thought it would be restful." 5 But seeing the rapid growth of the company based on word-of- mouth marketing, Snyder joined Crocs in June 2004 as its president, becoming CEO in January 2005. When Snyder joined the company it was head-
  • 7. quartered in Colorado, but essentially distributing shoes made by the Canadian manufacturer Finpro- ject NA. One of Snyder's first moves was to purchase 4 Diane Anderson, "When Crocs Attack," Business 2.0, November 1, 2006. 5 1 bid. David Hoyt and Amanda Silverman prepared this case under the supervision of Michae l Marks, Professors Chuck Holloway and Hau Lee as the basis for class discussion rather than to illustrate either effective or ineffective handling of an adminis- trative situation. Copyright© 2007 by the Board of Trustees of the Leland Stanford Junior University. All rights reserved. No part of this publication may be reproduced, stored in a retrieval system, used in a spreadsheet, or transmitted in any form or by any means-electronic, mechanical, photocopying, recording, or otherwise-without the permission of the Stanford Graduate School of Business. Reprinted with permission. 492
  • 8. Crocs: Revolutionizing an Industry's Supply Chain Model for Competitive Advantage 493 Finproject, which was renamed "Foam Designs ." Crocs now owned the formula for the proprietary resin "croslite™" that gave the shoes their unique properties of extreme comfort and odor resistance. The company now also controlled manufacturing. EXHIBIT 1 Crocs executives and directors. Snyder encouraged the company to think big. He brought in a number of key executives from Flex- tronics, and built infrastructure in preparation for growth. (See Exhibit 1 for Crocs executives and direc- tors.) He also launched the product worldwide. Executive Background Ronald Snyder, President, CEO, Director Peter Case, SVP, Finance, CFO, Treasure John McCarvel, SVP, Global Operations
  • 9. Michael Margol is, VP, Sales and Marketing . Director Raymond Croghan Ronald Frasch Michael Marks Marie Holman-Rao Richard Sharp, Chairman Thomas Smach Ronald Snyder With Cross since June 2004 (consultant since October 2003). Senior executive with Flextronics. Founder of The Di i Group, w hich was acqu ired by Flextronics. With Crocs since April 2006. Previously EVP, CFO, and treasurer of publicity held sports apparel and
  • 10. accessor ies company. With Crocs since January 2005 (consultant beginning in 2004). Previously an executive w ith Flextronics and The Dii Group. With Crocs since January 2005. Led Crocs sales group as a consultant beginning in October 2003. Previously, founder and executive with an apparel and merchandising compan y. Background Board member since August 2004. Prior to retirement in 1999, ran a healthcare information technology consulting firm. Also on the board of several privately- held compan ies. Board member since 2006. Vice Chairman of Saks Fifth Avenue. Background in global retailing. Board member since August 2004. Member of Kohlberg Kravis Roberts & Co., a private equity firm, as a member of the firm since January 1, 2006 . Chairman of Flectronics. Previously, he was wi th Flextronics from
  • 11. 1991-2005, serving as CEO and chairman. Also a director of SanDisk Corporation and Schlumberger Limited. Board member since 2006. Background in the apparel business, including Limited Brands, Inc., Gap, Inc., Banana Republic, and Ann Taylor. Board cha irman since April 2005. With Circuit City from 1982 to 2002, serving as president, CEO, and chairman. Also a board member of Flextron ics (formerly chair). And of Carmax, Inc., the nation's largest specialty retailer of used cars and light trucks. Boa rd member since Apri l 2005. With Flextronics since 2000, as CFO, and SVP of finance. Previously SVP, CFO and treasure of The Dii Group, Inc., which was acquired by Flextronics. Also serves on the board of ADVA AG Optical Networking. President of Crocs. See background above under Executives. Sources: Crocs w ebsite, "Board and Management Profiles," http://www.crocs.com/ company/ ln vestor_Relations/Board_Management.jsp
  • 12. (April 23, 2007}, Crocs Proxy, October 2006. 494 Part Six Case Studies Snyder explained the rationale behind launching worldwide at an early point in the company's life: The plan was, we're going to launch the world in order to get a brand out that would be a sustain- able brand with th is funky looking, strange product. Other, larger shoe companies, or even larger apparel companies, could have knocked us off, and could have gone into Europe before we got there if they had infrastructure in Europe. So, being Flextronics guys, and understanding that the world is flat, and you can get every- where fairly quickly, we said, "we need to launch the world pretty much at once." We delayed a bit in South America, but now we're there fairly strong, too. But we needed to launch every- where in order to have us be the brand that had sustainability. That's what we've been able to
  • 13. pull off at this point. We were in every country you can think of before anybody else had any real capability to ship product in other countries besides the U.S. Certainly, there are knock-offs in all those other places, but they are just known as knock-offs. They are not known as originals, which is what we were hoping to achieve. Crocs started its sales efforts on a grass-roots basis in the U.S. The company participated in many trade shows in every industry that could benefit from the product, such as garden shows, boat shows, and pool supply shows . As stores began carrying the shoes, Crocs personnel worked closely with the stores. Snyder observed, "If you just put up a rack of funny-looking shoes, I don't think they would have done anything. But we got in there with some of our own people, or our reps, and stood around and got people excited." Crocs also went to a wide range of events, such as con- certs, festivals, and sports tournaments, to talk to cus- tomers about the shoes. The company took a similar approach in other countries, but the momentum gen- erated in the U.S. helped foreign adoption. The company initially used representatives and
  • 14. distributors in the U.S., but brought this function in- house in order to control costs. In other countries, Crocs had its own sales staff wherever possible, but as of mid-2007 had some 3rd party distributors in some locations. In addition to a popular product and a global strategy, Crocs developed a supply chain that pro- vided a competitive advantage. Traditional industry practice was for retail distributors to place bulk or- ders for each season's inventory many months in ad- vance, with little ability to adjust to changes during the selling season. The Crocs model did not impose these limitations on retailers-the company could fill new orders within the season, quickly manufac- turing and shipping new product to retail stores. The traditional practice, and the Crocs supply chain will be described in detail below. From 2003 through 2006 the company had phenomenal growth. Revenue in 2003 had been $1.2 million . By 2006, it was $355 million, with a net income· of $64 million (18 percent of revemk). Crocs went public in February 2006, with an initial market
  • 15. capitalization of over $1 billion. After the Q1 2007 earnings release, the market cap passed $2.7 billion. Sales outside of North America grew from 5 percent of total revenue in 2005 to 25 percent in 2006. In its Q1 2007 earnings release, the company said that it expected 2007 revenue to be between $670 and $680 million. (The company had historically reported results that comfortably exceeded expectations. 6 ) (See Exhibits 2 and 3 for company financial informa- tion .) Crocs' financial performance was far superior in many respects to others in the footwear industry (Exhibit 4). The Crocs Shoe The original Crocs shoe was a clog design. Visually, its two most distinctive features were large ventila- tion holes and bold colors. The key to the shoe, how- ever, was the croslit~ material. This proprietary closed-cell foam material molded to the shape of the wearer's foot, providing an exceptionally com- fortable shoe. It was extremely light, did not skid, was odor resistant, and did not mark surfaces. It could also be washed with water. Croslite could be produced in any color, and the company chose bold colors (described by some as "crayon" colors) which
  • 16. further enhanced the distinctive, funky look. Crocs shoes generally sold for about $30-which was not marked down, as retailers found they did not need to unload excess inventory through clearance sales at the end of a selling season. As Crocs grew, it added additional shoe designs. The two original models, Beach and Cayman, ac- counted for about 62 percent of footwear sales in 2006.7 These two models also formed the basis of some of the other Crocs models. By April 2007, the company had a wide range of shoes and other prod- ucts . Its website showed 31 basic footwear models, ranging from sandals to children's rain boots to shoes designed for professionals, such as nurses, who had to stand all day. Some of its shoes were made under a license agreement with Disney, and incorporated Disney characters. In addition, Crocs offered four models of shoes (CrocsRX) that were 6 Munarriz, loc. cit. 7 Crocs Form 1 OK for 2006, pp. 15-16.
  • 17. Crocs: Revolutionizing an Industry's Supply Chain Model for Competitive Advantage 495 EXHIBIT 2 Crocs' financial performance through 2006. All amounts in $ millions, except as noted. 2006 2005 2004 2003 2002 Revenue 354.7 108.6 13 .5 1.2 0.0 Cost of goods sold 154.2 47.8 7.2 0.9 0.0 Gross profit 200.6 60.8 6.4 0.3 0.0 Gross profit margin 56.5% 56.0% 47 0% 23.3% 33.3% SG&A expense 97.2 30.6 7.2 1.4 0.5 Depreciation & amortization 8 .1 3.3 0.7 0.1 0.0 Operating income 95.3 26.9 (1 6) (1 .2) (0.4) Operating margin 26.9% 24.8% Net income after taxes 64.4 17.0 (1 .5) (1.2) (0.4) Net profit margin 18.2% 15.6% Geographic distribution of revenue(% of total)
  • 18. North America 265.5 (75%) 102.8 (95%) 135 (100%) Asia 54.4 (15%) 4.7 (4%) Europe 30.3 (9%) 1.0 (1%) All Other 4.6 (1%) 0.1 Shoes as percent of total revenue 96% 94% 81% Selected Balance Sheet Items (Calendar year end, all values in $ millions) 2006 2005 2004 2003 Cash 71.2 37.8 6.9 0.5 Net receivables 69.3 20.0 3.3 0.2 Inventories 86.2 28.5 2.4 0.4 Net fixed assets 34.8 14.8 3.7 0.3 Accounts payable 71.2 37.8 6.9 0.5 Short-term debt 0.5 8.5 1.0 Long-term debt 0.1 3.2 1.4 Sources: Hoovers. Product and geographic distribution of revenue from Crocs Form 1 OK for 2006, pp. F-27, 28. EXHIBIT 3 Financial results, Q1 2007.
  • 19. The following results were released May 3, 2007, for the quarter ended March 31, 2007 (dollar values in millions, except as otherwise stated): Q1 2007 Q1 2006 % Change Revenues 142.0 44.8 317% Gross profit 84.4 23.7 356% Gross profit(% of sales) 59.4% 52.9% SG&A expenses 47.3 137 345% Net income, after tax 24.9 6.4 389% Net income(% of sales) 17.5% 14.3% Net income per share, diluted $0.61 $0.17 359% Source: Crocs Press Release, May 3, 2007, loc. cit. 496 Part Six Case Studies EXHIBIT 4 Industry comparisons. Comparisons of Crocs with companies selected as "best of group" and industry median.
  • 20. Deckers Industry Median Crocs Outdoor Nike Timberland Annual sales ($ million) 355 304 14,9 55 1,568 Market capita lization ($ million) 2,102 897 10,06 5 1,306 Profitability Gross profit margin 56.5% 46.4% Pre-tax profit margin 27.2% 17.8% Net profit margi n 18.2% 10.4% Return on equity 56.7% 16.1% Return on assets 34.1% 13.7% Return on invested capital 51.1% 15. 9% Operations Inve ntory turnover 3.5 5.0 Receivables turn over 8.0 6.0 Valuation Price/Sales ratio 5.9 3.0 Price/Earnings ratio 30.4 28.3 Price/C ash fl ow ratio 170.3 18.5 Growth
  • 21. 12 month revenue growth 227% 15% 12 month net income growth 280% (1.0%) 12 month EPS growth 239% (2.3%) 43.7% . 13 .1% 8.7% 21.6% 14.4% 18.4% 4.3 6.5 1.3 20.0 14.1 8.8% 0.4% 2.9% < 47.3% 10.4%
  • 22. 6.8% 19.5 % 13 .0% 19.0 % 4.7 7.4 0.8 15.3 11.7 0.1% (35.3%) (3 1.5 %) 24.5% 3.2% 2.7 % 15.5 % 3.4% 4.7%
  • 23. 5.6 6.6 0.8 20.1 10.6 7.5% 53.2% 50 .0% Source: Hoovers Online Competitive Landscape (April 27, 2007). Crocs growth numbers are for cale ndar years 2005 and 2006. Crocs in ventory turns from Crocs. designed to meet the special needs of those with medical problems that affected the feet, such as dia- betes. The company offered 17 models of collegiate models that were made in school colors, with the school logos . Universities such as USC, UCLA, Notre Dame, Cal, and Ohio State participated in the pro- gram. (By the start of the 2007/8 academic year, Crocs expected to include many other institutions in its catalog of university logo shoes.) Crocs sponsored
  • 24. the AVO beach volleyball tour, and offered two models with the AVP logo .8 (See Exhibit 5 for photos of selected Crocs products.) While shoes comprised 96 percent of company revenues in 2006. 9 Crocs also branched out into other accessory products, such as caps, shirts, shorts, hats, socks, and backpacks. It had products such as kneepads and kneelers that utilized croslite to pro- vide functionality. It also sold decorative inserts that could be put into the shoe ventilation holes, origi- nally made by a family-owned company (Jibbitz) that Crocs purchased in December 2006. 8 Product links from Crocs home page: http://www.crocs.com/ home .jsp (Accessed April 24, 2007) . 9 Crocs Form 10K for 2006, p. F-27 . Crocs made other acquisitions in 2006 and earl y 2007 in the sports protection equipment and ap- parel market, and in action footwear. These acquisi - tions further broadened the company's product line, and introduced products that incorporated conven- tional materials such as leather. (See Exhibit 6 for a list of Crocs acquisitions.)
  • 25. Producing a Crocs Shoe The ra w materials for the croslite in Crocs shoes are relatively inexpensive chemicals purchased in pellet form from suppliers such as Dow Chemical. These chemicals are then combined in a process called "compounding," in w hich they are converted into a slurry, mixed, and then reformed into new pellets . As part of the compounding process, color dyes are added. The compounded pellets are then ready to be molded into croslite products. Croslite components for Crocs products are made by injection molding. This requires an injection molding machine, and molds for each style and size. After the parts are molded, they must be assembled. This might involve gluing croslite parts together, or stitching, in the case of components made of leather, canvas, or other materials which had been added to Crocs : Revolutionizing an Industr y's Supply C hain Model for Compe ti tive Advantage 497
  • 26. - BIT 5 Selected Crocs products. ~ ~ ~ beach cayman disney beach Beach was the company's most Beach and Cayman were the first two Disney beach was a version of po pular model. Beach and Cayman Crocs products, and formed the basis the Beach model produced ac counted for 62 percent of 2006 for some other shoe models. under license from Disney. shoe sales. ~ ~TM ~ 1-professional jibbitz kneepads Professional was intended for Jibbitz were used to customize Crocs Crocs produced items such as people such as nurses who spent shoes by filling the ventilation kneepads that took advantage all day working on their feet. holes in the shoes. of the properties of croslite. ~
  • 27. ~ ti ~ crocs 1" wristband cloud block letter t-shirt Crocs offered branded accessories Cloud was designed to meet the Crocs offered a range of shirts such as wristbands, caps, and socks. special needs of diabetic patients. and shorts. 5ource: Crocs w ebsite (www. crocs.com, accessed Apr il 23, 2007). Images © Crocs, Inc. , reprinted w ith perm ission . EXHI BIT 6 Crocs acquisitions, 2004-2006. Acquisition, Date Acquired, Purshase Price2 Foam Des igns (fo rmerly Finproject NA) June 2004 Fury (formerly 55 Hockey Products) October 2006 1 EXO ltalia October 2006 1 Jibb itz
  • 28. December 2006 $13.5 mill ion Ocean Minded, LLC January 2007 Notes $1 .75 mill ion plus potential earn -out of up to $3.75 million. 1. The aggregate purchase price for Fury and EXO ltalia was $9.6 million . 2. Purcha se prices include acquisition-related costs. Description Original man ufacturer of Crocs products and owner of crosl ite intellectual property. Manufacturer of hockey and lacrosse products. Crocs developing protection gear based on croslite , w hich offers low w eight, ene rgy absorption, and mi crob ial resistance.
  • 29. Designer of ethylene vinyl acetate (EVA) products, primarily for the f ootw ear industry. Family ow ned company specializing in colorful snap-on products designed as accessories for Crocs footw ear. Designer and manufacturer of high quality leather and EVA ba sed sanda ls for the beach, adventure, and action sports markets. Uses recycled and recyclable material s w henever poss ible. Products target young men and w omen w ho w ant high qua lity fashion sandals w ith an emphasi s on style and comfort. Source : Crocs Form 10K for the year ending December 31,2006, pp. F-11, F-1 2, F-30. 498 Part Six Case Studies the Crocs product line in late 2006 and early 2007. The finished products are then tagged and placed in boxes containing 24 pairs of shoes for distribution to retailers. Standard industry practice -was for each
  • 30. pack of 24 to contain only one style and color. Crocs, however, would custom configure 24-packs to meet the needs of its smaller customers. CROCS REVO LUTIONIZES THE FOOTWEAR SU PPLY CHAIN The footwear industry was oriented around two seasons-spring and fall. The standard practice was fo r footwear companies preparing for the upcoming fall season to take their products to shows around the world in January. Buyers would book orders for fall delivery following these shows ("pre-books"). The fall orders that were received at the begin- ning of the year would be planned for delivery in August, September, October, and November. These scheduled shipments would drive the production plan . The manufacturers would add some excess to the build, typ ically about 20 percent of the pre- booked orders, to take advantage of potential ad- ditional orders . A very aggressive compan y might add 50 percent to the build, but all the product would be manufactured before the season began . Most shoes were produced in Asia (primarily China and Vietnam), with some manufactu red in South
  • 31. America. This production and supply model had obvious limitations. Retailers had to estimate what their cus- tomers would want well in advance of the selling season. If they underestimated, they w ould have empty shelves and forego potential sales. If they overestimated , they would be stuck w ith unsold stock at the end of the season and be f orced to have clearance sales in order to get rid of this excess stock at discounted prices . Making this even more difficult was the consideration that fashion was subject to trends that were difficult to predict-history was of only limited value, particula r ly w ith new product s that incorporated novel design elements that might either become wildly popular or fall flat. The Cro cs Supply Chain Crocs looked at the supply chain from a ve ry differ- ent perspective than traditional shoe companies. Coming f rom their electronics contract manufactur- ing backgrounds, Snyde r and ot her key Crocs execu- tives were accustomed to producing what the customer needed, when it was needed, and respond- ing rapidly to changes in demand. They decided to
  • 32. develop a model focused on customer needs-when a custome r needed more product, they would get it. Snyder described the new model as follows, "If th e products sell extremely well, we will build more in season, and will be back on the shelves in a fe w weeks. And we'll build even more, and even more, and even more, in that same season . We're not go- ing to w ait with a hot new product until next year, when hopeful ly the same trend is alive." · Under the Crocs model, retailers would not need to take a big risk in January by placing large orders for their fall season-they could place smaller pre-booked orders, and order more whe n they saw how w ell the products sold . Traditiona lly, customers had to guess which pr oducts would be hot, and could not get mo re of a product that was in higher demand than they had guessed (and take the risk of end-of-season sales to unload excess in - ventory at reduced prices) . Crocs wanted customers to be able to get more of a product during the sea- son in order to take advantage of unexpectedly high demand. To do that, Crocs would have to be able to make the products during the season, and ship them to customers quickly. One analyst re-
  • 33. marked, "They've surprised everybody. Their re- plenishment system is unheard-of in the retail footwear space." 10 The positive• relationship that Crocs developed with its retailers resulted in additional benefits. As Crocs became important to big retailers, they ap- proached Crocs to suggest increasing the Crocs pres- ence . Snyder described one large retailer who said: "Bring us new products, bring us apparel, accesso- ries, T shirts, socks, hats, Jibbitz, and we'll give you a whole area that will be dedicated to the current Crocs offerings and any new stuff you come out w ith." Snyde r observed, "Once you have retail space, it's pretty valuable." Developi ng the Crocs Supply Chain Phase One: Taking over Production As mentioned earlier, one of Snyder's first moves was buying the manufacturer of Crocs shoes (Foam Designs) in June 2004 so that it could own the propr ietary croslite resin and control manufactu r ing. At that point, Crocs purchased the raw material pellets from a variety of companies in Europe and the
  • 34. United States, and shipped them to a third-party compounding company in Italy. The Italian com- pany had been the parent of Foam Designs, and had previously done the compounding, so continu- ing to use them for this function avoided supply chain interruptions. 10 Jim Duffy of Thomas W eisel Partners, quoted in Anderson, loc. cit. Crocs: Revo lutionizing an Industry's Supply Chain Model for Competitive Advantage 499 -e co mpounded, colorized pellets were then back to Foam Designs in Canada, where shoes _ =mo lded and assembled. The finished products = : h en shipped to a third-party distribution --::>any in Denver that warehoused the shoes, and - -~ged and shipped them to customers. -;.:e Tw o: Global Production Using Contract
  • 35. .:- 'acturers Crocs started production in China in 2005, using a large contract manufacturer. The materials were still being sent to Italy for com- =- di ng, but the compounded pellets were now =-=~a both Canada and China. The shoes that were .::::e in China were shipped to the Denver ware- =~e f or packaging orders and distribution . o cs began to enter the Asian and European -=r ets in the spring of 2005. As described earlier, '€ co mpany's strategy was to launch worldwide, so - ::rou ght on manufacturing capacity to support this =:::> oach. It added capacity through contract manu - :~urers in Florida, Mexico, and Italy (due to the lo- ...::. presence of the compounding company). oming from the contract manufacturing business, ::-. d er and his team expected that the benefits of =-- r act manufacturing they had experienced in the · ronics industry would also be present in this new = iness . Electronics contract manufacturers in all
  • 36. --rts of the world were highly responsive to customer :::=mands, and quick to increase or stop production as _ ui red. They soon found that this was not the case · f ootwear manufacturing. Snyder explained: W e realized very quickly that third party [manu- f acturers] with our new model weren't going to w ork [outside of Asia]. Third parties in Asia are absolutely great. They are very flexible. They can b e both flexible and high volume . They move very quickly. They [contract manufacturers] take ri sks with us, where they buy equipment. They invest in helping us grow the business. No [third party manufacturers in] other countries were w illing to even entertain that. We'd have to give t hem long term forecasts, long term contracts, w e'd have to sign away the next few kids . Noth- ing was good about using contractors in any other part of the world, to be honest .... [Third party manufacturers outside of Asia] w ould want to know what we're shipping four months from now, not next week. We were tell- ing them, "no, we actually need you to change
  • 37. to morrow, and start shipping different stuff next week, if that's what's required, since that's o ur model." [And they said,] "Oh no, no, we can't do that!" Phase Three: Bringing the Global Supply Chain In-House When Snyder realized that contractor manufacturers outside of Asia would not be able to adopt the com- pany's supply chain model, he developed company- owned manufacturing operations in Mexico, and Italy. Crocs set up a manufacturing operation in Brazil that was scheduled to open by the end of June 2007. It w as also exploring potential manufacturing sites in India, and expected to start production there by the end of the year. Crocs had used a contract manufacturer in Romania to serve European customers, and considered sev- eral options to replace the contractor, including: buying the contractor, setting up a new facility in Romania, or looking elsewhere. They were ap- proached by a company in Bosnia that made shoes for Nike, and seemed to understand the Crocs model. The two companies agreed to an arrange- ment whereby Crocs owned the molding equipment
  • 38. and molds, using the contract company's personnel for labor. If this approach did not meet Crocs' re- quirements for flexibility and rapid response to de- mand, it would move to an entirely company-owned manufacturing facility. The Chinese contract manufacturer, who could meet Crocs' needs for flexibility and responsiveness, was maintained. (In 2006, 55 percent of Crocs' unit volume was produced in China 11 ) Crocs also kept the Florida contract manufacturer, who was only making one high volume product, and could ship with a Made in USA label, and continued to manufacture in Canada. While manufacturing in each geographic region added both capacity and the ability to respond to local customers, having the compounding done in Italy led to supply chain inefficiencies. Compounded material had to be sent from Italy to each produc- tion site, in the correct amounts and colors. This re- sulted not only in inefficient shipping of materials around the world, but also reduced manufacturing fle xibility in each location, since they could only pro- cess the colors that they had in stock. The raw mate-
  • 39. rials were inexpensive, so centralizing compounding did not result in significant savings through inven- tory consolidation . In 2006, Crocs took control of the compounding activity, creating state-of-the-art compounding fa- cilities in Canada, China, and Mexico. Crocs could now ship raw materials to each of these plants . The plants could compound material as need for production, delaying the colorizing decision until a 11 Crees Form 1 OK for 2006, p. 8. 500 Part Six Case Studies specific color product was needed. Snyder described the results: We can get an order now, and we don't even have to make the compound and colorize it yet, and we can ship it in two weeks. So now the model is starting to really take shape, where we don't have to take risks on even color compound
  • 40. at this point. Now we have that in place, which makes a huge difference. Moving compounding in-house also provided IP pro- tection for the croslite compound. Crocs also changed its warehousing model. The company had used a contract warehousing and dis- tribution firm in Colorado to handle all its ship- ments. All production came to the contractor's Colorado warehouse in bulk, where every shoe was removed and labeled, then warehoused. Customer orders were then filled from this central warehouse. This arrangement was inefficient, since bulk orders from large customers could have been shipped directly from the factory to the customers if ware- housing and distribution had been located near each factory. To address these problems, the company added warehousing operations to each factory, including labeling and other value added activities such as in- stalling hand tags and putting products into bags or boxes. For customers that ordered large quantities, such as Nordstrom, Dillard's, or Dick's Sporting
  • 41. Goods, the orders could be shipped directly from the Chinese warehouse. The Chinese warehouse was owned by one of the Crocs suppliers, but run by Crocs' personnel and Crocs' systems. Other w are- houses were owned by Crocs, or being transitioned to Crocs ownership (as in the case of Japan). The in- tent was for Crocs to control order fulfillment activi- ties in Asia. Crocs had a similar experience with warehousing contractors as it had with contract manufacturers. The company had tried using a number of third party warehousers, in the U.S. and elsewhere. Crocs found that these companies did a good job for a short time, but soon lost interest . As Snyder noted, "We don't lose interest in our own stuff," leading to the decision to have the company take control of warehousing. Additional Considerations and Benefits of the Crocs Supply Chain Model Small vs. Large Retail Customers Crocs' early sales were to small retailers. These stores were willing to take more risk than the large chains, and work with a new, rapidly growing supplier-particularly one
  • 42. that provided a high level of support and rapi d sr ;- ment of product. Small stores were willing to we~ with Crocs through problems such as stockouts a-:. shipment delays-large retailers generally im pose:. financial penalties for such problems. Crocs sa w.:.-= small retailers as important to building the bra -:. and providing a brand presence, even after th e r=- jority of sales went to large retailers . After Crocs' initial success in small stores, large ~=- tailers approached the company. Since the lar;;:= retailers had seen the market acceptance of ~= Crocs shoes, Crocs was in a much stronger neg otic-- ing position than it would have been earlier in -'""' development-it could negotiate favorable te r.-.- which did not include the financial penalties would previously have been required. By mid-2 about 75 percent of revenue came from large reta - ers, split approximately evenly between shoe st ore department stores, and sporting goods stores . 'f-.:; rest of the revenue came from a large number ::- small shops representing many different seg me-c~ such as gift shops, bicycle retailers, specialty fo od-=- tailers, health and beauty stores, surf shops, and ... -
  • 43. osks. These small shops ad :ounted for a much l a r~~ percentage of orders (although at much lower do1 :.- levels) than the large retailers, requiring a differe- approach to distribution. To meet the needs of small customers, prod~=- would be shipped to the company-owned w a ·=.- house in Colorado, where the orders were con~;;:- ured and shipped. Snyder explained the comp a approach to fulfilling orders for these custom ers- follows : We had to be able to service that customer baSE [small retailers], because it was a pretty big chunk of our business. Those guys could neve r take stuff direct from the factory. So, we fe lt ".E st ill needed to ha ve a warehouse for quick shi ments for the big guys and refills for the sm all independents that don't have the warehous in"' capabilities that the larger guys would have . A::. almost none of them have distribution cente rs of course-we ship direct to their shops. So, WE still need the Denver operation which ships about half of our product now.
  • 44. While these stores might send orders to Crocs- fax for small quantities to be delivered direct ly::: their stores, the large retailers had an entirely di ent fulfillment model. These companies had trE own distribution centers, and sent orders electro~- cally. Their orders were packed and shipped frc-:: the Crocs factories to the customers' distrib utT::- Crocs: Revolutionizing an Industry's Supply Chain Model for Competitive Advantage 501 =--:er. The customer would then ship it to the ap- - ri ate retail store . : == ing with Explosive Gro wth The Cr ocs suppl y ::.·n w as able to support the company's explos ive ~ _ ·lth, enabling the company to ride t he w ave of __ o mer enthusiasm for its products. For instance, er described a new flip-flop sandal that w as -~ d uced in 2006 . This w as Crocs ' first product in - .s segment, and the company did not know how
  • 45. ::. y w ould be purchased. Since it w as unique and =-:: emely comfortable, they decided to make :.= ,000 pairs-far more than they had pre-booked : ers for, and perhaps as many as any model selling at category in the world. :a rly in the selling season, there were ind ications -- ::. t he new flip-flop w as going to be even more :: ou lar than they expected, so Crocs made sure that -~ad excess injection molding machine capacity and - Id s available . It continued to get orders, and ::~ il d more product to meet the new orders . By the :=c-d of the season in September, they had shipped -ear ly 2.5 million pairs-more than 10 times what --ey w ould have shipped if they had operated under - -e tr adi t ional model of making all of a season's _ d uct ion prio r to the season based on pre-booked :· ers. he primary requirements for adding capacity er e having enough injection molding machines, ::. d having enough molds for the desired product.
  • 46. -·ocs purchased molding machines from t w o pri- ~a ry suppliers, who could init (ally de liver new ma - - ines in about three months . However, as the :~ppl iers observed Crocs' rap id growth, they man- ::.;ed to have new machines available soone r-by ori l 2007, the company could generally get them · hin si x weeks . Molds generally started to arrive in ut si x weeks, but it would be about th ree months :;efore Crocs would have a full set of all sizes . Cro cs would move equipment from one location an other to bette r meet its production needs. ol d ing machines were not t ransferred often , but en they we r e, the company tried to have ma - - in es from just one vendor at each site. Molds, - w ever, were frequently transferred betw een pro- :. ct io n locations. If they needed fast response to - eet a growing demand in the U.S., they might -ove p roduction to Mexico, which was closer to : e cust omers Y Fo r products with lots of pre-
  • 47. oo ked orders, a relatively dependable forecast, = I a sty le failed in the mar ketp lace (which had not yet -appene d as of April 2007), molds co uld be rew orked to -a e d iffe rent styles. and high volume, production might be shifted to China. As part of a licensing agreement with Disney, Crocs introduced a shoe with a Mickey Mouse head replacing a Crocs hole . The product was very popu- lar, and the company decided it needed production flexibility, so it moved molds to Mexico to meet U.S. demand. However, product destined for Asian cus- t omers was made in China, and product going to European customers was made in Europe . In order to be able to respond immediately to in- creases in demand, Crocs kept total manufacturing capacity at about 1 million pairs per month beyond the actual production plan . This capacity could be turned on at a moment's notice. The company also planned its infrastructure (both systems and people) slightly ahead of demand, so that it could respond
  • 48. quick ly. In marketing, it spent according to what it could afford-when sales went up, it increased mar- keting spending. Consequently, it had ad campaigns ready to go within a week if the business took off enough to support added spend ing . Shifting Production to Reduce Duty Payments The footwear industry was subject to considerable du- ties. For instance, the U.S. imposed duties on all of Crocs shoes coming from China, with tariffs ranging from 3 to 37 .5 percent depending on the materials in the shoe. Shoes that were entirely molded had a low tariff, while those which used leather or other mate- rials would have a high tariff. 13 On the other hand, under the North American Free Trade Agreement, Crocs paid no duty for products made in Mexico and shipped to the U.S. There were trade agreements between many countr ies that allowed duty-free shipments-for instance, there was no duty on Mex- ican shoes sold in Europe. The duty situation was considered from the early stages of new product development. The operations people would tell the designers what duty costs w ould be incurred based on the materials in the new
  • 49. product . They would also look at the processes needed to make the new product. This would be in- cluded in the product strategy. If a Ch inese-produced product had a high tariff, they would consider 13 The tariff classification w as extremel y difficult to determine. Crees submitted model s to the customs, authorities for a ruling . If they bel ieved that a product w as put into a category w ith too high a ta riff, t hey w ould appeal. To get a sense of the compli- cate d nature of the tariff classifications, see: United States In- ternational Trade Commission, " Harm oni zed Ta ri ff Schedule of th e United States (2007)(Rev. 1) Section XII, Chapter 64," http://hotdocs.us it c. gov/docs/tata/hts/bychapter/0701 c64.pdf (M ay 7, 2007). 502 Part Six Case Studies production in a low-tariff location. However, if the product required production processes that were
  • 50. not yet available in the low-tariff country, those pro- cesses might be developed as part of the new prod- uct plan. Crocs might also make a high-tariff shoe in China at the start, with a plan to reduce costs later by moving the production. The Canadian manufacturing operation was re- tained in part because of duty considerations. For instance, Canada and Israel had a duty-free relation- ship. Crocs shoes were extremely popular in Israel, having sold 1.2 million pairs in the country in 2006 . (The Canadian operation was also very helpful in selling within Canada, as the Made in Canada label provided an important marketing advantage .) New, More Complicated Products In 2007, Crocs was expanding its product lines beyond croslite molded shoes. In part due to its February 2007 acquisition of Ocean Minded, it was starting to make shoes with uppers made of leather and other conventional footwear materials, with croslite used for the shoe soles. This introduced additional complication into the production process. Leather and other materials were also more expensive than croslite.
  • 51. Even with a more complicated production pro- cess, Crocs intended to apply the same fast-response model it had brought from Flextronics and had opti- mized for molded shoes. Snyder commented: Now, it does become more complex-people could throw darts at this thing by saying "but they only make injection molded shoes, so they have an ad- vantage over other shoe manufacturers out there." Yes, we certainly did. But now we've got the same model going for more standard shoes, where it might have a croslite bottom, and it would have more standard uppers-it might have canvas, leather, suede, whatever. But we still are using the same model, where if something is popular, hot in the season, we are going to be able to make more. It may not be as much in the first year, as the extra 2 million we did of the sandal, but even the sandal was a difficult process. It wasn't just molding. It had gluing and everything involved. But the model is still there. We are not going to say "no" to a demand of a very popular new prod- uct. That's going to be our model going forw ard, and we still have a lot of room to get better in our
  • 52. flexible manufacturing sites. We are continuing to do things in Mexico and Canada and in Europe to make those even more flexible to be able to get stuff to the market faster than the 2, 4, 6 weeks, whatever it would take now depending on theca- pacity or the demand at a given factory. Introducing New Products In its first few yea rs sales, Crocs observed that all products sold eq ua well in each market around the world. This provide-~ an attractive opportunity. A new shoe model co u1:: be tested in the spring/summer season in the soif'J"~ ern hemisphere, and the results could be used to i:-- dicate how it might be accepted in the U.S . ar::: Europe. If the product was a huge hit, productio~ could be planned accordingly for the northern herr: sphere launch. On the other hand, if the pro du sold slowly, those not bought in the southern herr.· sphere could be sold in the northern hemisphe re its spring/summer season. Snyder elaborated: Now we're in a situation where we can bring o~ .• new products that might have more complexity
  • 53. in the supply chain-more leather and more other types of materials, grommets, sewing ma- chines, whatever is required . We can now la un those into half of the countries, still be agg res- sive with our build, still build much more tha n the pre-books, thinking that a given product is going to be hot. Suppose we launch a produ ct ir North America first. We've got other seasons coming along in other parts of the world, an d we've got another 10-15,000 stores we can launch this particular new product into very quickly. So, we don't take a huge risk by do ing that. We don't take a huge risk by ordering extrc: raw materials, and even building up extra sh oe stock as we launch a new product. If it sells o ut in the U.S., we build more, and if all that sells out in the US, that's OK-we'll launch in Europe or Asia the next year. Supply Chain Planning As of mid-2007, Crocs was us- ing a home-grown database system for plan nin"' that had evolved over time. However, it was in t he process of bringing up a commercial enterpris e re- source planning system. They had launched th e in- ventory module, which allowed them a global vie
  • 54. of inventory, and provided information for the plar·- n ing system. The new planning system was be in brought online. Crocs had planning people in the U.S., Asia , an Europe. Each country had to generate its own re- quirements plan, but there was also a global plan- ning activity for each model type. The glo ba planning personnel worked with the local staff o the requirements for each market. Product planning w as based on pre-books to~ each model, as well as information on what reta ile w ere picking up the model. Crocs analyzed the ex- pected sales of each model, but built the act ua Crocs : Revolutionizing an Industr y's Supply C hain Model for Competitive Advantage 503 product after it could see the demand hit to avoid ending up with unsold inventory. While Crocs did not build inventory in excess of
  • 55. expected orders, the company did acquire excess ca- pacity (sometimes as much as 2 to 3 times the ex- pected capacity) in the form of molds and molding machines so that it could quickly ramp capacity in case a product took off. MOVING INTO THE FUTURE Crocs had been enormously successful from its first sales in 2003 through the first quarter of 2007 . It had developed a supply chain that was revolutionary in the industry, and had been a critical factor in this suc- cess. It had products that were very popular in the marketplace. It had positive relationships with its re- tail customers. How could it best build on its success? Discussion Questions 1. What are Croc's core competencies? 2. How do they exploit these competencies in the future? Consider the following alternatives: a. Further vertical integration into materials b. Growth by acquisition
  • 56. c. Growth by product extension 3. To what degree do the alternatives in question 2 fit the company's co re competencies, and to what degree do they defocus the company away from its core competencies? 4. How should Crocs plan its production and inven- tory? How do the company's gross margins affect this decision? 134 Lean Thinking and Lean Systems Chapter outline 7.1 Evolution of lean 7.2 Lean tenets
  • 57. 7.3 Stabilizing the master schedule 7.4 Controlling flow with the kanban system 7.5 Reducing setup time and lot sizes 7.6 Changing layout and maintaining equipment 7.7 Cross-training, rewarding, and engaging workers 7.8 Guaranteeing quality 7.9 Changing relationships with suppliers 7.10 Implementation of lean 7.11 Key points and terms Jefferson Pilot Financial, a full-service life insurance firm, learned what so many other firms had learned before it: using the concepts of lean thinking and lean sys- tems for processing life insurance applications improved performance. Jefferson's
  • 58. goals for its application processing process were twofold. First, it wanted to re- duce throughput time, from receiving an application to issuing a policy, which was averaging between one to two months. Second, it wanted to reduce its 10 per- cent error rate because each error meant that rework and reprocessing were needed. Using the basic lean tenets presented in this chapter, Jefferson was able to achieve a 70 percent reduction in throughput time and a 40 percent reduction in errors. 1 Lean thinking and lean systems have been applied in a wide variety of indus- tries and settings. They are used to improve operations processes in manufactur- ing and services. Lean ideas are also used to improve processes outside of operations, including software application development and maintenance, annual budgeting, and even for collecting on delinquent accounts! What is lean and how do firms use lean ideas to improve their business?
  • 59. 1 Swan k (2003) Chapter 7 Lean Thinking and Lean Systems 135 In this chapter we introduce the lean concepts, principles, and techniques that a host of organizations have adopted for performance improvement. These concepts, principles, and techniques can be deployed to reform not only manufacturing sys- tems but also administrative systems, service systems, and entire supply chains. We begin by looking at the evolution of lean before presenting lean thinking as a set of five tenets. We then characterize the lean system-particularly the lean production system-that is created when companies pursue lean. We conclude by highlighting implementation issues to consider when a company is deploying lean. 7.1 EVOLUTION OF LEAN
  • 60. "Tri-State: ~onverting to JIT," Vol. V After World War II the U.S. system of mass production was the envy of the world. Mass production-the production of standardized discrete products in high vol- ume by means of repetitive manufacturing technologies-was the norm. Materi- als were produced in large batches, and machines were made to run faster to reduce costs. In some cases this resulted in sacrificing quality in the name of effi- ciency and creating narrow jobs that led to worker dissatisfaction, but still the world bought products manufactured in the United States. In the 1960s a Japanese miracle started at the Toyota manufacturing company. After visiting U.S. manufacturing companies, Toyota determined that it could not copy their system of mass production. Not only was demand for
  • 61. Toyota automo- biles low at that time, there was a severe lack of resources. Because of the lack of resources, Toyota developed a strong aversion to waste. Scrap and rework were deemed wasteful, and so was inventory that tied up storage space and valuable resources. Toyota realized that it needed to produce automobiles in much smaller batches, with much lower inventory, using simple but high- quality processes and involving workers as much as possible. This realization became the foundation for what is known today as the Toyota Production System (TPS) and Just-In-Time (JIT) manufacturing. This production system is now known and used around the world. See the Operations Leader Box titled "TPS at the Toyota Plant in Georgetown, Kentucky, USA." JIT manufacturing came to the United States in 1981 at the Kawasaki motorcy- cle plant in Nebraska, which used some of the TPS ideas. However, instead of
  • 62. transforming the entire system, JIT manufacturing focused primarily on inventory reduction but ignored other aspects of Toyota's complete system. As a result, many U.S. companies that attempted to copy and implement the Toyota Production Sys- tem achieved only partial improvement. In 1990 Womack, Jones, and Roos studied JIT automobile manufacturing in Japan, the United States, and Europe and popularized the term lean production in their famous book The Machine That Changed the World: The Story of Lean Production. 2 Lean production was defined as systematically eliminating waste in all production processes by providing exactly what the customer needs and no more. They reported that the best plants using lean production had a big edge in automobile assembly performance anywhere in the world. Labor pro- ductivity in the best plants exceeded that in the worst plants in all three regions by a factor of 2 to 1, defects were reduced by half, and
  • 63. inventory was reduced 2 The phrase "lean production" was coined in the late 1980s by John Krafcik, who was worki ng w ith Jam es P. Womack and colleagues on the International Motor Vehicle Program at the Massachusetts Institute of Techn ology (http://www.a utofieldgu ide.com/articles/01 0502.html ). 136 Part Two Process Design Operations Leader TPS at the Toyota Plant in Georgetown, Kentucky, USA ® TOYOTA Toyota Motor Manufacturing Kentucky, Inc. (TMMK), is Toyota's flagship manufactur- ing facility in the United States, currently producing 500,000 ve- hicles annually. Established in
  • 64. 1986, TMMK occupies 1300 acres in Georgetown, Kentucky, is over 7.5 million square feet in size, and employs approximately 7000 employees to build the Camry, the Avalon, and the Venza. At TMMK, employees have been trained not only in required job skills but also in problem-solving and continuous improvement methods. Job tasks have been standardized to minimize waste and assure qual- ity. Employees can stop and are strongly encouraged to stop the production line when a quality problem is detected. Employees are, moreover, actively involved in suggesting ways to improve their work and work environments, with an astounding 100,000 sugges- tions on average per year. Toyota has done more than transfer the Toyota Pro- duction System to TMMK. Realizing that the perfor- mance of TMMK depends on its suppliers, it has worked aggressively to help its 350 U.S.-based suppliers to imple- ment the Toyota Production System. TMMK created the Toyota Supplier Support Center in Erlanger, Kentucky, to provide consulting services to suppliers. Suppliers, in
  • 65. fact, deliver to TMMK frequently, allowing TMMK to hold inside its facility, on average, enough inventory to last for just four hqurs of production. Source: http://www.toyotageorgetown.com/; A. Harris, "Automotive Special Report-Made in the USA-Uprooting the Toyota Production System and Transplanting It to Kentucky in the United States Has Proved to be a Great Success for Toyota," Manufacturing Engineer 86, no. 1 (2007), pp. 14-19. from two weeks, worth to only enough to maintain production for two hours. The best U.S.-owned plants, indeed, had labor productivity (vehicle assembly hours) and quality comparable to the best Japanese -owned plants in the United States, while European plants lagged behind. This showed that the best U.S. plants could adopt the TPS and compete with Japanese plants, but average U.S. Lean thinking is applied in a wide variety of industries, including hospital emergency rooms to speed patient treatment.
  • 66. plants were still far behind, particularly behind plants located in Japan. Today, the concepts, principles, and techniques underlying lean production are often referred to as lean thinking and are being deployed across a broad spectrum of global firms. In the United States, 3M, Bendix, Black & Decker, Briggs & Stratton, Deere & Company, Delta Airlines, Eaton, Ford, General Electric, Hewlett-Packard, Honeywell, IBM, United Health Care, Wells Fargo, and Wipro are just a few examples of well-known firms pursuing lean thinking. In virtually all instances, benefits such as increased inventory turnover (50 to 100 times per year), superior quality, and sub- stantial costs savings (15 to 20 percent) have been reported. Chapter 7 Lean Thinking and Lean Systems 137 7.2 LEAN TENETS
  • 67. Lean thinking, as the name signals, is a way of thinking about processes at work (and even processes at home). This way of thinking is built around five tenets that subsume specific concepts, principles, and techniques. The five tenets aim to deliver value to customers efficiently. The first tenet in lean thinking is to specify precisely what about a product or service creates value from the customer's perspective. Recall from Chapter 1 that value is defined by the customer and provided in the p roduct or service the customer needs at a place, time, and price the customer is willing to pay. Value is not what the firm says but what the customer says. Value is often a solution to a problem a customer is facing that the customer is willing to pay for. Value, as such, is dynamic in nature and changes over time. Firms should design and deliver product and service features that customers value and stop doing activities that are not valued by cus- tomers (unless required for other reasons, for example, legal).
  • 68. This may mean re- moving unvalued product features or eliminating waiting times in service systems. Waste, in lean thinking, is anything that does not contribute value to the product or service being produced and delivered to the customer; rather than adding value, waste adds costs . The Japanese term for waste is muda. In many manufacturing, administrative, and service processes only 5 to 10 percent of total throughput time adds value for the customer. Firms want to eliminate obvious waste, but many forms of waste are hidden. For example, the v alue-added time to produce a product may be only three hours, but it takes a week to complete it. The muda or non-value- adding time might include waiting for machines or labor to become available, deal- ing with backlogs, searching for materials, or correcting processing errors. Table 7.1 defines the seven forms of waste originally identified by Taiichi Ohno,
  • 69. Toyota's former chief engineer, who is considered the father of the Toyota Produc- tion System. Womack and Jones in their book on lean thinking introduced an eighth form of waste: underutilization of workers. This stems from not recognizing, developing, and utilizing the mental, creative, and physical abilities of employees. Contributing to this waste are factors such as poor hiring and training practices, high employee turnover, and an organization culture that does not respect people. The second teriet in lean thinking is to identify, study, and improve the value stream of the process for each product or service. The value stream identifies all the processing steps and tasks undertaken to complete a product or deliver a service from • Overproduction: Producing more than the demand of customers, resulting in unnecessary inven- tory, handling, paperwork, and warehouse space. • Waiting time: Operators and machines waiting for parts or
  • 70. work to arrive from supp li ers or other operations; customers waiting in line. • Unnecessary transportation: Double or triple movement of materials due to poor layouts, lack of coordination, and poor workplace organization. • Excess processing: Poor design or inadequate maintenance of processes, req uiring additional labor or machine time. · • Too much inventory: Excess inventory due to larg e lot sizes, obsolete items, poor forecasts, or improper production planning. • Unnecessary motion: Wasted movements of people or extra walking to get materials. • Defects: Use of material, labor, and capacity for production of defects, sorting out bad parts, or warranty costs with customers. 138 Part Two Process Design
  • 71. FIGURE 7.1 Health care value stream map. Source: Adapted from Sylvia Bush ell, Joyce Mobley, and Becky Shelest, "Discovering Lean Thinking at Progressive H ealth Care," Journal of Quality & Participation 25, no. 2 (Summer 2002), pp. 161- 191. Xo Patient In 15 minutes Wait 40 minutes Check-in Doctor Visit Information Flow · Xo Patient Out
  • 72. 20 minutes 45 minutes 120 minutes Wait Time Visit Prep Visit Doctor 11 minutes 40 minutes Processing Time Pharmacy, 1160 minutes u Total Blood Test Throughp u t Time beginning to end. A typical value stream thus can include both value-added and non-value -added processing steps and tasks. The goal in studying the value stream is to eliminate the non-value-adding processing steps and tasks. One technique supporting this tenet is value stream mapping, which creates a visual representation of the value stream of a process, much like process flowcharting (discussed in Chapter 6). Value stream mapping requires direct observation of work
  • 73. and the flow of work within a process so that opportunities for improvement can be identified. The Japanese refer to such direct observation of work as gemba. There- sulting value stream map shows the beginning and ending points of the process, the steps and tasks between those points, and relevant performance information abou the process. Figure 7.1 is a simplified value stream map showing how patients flm ,- through a multispecialty clinic. Improvements to the process come from studying the value stream map and then asking and answering the question, "Is this step or task necessary in creating value to the customer?" Processing steps and tasks that are n ot necessary or are non-value-adding, such as the numerous waiting times in the figure, should then be reduced or removed to improve performance and ultimately enhance value in the product or service provided to the customer. The third tenet in lean thinking is to ensure that flow within a process is simple, smooth, and error-free, thereby avoiding waste . To appreciate
  • 74. this tenet, look at Fig- ure 7.2, where production is viewed as a stream and the water level as the inventory of raw materials, work-in-progress, and finished goods. At the bottom of the stream are rocks, which represent problems related to quality, suppliers, delivery, machine breakdowns, and so forth. The traditional approach is to hold inventory high enough to cover up the rocks (problems) and thus keep the stream flowing. Lean - RE 7.2 Simple, smooth, and nonwasteful flow: A stream analogy. Original situation ¥en tory covers problems) Water level lowered (problems are exposed) Chapter 7 Lean Thinking and Lean Sys tems 139
  • 75. Water flows smoothly (once problems are solved) thinking calls for the opposite: lowering the water (inventory) level to expose the rocks (problems) . When the rocks have been pulverized (i.e., the problems have been solved), the water is lowered again to expose more rocks. This sequence is iter- ated until all rocks are turned into pebbles and the stream (production system) flows smoothly and simply at the desired output rate while only needing a low level of inventory at any given time. Inventory in this analogy is a form of waste that hides problems that contribute to other forms of waste besides inventory. The idea of simple, smooth, and error-free flow means that production flows are simple and direct, and do not change from one production run or one customer to another. Such predictable flows ensure that the exact appropriate resources, includ- ing labor and equipment, can be devoted to each production
  • 76. step. It also means that workers should.understand the connection of their own work to work performed upstream (before them in the production process) as well as work that follows their own. These direct and unambiguous links in the process provide complete certainty about exactly who has performed what work within the process. The goal is to avoid repeating the same activities more than once, for example, retightening a bolt, rein- specting paperwork, or reasking the customer for the same information. There are many techniques that are used to help smooth the production flow. These techniques are covered later in the chapter. The goal of ensuring simple, smooth, error-free flow can be extended up the sup- ply chain to include suppliers. In lean manufacturing, both workers and suppliers are charged with the responsibility of producing quality parts just in time to support the next production process. In a production plant, workers are
  • 77. required to stop the production process by pulling a cord that triggers a call for help.3 In addition to hav- ing greater responsibility for production in a lean system, workers and suppliers are also charged with developing ideas for improving the production process. Through quality teams, suggestion systems, and other forms of participation by workers and suppliers, the process of production is improved. The idea is that the workers who are performing the work know the most about the work and, therefore, are in the best position to improve the way the work is completed. Thus, lean thinking encour- ages the use of the capabilities of workers and suppliers to a great extent. The fourth tenet in lean thinking is to produce only what is pulled by the customer. Complying with this tenet requires replacing the push system typical in traditional 3 This specific responsibility is known as Jidoka in Japanese (or Autonomation ). The cord that triggers a visual ca ll for help is ca lled an andon cord .
  • 78. 140 Part Two Process Design mass production with the pull system of lean production. A push system aims to produce goods or ensure delivery of services well in advance of demand, often ac- cording to a schedule or plan created from potentially inaccurate forecasts. Large batches of materials are pushed from one process or machine to the next regardless of whether the inventory is needed. This allows machines and processes to be u ti- lized at full capacity, and inventory is considered a valuable asset. A pull system, on the contrary, waits for the process customer to signal a need for a good or service before producing it to fulfill that need. The signal from the customer is then sent vi- sually up the various stages of production-and even the supply chain-to signal what and when production and delivery are needed. No upstream process is autho-
  • 79. rized to produce a good or service until a downstream customer asks for it, thu minimizing inventory throughout the production system. An example of a push system is the "hub and spoke" system used by many of the major airlines. Flying point to point by some airlines is a pull system based on what the customer wants. No customer wants to connect through a hub to get to their destination. The fifth tenet in lean thinking is to strive for pe1jection. Striving for perfection requires continuous improvement of all processes as well as radical redesign when necessary. When continuous improvement is undertaken, more value is provided by the firm in its search for ultimate perfection for the customer. The definition of perfection used here is an affordable good or service, delivered rapidly and on time, that meets the needs of the customer. When customer needs change, the def- inition of value changes and so does the definition of what constitutes perfection .
  • 80. There is therefore no end to the improvements that can b e sought and made. In lean thinking, the process changes necessary in seeking perfection must b e made using scientific methods, including designing experiments and testing h y- potheses. Employees are discouraged from changing a process based on intuition alone. Rather, lean thinking promotes decision making based on scientifically de- rived evidence. One simple and relatively powerful technique for improving a production pro- cess is the 5 Whys technique. This problem-solving technique systematically ex- plores the cause-and-effect relationships that underlie an observed problem (e.g., a defect in a product or lateness in delivery) . By asking why at least five times, this technique is used to deliver insights into the root cause of an observed problem so that proper corrective action can be taken to prevent the root cause from re-creating
  • 81. the observed problem. Here is an example: The truck will not start. Why? The bat- tery is dead. Why? The alternator is not functioning. Why? The alternator belt is broken. Why? The alternator b elt was well beyond its useful life and not replaced. Why? The truck was not maintained according to the recommended service sched- ule. Why? Replacement parts are not available because the truck is old. Asking why helps move toward potential solutions: Find a source for replacement parts or pur- chase a different truck that is maintainable.4 Another well-known technique supporting lean thinking is SS. This is a tech- nique for organizing a workspace (e.g., production shop floor, office space, hospital station, tool shop) to improve employee morale, environmental safety, and process efficiency. The name of this technique comes from five Japanese terms, all of which when transliterated and translated begin with the letters. These terms are defined in Table 7.2. Underlying the SS technique is the belief that when a
  • 82. workspace is well organized, time will not be wasted looking for "things" (e.g., a tool or paperwork); misplaced items also will be readily noticed. By having employees decide which 4 Adapted from w ikipedia. org (201 2). Chapter? LeanThinkingandLeanS ys tems 141 Operations Leader ss +Safety= 6S! , · The U.S. Environmenta l Protection Agency provides training materials to businesses for safe storage of hazardous chemicals in work environments, calling t he program 65, which stands for 55 + Safety. The training uses standard 55 methods on removing un- used chemicals that are lingering in storage areas, d ecentralizing chemicals by moving them to where th ey are used in work processes, and organ izing and labeling storage areas so that the chemicals are easy t o find and their absence is easily noticed.
  • 83. The photos show an examp le from one manufac- t u ring p lant where, before 55 activities w ere con - ducted, chemica ls were disorganized and difficult to locat e. Following 55, the storage cabinet contains o n ly chemica ls that are needed nearby, in quantities th at last only a few days, and labeled shelves can be easily restocked as needed . "A helpful ru le of thumb is that an yone should be ab le to find any item in 30 seconds or less ." The sixth 5 for safety is integrated with standard 55 methods. To promote safe use and storage of chemicals, 65 training helps businesses develop ap- propriate visual warnings in areas near chemica ls, locate spill kits nearby for cleanup , and clear and clean the space around storage cabinets to avoid t ripping hazards. Lean concepts like 55, as seen in this example, can be customized to the pa rticular needs of an organi- zation or situation. Safety is integrated here w ith 55, a logical connection when hazardous chemica ls are being used. Source: Adapted from www. epa .gov, 2012 .
  • 84. items should be kept where as well as how they sh ould be stored, SS can instill in employees a sense of ownership, help standardize work, assure a safe work envi- ronment, and keep processes from becoming overly complex. See the Operations Leader b ox titled "SS + Safety = 6S!" As you can see, the five tenets of lean thinking have many techniques and con- cepts associated with them. In the following sections, we dive into more d etail on several of the most commonly u sed techniques . Term Translation Seiri To sort Seiton To straighten or set in order Seiso To shine, sweep, or clean
  • 85. Seiketsu To standardize Shitsuke To sustain Meaning Decide what things should be kept and w hat things should be discarded so that on ly the essential things remain. Arrange essential things in a manner that sup ports an efficient flow of work. Assure cleanl iness by returning things to thei r storage locations and removing things that do not belong. Standardize work and adopt seiri-seiton-seiso t hrougho ut so that all employees know w hat their responsibilities are. Mainta in seiri-seiton-seiso-seikutsu as a hab it of work and a way to operate. .. - - -
  • 86. 142 Part Two Process Design 7.3 STABILIZING THE MASTER SCHEDULE One of the ways that firms can move toward achieving the lean tenet of simp-=- smooth, and error-free flow is to level the amount of work that is performed ea.- day. For a service, this might mean scheduling a certain number of customers ea- day or using methods such as advertising or pricing to even out the numb er customers who want the service each day. This practice is referred to as stab iliz- ing the master schedule. Although this terminology is generally not used in vices, the concept still applies, as we will see. The process of production plannic; for manufacturing starts with a long-range production plan, which then is bro~ down into annual, monthly, and daily plans. As part of this production planninc sales are considered, profit planning is done, and capacity is planned. This p lan- ning process starts with an aggregate production plan and then
  • 87. breaks it dm~ into the daily production volume needed to meet the planned demand. Master scheduling for products is done to achieve a uniform load, the assign- ment of approximately equal amounts of work to each machine or worker. Th production horizon must be set at least one week in advance and possibly one o: two months in advance, depending on lead times for production, purchasing and capacity changes. Assume for the purpose of discussion that a one-mon tl; rolling schedule is used in which one month of production is scheduled ir.. advance . Also assume that the schedule, calls for 10,000 units of product A 5000 units of product B, and 5000 units of product C. If there are 20 days of pro- duction in the month, the daily schedule will call for V20 of each model produceci in each day: 500A, 250B, and 250C. Furthermore, the individual units will be mixed as they go down the production line. The sequence will
  • 88. be I AABC t AABC/AABC /. Note how two units of A are produced for every unit of Band C. Then the sequence is repeated continually. Automobile assembly processes are often sequenced in this manner when multiple models are produced on the same line, ensuring that production of each model is completed at approximately th e same rate that it is purchased. Matching supply to demand is illustrated by the concept of takt time. Takt is the German word for the baton that an orchestra director uses to regulate the speed of the music. In lean production systems takt time is the time between successive units of production; this represents the speed of output. For example, a takt time of 2 minutes means that one unit is produced every 2 minutes, or 30 units are pro- duced in an hour (60/ 2) . In lean production systems the takt time of production should be set equal to the average demand rate of the market to match production
  • 89. with demand and thus minimize inventories. To establish the beat of the market, takt time can be computed by dividing the time available for production (being sure to subtract for nonproductive time such as holi- days and lunch breaks) by the demand over the same period. For example, if market demand is 1000 units of a product per day and there are 7 hours of production time available in the day (or 420 minutes), the takt time is then (420 + 1000) = 0.42 minute per unit. So, given the available production time, production of one unit will have to be completed every 0.42 minute (about 25 seconds) to meet market demand. Produc- ing at rates less than the takt time will result in shortages in meeting the demand, and producing at rates greater than takt time will result in building up inventory. The idea of takt time is to produce at a constant rate that equals average demand. Once the monthly master schedule has been set, this information must be trans-
  • 90. mitted to all work centers and suppliers. They will then plan their capacity in Chapter 7 Lean Th inking and Lean Systems 143 terms of numbers of workers needed, overtime, subcontracting, and possibly new equipment. Enough lead time must be given so they can obtain the resources they need to complete the scheduled work on time. The lean production system does not allow overproduction once the daily quota has been set, since production is scheduled just in time to meet demand. For example, if the daily quota is met in six hours, production is stopped and workers do maintenance or have quality-team meetings. Similarly, if production falls behind, it is usually made up by overtime the same day. This is facilitated by shift scheduling, which allows some time between shifts. For example, a two-
  • 91. shift operation might be scheduled from 7 a.m. to 3 p.m. and from 5 p.m. to 1 a.m. Maintenance and overtime occur between shifts. The objective of the lean pro- duction system is to produce the right quantity each day-no more and no less . Master scheduling thus closely resembles average customer demand on a daily basis . This minimizes finished-goods inventory since the production output is closely matched to demand. This type of master schedule also helps reduce work- in-process and raw-materials inv entories, since stabilizing the master schedule provides nearly constant demands on all work centers and outside suppliers. Contrast this with traditional mass-production processes in which lot sizes are large, and are not matched to market demand, resulting in large inventories of finished goods, work in process, and raw materials. A stable master schedule and uniform load are desirable for gaining the most benefit from a lean system. But they are not strictly required
  • 92. elements of lean sys- tems. For example, Minneapolis Heart Institute (MHI) designed a patient treat- ment protocol based on lean thinking. 5 Heart attack patients at rural hospitals throughout Minnesota are rapidly transported via air or ground ambulance to a Minneapolis hospital for specialized treatment that is not available in rural areas. Since heart attacks occur randomly, demand for this service cannot be stabilized or use a takt time in the same manner that these concepts are applied in manufactur- ing. But eliminating non-value-adding activities and creating simple and rapid flow through the treatment process have enabled MHI to reduce average treat- ment times to 95 minutes from 3 to 4 hours prior to lean thinking. And mortality rates for these p atients are about half of the national average. We can see from this example that not every lean technique must necessarily be used in every situation. Lean is a flexible system and its techniques can be applied as needed.
  • 93. CONTROLLING FLOW WITH THE KANBAN SYSTEM Kanb an is the method of production authorization and materials movement in the lean production system that supports the tenet of producing only what is pulled by the customer. Kanban in the Japanese language means a marker (card, sign, plaque, or other device) used to control the timing and sequencing of work through a sequential process. The kanban system is a simple and visual "parts withdrawal system" involv- ing cards and containers to pull parts from one work center to the next just in time. In services, a kanban system might be used to pull many types of work such as paper- work, or even the customer! Since kanbans are mostly associated with manufacturing, we'll discuss how they are used to pull inventory through a production system. The purpose of the kanban system is to signal the need for more parts and en- sure that those parts are produced just in time to support
  • 94. subsequent work centers. 5 Shah et al. (2 008). 144 Part Two Process Des ign _.,_ .... -- '~ " " . --- KANBAN SQUARE AT HONEYWELL. The kanban square marked by the dashed rectangle signals the need for the production of a cabinet. Only one cabinet is placed on this square at a time. When the square is emptied by subsequent production, another cabinet is produced. Parts are kept in small containers, and only a J~ _ cific number of those containers are provid--
  • 95. When all the containers are filled, production stopped, and no more parts are produced until ::- subsequent (receiving) work center provides c: empty container. Thus, work-in-process invento:- is limited to available containers, and parts a:_ provided only as needed. The final assembly schedule is used to p parts from one work center to the next just in tilr.:e to support production needs, which are align-- with market demand. Only the final assembly line receives a schedule from the dispatching office and this schedule is nearly the same from day - day. All other machine operators and suppliers ~ ceive production orders (kanban cards) from th.._ subsequent (receiving) work centers. If productior stops for a time in the receiving work centers, th supplying work centers also stop soon beca their parts containers become full since they n longer receive kanban orders for more materieL The kanban system can be extended to supplie~ so that the suppliers also respond only to demam.d generated by the factory. To see how the kanban system works as a physical control
  • 96. system, assume tha: eight containers are used between work centers A and B (A supplies B) and tha: each container holds exactly 20 parts. The maximum inventory that can exist be- tween these two work centers is 160 units (8 X 20) since production at work center A will stop when all the containers are filled . In the normal course of a day, the eight containers might be distributed as shown in Figure 7.3. Three containers filled with parts are located at work center FIGURE 7.3 Kanban system. roduction _ ~ 11 Production card anban post ~ - Input area
  • 97. Output In transit Withdrawal card Input area ~ ~ ~ Output area _/Twithdrawal ~ 6 kanbanpost "Process System Improvement: Implementation
  • 98. "F"eaturing Gortrac," Vol. X Chapter 7 Lean Th inking and Lean Systems 145 A in the output area. One container is currently being filled by the machine at work center A. One full container is being moved from A to B, two full containers are sitting in the input area of work center B, and one container is being used at B. These eight containers are needed since w ork center A also p ro duces parts for other work centers, machines at A may break down, and move times from A to B are not always exactly predictable. Some companies control the movement of containers b y u sing two types of kanban cards : production cards and withdrawal (move) cards . These cards are used to authorize production and to identify the parts in any container. Kanban cards may be made of paper, metal, or plastic, and they
  • 99. generally con- tain the information shown in Figure 7.4 . Kanban cards take the place of the shop paperwork used in traditional mass production. Instead of using cards, production can also be controlled by kanban squares that v isually signal the need for work (to fill the kanban squa re) , or by visual control of the empty containers . Most importantly, the kanban system is visual in nature . All parts are neatly placed in containers of a fixed size. As empty containers accumulate, it is clear that the producing work center is falling behind . When all the containers are filled, production is stopped. The production lot size is exactly equal to one con- tainer of parts . All of these are visual indicators of the work that should be done or stopped . The number of containers needed to operate a work center is a function of the
  • 100. demand rate, container size, and the lead time for a container. This is illustrated by the follow ing formula :6 DT n =- C where n = total number of containers D =demand rate of the using work center C = container size, in number of p arts, usually less than 10 percent of daily d emand T = time for a container to complete an entire circuit: filled , wait, moved, u sed, and returned to be filled again (also called lead time) RE 7.4 Kanban cards. ~wmber __ W_ 2_6_2 __________ __ _·arn e WHE EL
  • 101. Cap acity Box Type Issue No. - B 4 of 8 - Withdrawal Kanban Preceding Process STAMPING A12 Subsequent Process RUBBER T I RE B6 Par t Number Y16032 Part Name WH EE L RIM Stock Location at Wh ich to Store: 1 879-2
  • 102. Container Capacity: 2 0 Production Kanban Process STAMPI NG A1 2 6 Safety stock can be added to the numerator of th e formula to account for uncertainty in demand or the time. 146 Part Two Process Design Suppose demand at the receiving work center B is 2 parts per m in ute .::- standard container holds 25 parts. Also assume that it takes 100 minutes oi::: time for a container to make a complete circuit from work center A to work - ter Band back to A again, including all setup, run, move, and wait time. The r
  • 103. ber of containers needed in this case is eight: 2(100) = 8 n = 25 The maximum inventory is equal to the container size times the number of tainers (200 units = 8 X 25), since the most we can have is all containers filleci: Maximum inventory = nC = DT Inventory can be decreased by reducing the size of the containers or the ntc" ber of containers used. This is done by reducing the lead time, the time requireG.- circulate a container. When any of these times have been reduced, managemc:- can remove kanban cards from the system and remove a corresponding numb er containers. It is the responsibility of managers and workers in a lean system- reduce inventory by means of a constant cycle of improvement. Reducing lea- time by reducing the fill, wait, move, use, or return times is the
  • 104. key. A complete kanban system can link all work centers in a production fa cili._ It can, moreov er, link the production facility to its suppliers, as show n ::.::- Figure 7.5. With such a kanban system, all material is pulled through t::... FIGURE 7.5 Linking work centers and suppliers w ith a kanban system. Source: Rober t W. Hall, Driving the Productivity Machine: Production Planning and Control in Japan (Falls Church, VA: American Production and Inventory Control Society, 1981) . Input area ' •• .. ',·· ...• Supplier 1
  • 105. Input area _.,. ~ .. ~ .. ,.~ ... ·· ~ ~ •• lit ~ .. ~ I •••• .. ~ .. ..~ . __ ,.~ Supplier 2 Input area ~ ,.------ ; "" ...... , •••• •••• • •••••• '!( ,.; ------
  • 106. Input area Final assembly line .. ~ · ·~ - - + Withdrawal kanban ---··~ Production kanban • • • • • • • . Physical materials flow ··• Chapter 7 Lean T hinking and Lean Systems 147 production system by the final assembly schedule, based on a highly visible shop-floor and supplier control system.
  • 107. REDUCING SETUP TIME AND LOT SIZES Additional techniques for applying lean thinking to remove non- value-adding activities include reducing setup time and lot or batch sizes. Setup time is the nonproductive time when machines are being adjusted before beginning work on a new batch of parts . In a service setting, it might include readying a cus- tomer for service, for example, guiding a customer from the waiting room to an exam chair, and adjusting the chair position for a dental exam. Red ucing setup tim e is important in lean production systems because it increases available capac- ity, increases flexibility to meet schedule changes, and reduces inventory. As setup time approaches zero, the idea1 lot size of one unit can be reached. Manufacturing managers have typically concentrated on reducing run times per unit and more or less ignored setup times. When long runs
  • 108. of thousands of units are anticipated, run times naturally are more important than setup times. A better solution is to concentrate on reducing both setup times and run times. This requires additional attention by engineers, managers, and workers to the setup process . Since setup time has received so little attention, phenomenal reductions are possible. For example, at General Motors the time required to change a die in a large punch press was reduced from 6 hours to 18 minutes. This allowed dramatic reductions in inv entory at this work center from $1 million to $100,000, a reduc- tion in lead times, and greater utilization of capacity. Single setup s are being sought in many companies. This refers to a setup time that is completed in single digit minutes. One-tou ch se tu p s are also being pursued; this refers to a setup of less than one minute. These low setup times can
  • 109. be achieved by designing a two-step setup process. First, external and internal setups are separated. The term internal setup refers to actions that require the machine to be stopped, whereas an external setup can be done while the machine is operating. The external setup is analogous to the on- deck batter in baseball; the player is warmed up and ready to move into position as soon as the prior batter is finished. After internal and external setups are separated, as much of the setup as possible is converted from internal to external. This is done, for example, by using two sets of dies, one inside the machine and one outside; having quick change adjustments; and employing cleverly designed tools and fixtures . Once the machine is stopped, it can be quickly readied for a new product since internal setup has been minimized . Much improvement in setup time can be accomplished once people realize its importance in reducing waste (waiting time). In some companies, the workers even practice
  • 110. setups to reduce the time. For example, hospital personnel practice moving patients from the emer- gency room to surgery so they can resolve (before make quick changeovers of race cars. a real patient arrives) problems such as slow or 148 Part Two Process Design unavailable elevators that might cause a delay. A good example of quick char-~~ over comes from the racetrack. Race cars are quickly fueled, tires are changed, c::: the windshield is washed in short pit stops, the racing equivalent of a setup ,- _ highly coordinated and trained pit crews using specialized tools and equipmez: Southwest Airlines is renowned for its quick turnaround (setup) times w i planes, utilizing the techniques discussed here. Much of its success has been - tributed to its ability to keep planes productive in the air while minimizing ·
  • 111. spent on the ground. Reduced setup times are particularly useful when multiple product models= produced using the same work centers. Earlier in the chapter, we discussed b models should be sequenced during production to match their market demc::: rate. Such sequencing may presume that setups between models are small or r.e zero. When setup time cannot be reduced, it may not be possible or economica:. achieve perfectly mixed production at final assembly. In such cases, small~ should be scheduled while continuing efforts to further reduce the lot size. :-- goal of single-unit production, a lot size of one, should not be abandoned sinG:> may help to further reduce total system costs. 7.6 CHANGING LAYOUT AND MAINTAINING EQUIPMENT Installation of a lean production system has a natural effect on layout and e~- ment. The manufacturing or service facility evolves toward a
  • 112. more streamlir. flow because lot sizes are reduced, inventory is held close to where it is used, c::: problems are resolved with standardized solutions so that the problems d o ::- arise again in the future. Moreover, since inventory is typically kept low-onl: few hours or days of supply- work spaces can be much smaller because of :_ reduced storage space needed. One comparison of manufacturing plants shm·-~ that only one-third of the space was needed in lean plants, compared with n. lean plants. The effect of lean thinking on layout in a manufacturing plant is shovvr.. Figure 7.6. In part a of the figure, a non-lean layout is shown in which suppG:! deliver to stockrooms and parts are returned to the stockrooms after cer:c. stages of production are completed. In part b, a lean production system has bee:::- implemented, and all stockrooms have been eliminated. In this case, all sto6
  • 113. kept on the shop floor as part of the lean system. Part c of the figure shows ._;... the lean layout has evolved to a group technology (GT), or cellular manufa ing, layout. In this case, the work centers have been redesigned so that parts c.: flow smoothly from one work center to the next. Most of the inventory buffe:- which are next to each machine, have been eliminated as the parts flow from station to the next. It is a natural consequence of lean thinking to evolve tm•;c::: cellular manufacturing and feeder-line types of layouts. Effort is still made to __ duce lot sizes to a single unit. With a lean production system, preventative maintenance of equipmen: extremely important. Since inventories have been cut to minimal levels as work strictly adhere to the daily plan for production, it is critical to avoid unplam: equipment failures. A lean system requires the right amount of capacity, the ri~ amount of inventory, the right number of workers, and
  • 114. everything operating planned-each and every day. Workers take responsibility for most of their o· equipment and workspace maintenance, and this gives them more control o · ·- FIGURE 7.6 Improving layout with lean and group technology. Final Work Centers Assembly (a) Initial layout before lean Line 1 Line2 (c) Lean layout with GT Chapter 7 Lean Thinking and Lean Systems 149 (b) Lean layout
  • 115. Final Assembly Final Assembly their work and work environment. Maintenance time is provided between shifts for routine and preventive maintenance actions so that it does not disrupt the regular daily work schedule. CROSS-TRAINING, REWARDING, AND ENGAGING WORKERS One of the critical elements needed to make a lean production system successful is multifunction workers, who have a much broader set of skills than their counter- parts in traditional environments. Cross-training of workers is therefore a critical human resources responsibility. In most cases, each worker must be able to oper- ate several machines in a manufacturing setting or perform a variety of tasks in a
  • 116. service setting. In manufacturing, since parts are not produced unless they are needed, the worker must be able to shut down one work center and move on to another work center where parts are needed. The worker also must be able to set up machines, do routine maintenance, and inspect the parts. The main benefit of cross-trained workers is that they provide flexibility to the production system. 150 Part Two Process Design ~~ Nurses who can be moved to different hospital units and production workers who can be shifted to a different production area help to place labor resources just where they are needed at any given time. This reduces the need to have excess la- bor in specific work areas just in case capacity is needed on short notice.