BEST Call Girls In Greater Noida ✨ 9773824855 ✨ Escorts Service In Delhi Ncr,
Marketing 4 success manual
1. 1
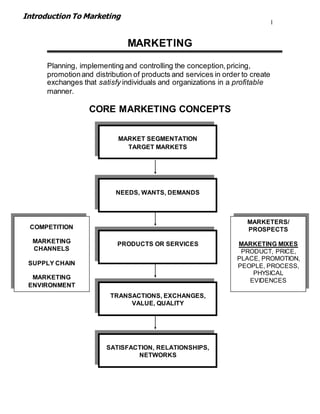
MARKETING
Planning, implementing and controlling the conception,pricing,
promotionand distribution of products and services in order to create
exchanges that satisfy individuals and organizations in a profitable
manner.
CORE MARKETING CONCEPTS
MARKET SEGMENTATION
TARGET MARKETS
NEEDS, WANTS, DEMANDS
PRODUCTS OR SERVICES
TRANSACTIONS, EXCHANGES,
VALUE, QUALITY
SATISFACTION, RELATIONSHIPS,
NETWORKS
MARKETERS/
PROSPECTS
MARKETING MIXES
PRODUCT, PRICE,
PLACE, PROMOTION,
PEOPLE, PROCESS,
PHYSICAL
EVIDENCES
COMPETITION
MARKETING
CHANNELS
SUPPLY CHAIN
MARKETING
ENVIRONMENT
Introduction To Marketing
2. 2
MARKETING FUNCTIONS
MARKET
RESEARCH
Gathering, recording and
analyzing, data about
problems and opportunities
about present and potential
markets
OPPORTUNITY
ANALYSIS
Assessing the cost, risk
and benefit of pursuing
marketing activities in a
particular market sector
SOCIAL
RESPONSIBILITY
Having a positive impact on
society: voluntary, ethical,
legal and economic
CUSTOMER
ANALYSIS
The examination and
evaluation of: needs,
wants, desires and
expectation.
BUYING
SUPPLIES
Evaluating alternative
supplies, selecting the best
supplier(s).
SELLING PRODUCTS
AND SERVICES
Adverting, Sales
Promotion, personal
Selling, Publicity, Direct
Marketing, The Internet.
PRODUCT &
SERVICE PLANNING
Test Marketing, Product &
Brand Positioning, product
Features, Style, Quality,
Customer Service
PRICING
Cost –Based Pricing,
Competitive Pricing,
Value Pricing,
Market Skimming,
Market Penetration.
Payment Terms
DISTRIBUTION
Wholesaling, Retailing,
Warehousing,
Inventory level,
Channels,
Location,
Transportation Method.
Introduction To Marketing
3. 3
DIFFERENCE BETWEEN SELLING & MARKETING
Starting Focus Means Ends
Point
THE SELLING CONCEPT
THE MARKETING CONCEPT
Business Existing Selling / Profits Through
Products Promoting Sales Volume
Market Customer Integrated Profits Through
Needs Marketing Customer Loyalty
“All businesses should find out what customer needs are
then produce products/services to satisfy those needs”!
Introduction To Marketing
4. 4
COMPANY & ENVIRONMENTAL AUDIT
“THE COMPANY”
Our management team is competent
in strategic planning
All of our managers use great
decision-making techniques
Our company’s training programs
need improvement
We have a lot of motivated staff
We segment markets effectively
We are not committed to proactively
researching the market
We have successful pricing,
promoting and distribution
strategies
We always prepare marketing plans
We have a diversify investment
portfolio
We manage assets successfully
We have a great relationship with our
creditors and banks
We have strong financial ratios
Opera
Our warehouse needs improvement
Our inventory control system is
effective and efficient
We have new and technological -
advanced equipment
Our quality -control policies and
procedures needs to be revisited
We always use outside research
companies
We need to improve on our research
and development programs
We have recently hired a competent
research manager
Our Research Dept. is too small
Our POS system is not user- friendly
We have technological advanced
computers systems
We have a secured information
system
The CIS helps our managers to make
excellent decisions
HUMAN RESOURCES MARKETING
COMPUTER
INFORMATION SYSTEM
RESEARCH &
DEVELOPMENT
OPERATIONSACCOUNTING / FINANCE
Marketing Analysis
5. 5
ENVIRONMENTAL AUDIT (“PEST” ANALYSIS)
POLITICAL-LEGAL
Government is stable and responsible
Government has approved some new
projects for foreign investors
Government has given some
concessions to small businesses
There is a decrease in customs duties
on beverage imports
Government is: extending shopping and
working hours / regulating beverage…
ECONOMIC
Unemployment level is decreasing
Inflation rate is increasing
Bahamian and USA economies are
both coming out of recession
How will FTAA / CSME impact ……
Banks Interest rates have declined
Banks increase lending money
BAH$ is still strong against US $
Government decrease Interest rates
SOCIAL –CULTURAL
More women and men are starting to
drink non-alcoholic beers and are
going to sporting lounges a lot
Bahamians are become more health
conscious and “quality driven”
Increase de-marketing of drinking
alcohol beverages by pressure groups
Crime has increased
There has been an increase in
minimum wage
TECHNOLOGICAL
New POS system has been developed
to increase efficiency in processing sales
activities
The internet has become an excellent
resource center for information on new
trends, products and suppliers
New fork-lift can transport twice as
much products than before
Bottling recycling plant just opened
New beverage software on market
Marketing Analysis
6. 6
ENVIRONMENTAL AUDIT (5 Cs ANALYSIS)
COMPETITION
Name: Bahamas Beverages
Reputation: honest, reliable………….
Image: high quality, premium price……
Vision: to be industry leader…………
Objectives: to gain 50 % market share...
Strategies: product development…..
Strengths: competent General Manager
Weaknesses: weak marketing plan
Competitive Reaction Pattern: slow
COLLABORATORS
DISTRIBUTOR
“No One”
Resource? Reputation? Storage space?
Location? Transportation method?
CUSTOMERS
Target Market: Hotels & Restaurants
What do they buy? N/A beers 12 oz
Where do they buy? Bah. Beverages
Why do they buy? Excellent price
When do they buy? 1 order per week
Who is responsible
for buying? Purchasing Manager
How do they buy? Mostly on credit
How much do they buy? 10 c/s per wk
COST
INDUSTRY: NON-ALCOHOLIC
BEVERAGE MARKET
Ease to produce / market product: low
Ease to enter industry: low
Ease to exit industry: low
Bargaining power of Suppliers: low
Bargaining power of buyers: low
Amount of substitute products: many
Degree of rivalry
amongst competitors : high
SUPPLIER
“Beverage Ltd”
Reputation: good
Reliable: 90%
Accountability: ok
Prices: fair
Payment Plan: ok
ALLIANCES
“No One”
Reputation?
Resources?
Capabilities?
Vision?
Values?
Mission?
7. 7
SITUATION ANALYSIS (“SWOT” ANALYSIS)
STRENGTHS
We segment markets effectively
We manage assets successfully
We have a strong management team
WEAKNESSES
Our warehouse needs improvement
We need to improve on our research
and development programs
Our Customers Service Programs are
out-dated
OPPORTUNITIES
More women and men are starting to
drink non-alcoholic beers and are
going to sporting lounges a lot
Bahamians are become more health
conscious and “quality driven”
Minimum wages have increased
THREATS
Inflation rate is increasing
Competition have increased in the non-
alcoholic beverage market
There are a lot of substitute products
in the beverage industry (generally)
Marketing Analysis
8. 8
ANALYZING MARKETING
PROBLEMS & OPPORTUNITIES
“Marketing Information System”
Marketing Research process is the systematic design,
collections, analysis of reporting of data and findings that are
relevant to a specific marketing situation facing a company.
A. INTERNAL RECORDS
Orders Income Statements
Sales Balance Sheets
Prices Cash Flow Stat.
Inventory Levels Strategic Plans
Receivable Dept. Reports
Payables Bank Statement
Appraisal Forms Marketing Plans
B. MARKETING
INTELLIGENCE
Newspaper Journals
Television Internet
Videos Books
Customers Competition
Suppliers Distributors
Trade Publications Magazines
1. DEFINE PROBLEM OR OPPORTUNITY
PROBLEM: Sales need to increase
OPPORTUNITY: Bahamians starting to increase their desire
to drink non-alcoholic products
C. MARKETING RESEARCH PROCESS
Marketing Analysis
9. 9
EXPLORATORY
OBJECTIVE
Help define the
opportunity and develop
assumptions
Objective: To determine
the extent that Bahamians
prefer to drink non-
alcoholic beers.
2. DETERMINE RESEARCH OBJECTIVES
DESCRIPTIVE
OBJECTIVE
Describe:
Market potential
Attitude of customers
Demographics of
customers who by
products
Objective: To determine
what age brackets prefer
drinking non-alcoholic
beers.
CASUAL
OBJECTIVE
To test assumptions for
cause and effect
relationship
Objective: To determine
to want extend will the
change in the following:
size, bottle colour, label,
price have on have on
non-alcohol beverage
purchasing amount
A. DATA
SOURCES
Secondary Data
Analyze Information from
environmental scanning
reports that relate to the
consumption of non-
alcoholic beverages.
It must be current,
accurate, relevant, specific
and impartial. Also look at
data from Dept. of
Statistics
Primary Data
Need to conduct reliable
and validated research
B. RESEARCH
APPROACH
Observation: used to
develop assumptions
Surveys: learn about
people belief, knowledge,
preference & satisfaction
Interviews: focus group,
intersects, and telephone.
Learn about people beliefs,
attitudes & behavior
Behavioral Data: store
scanning data
Experiment: changing
variables (price change,
bottle colour) and analyze
how people response
C. RESEARCH
INSTRUMENT
Questionnaire
A. Form:
Open –ended questions- (30%)
Good in exploratory research when
the researcher is trying to find out
what people think not necessarily
how many people think in a certain
way
Closed –ended questions- (70%)
Provides answers that are easier to
interpret and tabulate
B. Wording:
Simple, direct & unbiased
C. Order:
Logical- interesting questions first.
Difficult and personal questions at the
end
Mechanical instrument: scanners
3. DEVELOP THE RESEARCH PLAN
Marketing Analysis
10. 10
D. SAMPLING PLAN
Sampling Unit
Who will be surveyed?
Target Population: Alcohol beer drinkers
and non-alcohol beer drinkers
Gender: Males & females
Age: 21-55 yrs
Location: Nassau
Sample Size
How many people
should be surveyed?
It is estimated that there are 50,000
alcoholic and non-alcoholic beer
drinkers in the Bahamas.
1% (500) of the targeted population will
be surveyed
Sampling Procedure
How should the respondents be chosen?
Probability Sampling
Random sample:
Randomly pick 500 people from
liquor stores, bars, customer listing.
Stratified Sampling:
Pick Men/women between
21-55 yrs old
Cluster sampling:
Pick people based on location
E.g. east/west/north/south
Probability Sampling
Convenience Sample:
Pick any persons to be respondents
because they are in an area
Judgment sample:
Pick middle age men because they are
lightly to be non-alcoholic beer drinkers
Quota Sample:
Pick 1% of target population
E. CONTACT METHOD
Face Interview
Focus groups are
excellent but may
cost a lot
Individuals
interviewing is
flexible and quick
Telephone
interview
Control of sample
is excellent. Data
collection is fast
On-line
Low cost but
control of sample
is poor. Response
rate can be good
or bad
Mail Questionnaire
Low cost but data
collection is slow.
There is little
flexibility
Marketing Analysis
11. 11
4. COLLECT & ANALYZE DATA
“Problems Collecting Data
Responding may refuse to cooperate
Some respondents might gave bias or dishonest answers
Respondents might not be available when needed
Our company gathered information from 500 respondents by:
Interviewing 30 non-alcoholic drinkers at 3 focus group session
Mailing 120 questionnaires to customers who drink beers
Surveying 250 non-alcoholic beer drinkers at 20 local bars during a
taste testing event
Interviewing 100 beer drinkers at our customers shop
Methods of Analyzing Data
Averages: men between 25-40 represent 50% on non-alcohol beer
drinkers
Regression analysis: when prices exceed $1.00 respondents said that
they would consume less non-alcohol beer.
eg: 400 @$1.00, 300 @$1.25, 150 @ $1.50
5. INTERPRETING & REPORTING
The research was said to have validity – because it collected the
appropriate data needed to answer the questions or the research
objectives
The research was said to be reliable - because if the same questions
were asked of a similar sample it would have produced the same findings
Research Findings: non-alcohol blue beer
A 12 oz Blue bottle was most popular
Each Respondent would purchase up to 1c/s a week
More of the product would be sold at $1.00
Men between 25-50 yrs was most interested in the product
Marketing Analysis
12. 12
MEASURING MARKET DEMAND
& SALES FORECASTING
“ Market Size, Growth & Profit Potential”
THE MARKET
A MARKET is a set of all actual and potential buyers of a productof service
Potential Market
A set of
consumers who
admits of having a
high level of
interest in non-
alcoholic beers.
Available Market
A set of
consumers who
have interest,
income and
access to buy non-
alcoholic beers.
Target Market
Qualified available
market that a
company wish to
pursue eg male
25-50 yrs non-
alcoholic
drinkers.
Penetrated
Market
the set of
customers who are
actually buying
non-alcoholic
beers. eg; males
30-45yr
CONSUMER
MARKETS
BUSINESS
MARKETS
NON-PROFIT
&
GOVERNMENT
MARKETS
INTERNATIONAL
MARKETS
DIFFERENT TYPES OF “MARKET PLACES”
Pure monopoly
1 company,
No competition
Usually
government
operated.
“BEC”
Oligopoly
Small number of
large firms
Highly competitive
Usually engage in
price war.
“Esso / Shell”
Monopolistic
Competition
Many companies
compete on the
basis of
differentiation or
low cost.
“Food stores”
Perfect
Competition
Many competitors.
Offer the same
product. Price is
usually the same.
“Conch Stand”
4 TYPES OF MARKET / INDUSTRY STRUCTURES
Marketing Analysis
DIFFERENT TYPES OF MARKETS
13. 13
TI
ESTIMATING CURRENT MARKET DEMAND
Total market potential
The total sales volume for a product (blue non-alcoholic beer 12 oz) that would be
purchased (cash, charge) by a defined customer group (non-alcoholic beer drinkers) in a
defined geographical area (Nassau & Family islands), in a defined time period (3-years) in
a defined marketing environment (economic boom) under a defined marketing program
(competitive pricing, personal selling and extensive distribution).
Eg: 50,000 drinkers x 24 bottles (per week) x $1.00 x 52 weeks x 3 years= $187,200,000
Total Area Potential
Nassau $150.000,00 family islands $37,200,000
Actual Industry Sales & Market Share
$ 31,000,000 Annually / We Want 35% Market Share In 3 Yrs
ESTIMATING FUTURE MARKET DEMAND
Survey Of Buyers’ Intention
A. Construct a purchase probability scale. Eg
Do you intent to buy a non-alcoholic beer within the next 3 years?
B. Sales Force Opinion: they might know about developing trends
C. Expert Opinion: Distributors, Suppliers, Trade Publications, and Consultants
D. Past Sales Analysis: determine a trend based on past company sales /industry sales
E. Market Testing: gave customers samples of non-alcoholic beer
0% 20% 40% 60% 80% 100%
little chance maybe certainly
Marketing Analysis
14. 14
SALES FORECASTING
FINANCE DEPT.
To determine how
much cash and
other funds are
needed for
investment and
operations
MARKETING
DEPT.
To determine how
much resources
are needed to
price, promote, sell
and distribute
products and
services
OPERATIONS
DEPT.
To determine how
much product and
supplies need to
be purchased,
produced or
stocked
HRM DEPT.
To determine how
much employees
would be needed
to be hired,
allocated or
deployed
IMPORTANCE OF SALES FORECASTING
Marketing Analysis
STEPS IN SALES FORECASTING
ESTIMATE MARKET DEMAND ESTIMATE COMPANY DEMAND
Eg: 50,000 drinkers x 24 bottles (per
week) x $1.00 x 52 weeks x 3 years=
$187,200,000
It is generally based on marketing
commitment for a product (expenditure
and effort). We should acquire about
35% of the market within a 3-year period
Multiply estimated market demand by estimated company
demand.
$187,200,000 x 35% = $65, 520,000 (3 years)
Each sales person will be assigned a
monthly quota of $4,500 or 225 cases
Estimates lower that sales forecast
Sales: $55,000,000
Purchases/ Expenses: 49,000,000
SALES POTENTIAL
SALES QUOTA SALES BUDGET
15. 15
CONSUMER BUYING PROCESS
Marketing Analysis
I am thirsty (need). I want a non-alcoholic
beer (N/A B). I demand that it be of high
quality and expect it to taste great.
1. NEED-AROUSAL
PersonalSource:a friend
CommercialSource:Advertising
Public Source:look at N/A B rating
Experimental Source:examine the
Product (look at label)
2. INFORMATION SEARCH
Which productsatisfies my needs?
What benefits am I receiving?
What bundle of attributes am I
receiving?
What is the bestbrand?
What is the bestprice?
3. EVALUATION OF
ALTERNATIVES
Attitudes
from
Others
Purchase
Intent
Unexpected
Situational
Factors
I will buy Top’s N/A B (Brand A)
I will buy from Value Depot (Vendor 2)
I will buy one (1) N/A B (Quantity)
I will pay cash (Payment –Method)
1 want it now (timing)
The benefits outweighs the price (value)
4. PURCHASE DECISION
The N/A B tasted great! (Satisfiedmy need)
I will always buy it (loyal customer)
5. POST – PURCHASE BEHAVIOR
16. 16
BUSINESS BUYING PROCESS
2. GENERAL NEED
DESCRIPTION
4. SUPPLIER SEARCH
3. PRODUCT
SPECIFICATION
My present supplier is
unprofessional (dissatisfaction)
I need to add a new type of non-
alcoholicbeer (N/A B) (product)
Drinks Unlimited must earn
$100,000 annually in sales
We must initially order no less
than 1,000 cases in that period
Drinks Unlimited wants to order a
high quality N/A B
It must costless than $23.00 per
case
It must be easy to sell
It must be packaged in a blue bottle
It must be securely packaged
The Internet / TV / Radio
Local or foreign Markets
Attend Trade Shows
Directory / Newspaper
Call-around
NEW BUY, MODIFIED RE-BUY, STRAIGHT RE-BUY
Marketing Analysis
1. PROBLEM
RECOGNITION
17. 17
5. PROPOSALS
SOLICITATION
7. ORDER –ROUTINE
SPECIFICATION
8. PERFORMANCE
REVIEW
6. SUPPLIER SELECTION
Ask for quotation
Invite suppliers to make
presentations and
demonstrations
Ask for samples
VALUE DEPOT
PRODUCT: Tops Non-Alcoholic Beer
N/A B’s quality --- excellent
Price of N/A B -- affordable
N/A B packaging --- blue bottle
Suppliers Reputation-- excellent
Supplier’s reliability--- excellent
Totalvalue -- high profit margin
1,000 cases of Tops N/A B were
ordered from Value Depot
The price was $ 22.00 per case
The N/A B is expected to be in the
warehouse within two (2) days
Value Depot delivered the N/A B
within two days
There were no short-shipment of
N/A B
No N/A B was damage
Customers love the N/A B
Marketing Analysis
18. 18
FACTORS AFFECTING
BUYING BEHAVIOR
1. CONSUMERS
Marketing Analysis
Culture
Subculture
Social class
CULTURAL
FACTORS
Work groups
Friends
Family
Roles
Status
Age
Occupation
Economic state
Lifestyle
Personality
Motivation
Perception
Learning
Attitudes
Belief
SOCIAL
FACTORS
PERSONAL
FACTORS
PSYCHOLOGICAL
FACTORS
What Do
They Buy?
Why Do They
Buy?
How Much
Do They
Buy?
How Do They
Buy?
When Do
They Buy?
How Often
Do They
Buy?
Where Do
They Buy?
MARKETING
RESEARCH
OBJECTIVES
19. 19
2. BUSINESSES
Focus on DECISION MAKERS (DM)
Marketing Analysis
Level of Demand
Economic outlook
Interest rate
Rate of technology
Political situation
Regulatory development
Competitive condition
Social responsibilityconcerns
Supplier’s reputation
Supplier’s reliability
Supplier’s bargaining power
ENVIRONMENTAL
FACTORS
Mission
Objectives
Strategies
Purchasing Policies
Budgets
Organizations Structures
Processes
Systems
Interest
Authority
Status
Empathy
Persuasiveness
Negotiation skills
Communication skills
Decision making skills
Age
Income
Education
Job position
Personality
Risk Attitudes
Culture
ORGANIZATIONAL
FACTORS
INTERPERSONAL
FACTORS
INDIVIDUAL
FACTORS
What Do
They Buy?
Why Do They
Buy?
How Much
Do They
Buy?
How Do They
Buy?
When Do
They Buy?
How Often
Do They
Buy?
Where Do
They Buy?
MARKETING
RESEARCH
OBJECTIVES
20. 20
3. UNDERSTAND BUYING ROLES
DETERMINE:
WHO ARE THE MAJOR DECISION PARTICIPANTS?
WHAT DECISION DO THEY INFLUENCE?
WHAT IS THEIR LEVEL OF INFLUENCE?
WHAT EVALUATION DO THEY INFLUENCE?
Market: Hotel
Marketing Analysis
Initiator:
The daughter
Gatekeeper:
The Mother
Influencer:
The brother
Buyer:
The father
User:
The whole family
Initiator:
Suggest the need to consider a
purchase e.g. Bartender
Gatekeeper:
Collects and distributes information:
e.g. Bar Manager
Influencer:
Attempts to affect the decision (may be
more than one) e.g. Financial
Controller
Buyer:
Makes the purchase e.g. Purchasing
Manager
User:
Uses the product (may be more than
one): e.g. Tourist
CONSUMERS BUSINESSES
21. 21
MARKET SEGMENTING, TARGETING &
POSITIONING (STP)
MARKETING SEGMENTING
Market segmenting involves aggregating prospective buyers into groups that:
1. Have common needs (homogeneity)
2. Will respond similarly to marketing actions
INTEGRATION BETWEEN MARKET RESEARCH, SEGMENTING
TARGETING AND POSITIONING
MARKET RESEARCH
Identifying needs & priorities requirements:
Benefits in terms of:
Product Features
Expense
Quality
Savings in time and convenience
MARKET SEGMENTING
Linking needs to Actions:
Customer needs are met by organizations’ efforts to satisfy
those needs, profitably!
Using Market- product grid:
Consumer market.............. Retail offer (12 oz bottles)
Business market...................... Wholesale offer (12 oz cans)
Marketing Planning
22. 22
MARKET SEGMENTATION PROCESS
MARKET TARGETING
Must be profitable
High return on investment (ROI)
MARKET POSITIONING
1. Establish a Competitive Strategy
2. Determine Differentiating Strategy
3. Decide on Positioning Statement
4. Select appropriate Marketing Mix :Product , Price, Place,
Promotion, People, Physical Evidence, Process
1. REVIEW MARKETING RESEARCH RESULTS
Potential Customers wants beer to be packaged in a blue
bottle......................
Marketing Planning
23. 23
2. IDENTIFY THE BASES FOR SEGMENTING &
PROFILE POTENTIAL TARGETED CUSTOMERS
CONSUMER MARKETS
By Consumer
Characteristics:
A. Demographic
Age (Men 25-50, Women 20-30),
Sex (Male & Female)
B. Geographic
Nassau, Grand Bahama & Abaco
C. Psychographic
Out- going adults
By Buying Situations / Behaviour
A. Benefit Sought
12 oz bottles, high quality & great taste
B. Usage (user rate, type)
Heavy drinkers, regular drinkers
C. Buying Condition
Like to compare beer quality
D. Loyalty Status
70%
BUSINESS MARKETS
A. Industry
Monopoly, Monopolistic Competition,
Oligopoly or Perfect Competition
B. Geographic
Nassau & Grand Bahama & Abaco
C. Demographic
Size: small & large companies, All types of
Business (Hotels, Restaurants, Bars etc)
D. Buying Situation / Behaviour
Centralize or decentralize buying
New buy, Modified re-buy or Straight re-buy
E. Products Sold or Services Offered
Food, Beverage, Financial, Professional
CRITERIA FOR EFFECTIVE
MARKET SEGMENTATION
Measurable
Actionable
Profitable (sustainable)
Growth potential (& stability)
Size
Homogeneity (& Differentiated)
Marketing Planning
24. 24
3. IDENTIFY POSSIBLE MARKETS AND “TEST THEM”
HOTEL, MOTELS , RESTAURANTS......... & 10 OTHERS
CRITERIA FOR EFFECTIVE MARKET SEGMENTATION
Measurable: The size, purchasing power, and characteristics could be and evaluated
Actionable: Marketing mix could be coordinated to attract, maintain and retain customers
Profitable (sustainable): the benefits out weights all costs of serving market
Size & growth potential (& stability): it is large and not declining fast
Accessible: could be efficiently reached and service
Homogeneity (& Differentiated): They are conceptually distinguishable from each other
4. DIVIDE PERSPECTIVE BUYERS INTO GROUPS & DETERMINE
MAJOR NEEDS, BUYING BEHAVIOR & PAYMENT METHOD
GROUP 1
HOTELS / MOTEL
&
RESTAURANTS
MAJOR NEED
Can & bottle non-
alcoholic beer & low
wholesale prices
BUYING
BAHAVIOUR
Who (purchasing
manager , what,
when, where, why,
how(... by P O),
how much
PAYMENT
METHOD
35-45 days
GROUP 2
LIQUOR
STORES
&
BARS
“Conduct the same
analysis as
group 1”
GROUP 3
FOOD
&
CONVENIENCE
STORES
“Conduct the same
analysis as
group 1”
GROUP 4
FAMILY ISLANDS
“Conduct the same
analysis as
group 1”
NOTE
I AM NOT CONCERN ABOUT
PERSONAL CONSUMPTION
(CONSUMERS)...ONLY BUSINESS
CUSTOMERS. ALSO I CAN ONLY
FORESEE 4 GOOD SEGMENTS
Marketing Planning
25. 25
MARKET
PRODUCT
TYPE 1
PRODUCT
TYPE 2
PRODUCT
TYPE 3
Hotel / Motels &
Restaurant
12 oz cans
12 oz bottles
SIZE OF
MARKET
30 Hotels
50 motels
100 restaurants
12 oz bottles 20 oz bottles
Group 2
Group 3....4
MARKET TARGETING PROCESS
5. DEVELOP MARKET PRODUCT GRID & ESTIMATE SIZE OF MARKETS
1 (A). DECIDE ON A MARKET COVERAGE STRATEGY
MASS
MARKETING
“Undifferentiated”
The whole Bahamas
w/sale:
1cs of Beer $24.00
Retail:
$1.25 (suggested)
PROFIT MARGIN
5%
ROI
2%
SEGMENTING
MARKETING
“Differentiated”
Dividing up The
Bahamas
Nassau:
$22.00 (w/sale)
Family Is:
$22.50 (w/sale)
PROFIT MARGIN
15%
ROI
10%
NICHE
MARKETING
“Concentrated”
“
Only one group
Hotels /Motels
& Restaurants
$21.50 (w/sale)
PROFIT MARGIN
10%
ROI
5%
MICRO-
MARKETING
“Fully focused”
Only one customer
Sun Atlantis
$20.00 (w/sale)
15-day credit
PROFIT MARGIN
8%
ROI
2.5%
Marketing Planning
26. 26
1(B). SELECT TARGET MARKETS BASED ON THE FOLLOWING FACTORS
MARKET
ATTRACTIVENESS
ROI
Profitability
Size
Product demand
Growth
Risk
Market structure
Life cycle
COMPANY OBJECTIVES
Growth?
Stability?
Profit Maximization?
Increase market share?
Harvest?
COMPANY RESOURCES
& CAPABILITIES
Human Resources
Marketing
Production
Financial
Management
Other
MARKET
COMPETITIVENESS
Rivalry amongst
competitors
Amount of substitute
products
Buying power of suppliers
Buying power of buyers
Threat (barriers) of new
entry
2. DECIDE ON TARGET MARKETS (S) & MAKE FINAL DECISION ON THE
LEVEL OF COMMITMENT (Resources) TOWARDS EACH ONE
GROUP 1
HOTELS / MOTELS
&
RESTAURANTS
LOC
35%
GROUP 2
LIQUOR
STORES
LOC
30%
GROUP 3
FOOD
&
CONVENIENCE
STORE
LOC
20%
GROUP 4
FAMILY
ISLANDS
LOC
15%
Marketing Planning
27. 27
MARKET POSITIONING
A product position is the set of perception, impressions and feelings that
customers have for that product compared with, (or relative to) competing
products
1. DEVELOPING A COMPETITIVE STRATEGY
A. IDENTIFY YOUR INDUSTRY STRUCTURE
An industry is a group of firms that offer a product or class of products that are
close substitute for each other. DRINK’S UNLIMITED is in the wholesale food
and beverage industry.
MONOPOLY OLIGOPOLY MONOPOLISTIC
COMPETITION
PERFECT
COMPETITION
Only one company
offer a product or
service
e.g. B.E.C
A small number of
large companies
selling the same
product or service
e.g. SHELL LTD
Many companies
offering the same
product and service
but differentiating their
offer
e.g. BAHAMAS
BEVERAGES
Many companies
offering the same
product but not
differentiating the offer
e.g. FISHERMAN
Marketing Planning
28. 28
B. PROFILE YOUR COMPETITION
MARKETING MIX STRATEGY
COMPETITION PROFILE
Name:
Bahamas Beverages
Current Reputation:
Honest, reliable………….
Image & Values:
High quality, premium price……
Current Vision:
To be industry leader…………
Major Objective:
To gain 50 % market share...
Major Strategy
Product development…..
Major Strength:
Competent General Manager
Major Weakness:
High staff turnover
Major product or service
Cools Non-Alcoholic beverage
Marketing Planning
29. 29
C. FIND OUT YOUR “COMPETITORS’ SHARE”
COMPETITOR: Bahamas Beverages
D. RESEARCH YOUR COMPETITIONS’ POSITION
IN TARGET MARKET
E. EXAMINE COMPETITORS’ REACTION PATTERNS
TO MARKET CHANGES
SHARE OF MARKET SHARE OF MIND SHARE OF HEART
Bahamas Beverage holds
43% of the Non-Alcoholic
Beverage Wholesaling
market
In a recent survey, 25% of
non-alcoholic retailers stated
that they are familiar with
Bahamas Beverage
In a recent survey, 30% of
non-alcoholic retailers stated
that they are familiar with
Bahamas Beverage
DOMINANT
PROACTIVE
AVERAGE
REACTIVE
WEAK
AD -HOC
Bahamas Beverage
Bahamas Beverage
Marketing Planning
30. 30
F. CHOOSE APPROPRIATE COMPETITIVE STRATEGY
MARKET LEADER MARKET CHALLENGER MARKET FOLLOWER
EXPAND TOTAL MARKET
Attract new users
Target young women
Create new use
Mix non-alcoholic beverage
with soda
Create Usage rate
Increase sales promotion
DEFEND MARKET SHARE
Always conduct research
Always improve products
High distribution coverage
Improve marketing efforts
Cut Prices
Continuous improvements
The best defense is a good
offense
E.g. Coke, Microsoft
IMPROVE
MARKET SHARE
Attack the Market leader
with:
Better quality product
Better packaging
Lower listed cost
Better payment terms
Better volume discounts
Intensive advertising
campaign
Better sales promotion
Better after-sale services
Better customer services
Innovative distribution
channels
Smother processes
Serve neglected market
needs
Price -discounts
Larger product variety
Target small markets that are of
little interest to larger firms
through specialization
E.g. Logitech producing a
variety of computer mouse (3-
D, cordless etc.)
The market -nicher achieves
high margins by serving:
One customer type /size
Customers with one product
or service
INNOVATIVE IMITATION
Counterfeiter
Duplicates the leader’s product
and packaging.
E.g. Rolex
Cloner
Emulates the leader’s name and
packaging with slight variations
E.g. Cereals
Imitator
Copies some things from the
leader but maintain
differentiation in terms of
packaging, advertising, and
pricing.
E.g. Cola sodas
Adapter
Take leader’s products and
adapts or improve it.
E.g. Many Japanese products
MARKET - NICHER
Marketing Planning
31. 31
2. PRODUCT DIFFERENTIATION
1. DEFINING THE CUSTOMER VALUE MODEL
CRITICAL SUCCESS FACTORS
The most important services that would influence non-alcoholic beer retailers
Volume discount incentives and credit facilities
Fast deliveries
High inventory (always have stock)
The most important product features that would influence non-alcoholic beer
drinkers
Beer-like taste
Smooth and refreshing
Low calories
2. BUILDING THE CUSTOMER VALUE HIERARCHY
A. BASIC
Beer-like taste
B. EXPECTED
Volume discount incentives and credit facilities
C. DESIRED
Fast deliveries
D. UNEXPECTED
High inventory (always have stock)
The most important product features that would influence non-alcoholic beer drinkers
smooth and refreshing
low calories
3. DECIDE ON THE CUSTOMER VALUE PACKAGE
Volume discount incentives and credit facilities: Customer Benefits………….
Fast deliveries ; Customer Benefits…………….
v
Marketing Planning
32. 32
4 MAJOR DIFFERENTIATION VARIABLES
1. PRODUCT
SIZE, SHAPE & PHYSICAL
STRUCTURE
Tops non-alcoholic beer is
packaged in a 12 oz bottle
CHARACTERISTICS THAT
SUPPLEMENT THE
PRODUCT BASIC
FUNCTION
Tops is easy to open because of
it special cover
FORM FEATURES
PERFORMANCE
QUALITY
THE LEVEL AT WHICH
THE PRODUCT
OPERATES:
low, average, high
or superior
THE DEGREE TO WHICH
ALL PRODUCTS ARE
IDENTICAL AND MEET
THE PROMISED
SPECIFICATION
All Tops non-alcoholic
beers taste the same
the same
TO WHAT EXTENT A
PRODUCT HAVE AN
USEFUL LIFE UNDER
NATURAL OR STRESSFUL
CONDITION
A MEASURE OF THE
PROBABILITY THAT A
PRODUCT WILL NOT
MALFUNCTION OR FAIL
WITHIN A SPECIFIED
TIME PERIOD
Tops is always fresh for 6 mths
CONFORMANCE
QUALITY DURABILITY RELIABILITY
A MEASURE OF THE EASE
OF FIXING A PRODUCT
WHEN IT MALFUNCTIONS
OR FAILS
REPAIRABILITY STYLE DESIGN: Integration
A DESCRIPTION OF HOW
A PRODUCT LOOKS AND
FEEL TO THE BUYER
Market Research results
indicates that customer love tops
“blue” bottle
THE TOTALITY OF FORM
FEATURES, QUALITY,
DURABILITY, RELIABILITY,
REPAIRABILITY, AND
STYLE CHARACTERISTICS
THAT AFFECT HOW A
PRODUCT LOOKS AND
FUNCTIONS IN TERMS OF
CUSTOMER
REQUIREMENTS
Marketing Planning
33. 33
2. SERVICES
HOW EASY IT IS TO
PLACE AN ORDER
WITH A COMPANY
Orders can be placed by
e-mail, fax , or through
salespeople
ORDERING EASE
HOW QUICKLY AND
ACCURATELY
PRODUCTS ARE
DELIVERED TO
CUSTOMERS
“We deliver within 24 hrs
(locally)”
WORK DONE TO MAKE A
PRODUCT OPERATIONAL
IN ITS PLANNED
LOCATION
DELIVERY INSTALLATION
CUSTOMER
TRAINING
CUSTOMER
CONSULTING
MAINTENANCE &
REPAIR PROGRAMS
TRAINING THE
CUSTOMER’S
EMPLOYEES TO USE THE
VENDOR’S EQUIPMENT
EFFECTIVELY AND
EFFICIENTLY
DATA, INFORMATION
SYSTEMS AND ADVISORY
SERVICES THAT THE
SELLER OFFERS TO THE
BUYER
THE VARIOUS “AFTER -
SALES” PROGRAMS THAT
KEEP PRODUCTS IN
GOOD WORKING
CONDITION
NOTE: WHAT ABSTRACT ATTRIBUTES CAN WE
DIFFERENTIATE?.........WARRANTEE....
............GOOD FEELINGS..?
CUSTOMER CAN BE
REWARDED FOR
SPENDING OVER A
CERTAIN LIMIT,
CUSTOMER CAN BE
GIVEN AN AWARD FOR
IDEAS TO IMPROVE
EXISTING PRODUCTS
LOYALTY
PROGRAMS
Marketing Planning
34. 34
3. EMPLOYEE (PEOPLE) DIFFERENTIATE
PLANNING
They set goals that are
Specific, Measurable,
Attainable, Rewarding and
Time-oriented
They motivate individuals to
accomplish both company and
personal goals in an effective
and efficient manner
They allocate and deploy
resources in an effective
manner so that work can be
perform in an efficient
manner
They possess the required skills,
techniques, abilities and
knowledge
They share information, are
good listeners, interpreters, ask
questions, observe, take notes
and be silent when appropriate
They are honest, have high
morals and are trustworthy
LEADERSHIP ORGANIZING
COMPETENCE COMMUNICATION CREDIBILITY
RESPONSIVENESS DECISION MAKING
They perform the service
consistently, accurately and
diligently
They respond quickly to
customers’ needs, concerns,
complaints and problems
They make decisions quickly
and strategically to solve
problems / challenges and take
advantage of opportunities
RELIABILITY
COURTESY
They are friendly, respectful,
and considerate
Marketing Planning
35. 35
4. DISTRIBUTION
Use the best marketing channel. Deliver on weekends up to 3: 00 pm, same day delivery
etc.
5. IMAGE
Use unique symbols, use quality product brochures, catalogs, business cards and
stationary. Retail location is very organized and warehouse is very clean. The company
sponsors an annual Fun -Walk event.
.
POSSIBLE POSITIONING STRATEGIES
TOPS NON-ALCOHOL BEER
1. PRODUCT
ATTRIBUTES
Smooth & Affordable
2. PRODUCT NEED
A light refreshing beverage
3. PRODUCT BENEFITS
taste great with the best ingredients
4. OCCASION
Drink as a substitute for beer
at parties
5. USER
For persons who want a
beer taste, but not the
alcohol
6. AGAINST THE COMPETITION
Tops non-alcoholic beer taste far better
that Beck’s non-alcoholic beer
7. PRODUCT CLASSES
Its light but not a light beer
8. QUALITY OR PRICE
IT HAS THE BEST
INGREDIENTS AND IT
GIVES THE BEST VALUE
FOR MONEY
9. AWAY FROM COMPETITION
It taste as good as alcoholic beer, but it
is not!
Marketing Planning
36. 36
PERCEPTUAL MAPPING
“Tops non-alcoholic beer cost more (higher price) than other beers but it uses better
ingredients (quality)”.....which results in lower calories and a better taste!
POSITIONING STATEMENT
“ POSITION PRODUCT ON PERCEIVED BENEFIT”
CONSUMER MARKET
“Tops non-alcoholic beer do not sacrifice taste for less value”. It cost a few pennies more
but it’s worth the try”
BUSINESS MARKET
“ Tops non-alcoholic beer is of high value - it is for consumers who wants better
ingredients in their non-alcoholic
LOWER
PRICE
HIGH
QUALITY
LOW
QUALITY
HIGHER
PRICE
X Tops
non-alcoholic
beer
Marketing Planning
Beck’s
non-alcoholic
beer
37. 37
MARKET TARGETING PROCESS (SUMMARIZED)
1. DECIDE ON COMPETITIVE AND DIFFERENTIATION STRATEGY (S) , THEN
DEVELOP POSITIONING STRATEGY(S) & STATEMENT FOR PRODUCT (S)
COMPETITIVE
STRATEGY
“MARKET
CHALLENGER”
DIFFERENTIATION
STRATEGY
PRODUCT
“Quality”
SERVICE
“Ordering ease
& quick delivery”
PEOPLE
Professional & dependable
POSITIONING
STRATEGY
“Attributes”
POSITIONING
STATEMENT
“ Tops non-alcoholic beer is of
high value - it is for consumers
who wants better ingredients in
their non-alcoholic beer”
2. SET S.M.A. R.T MARKETING OBJECTIVES &
DEVELOP APPROPRIATE MARKETING STRATEGIES & TACTICS
Specific. Measurable.
Attainable.
Rewarding. Time-oriented
OBJECTIVES
Sales
Profit
Market Share
MARKETING
STRATEGIES
E.G
1. Stimulating primary
demand by increasing:
(a) The number of users/buyers
(b) The rate of purchases
2. Stimulating selective demand
by:
(a) Retaining current customers
(b) Acquiring new customers
(competitors/ adopters)
MARKETING
TACTICS
Product
Price
Place
Promotion
People
Physical Evidence
Process
Marketing Planning
38. 38
DEVELOPING
“SMART” MARKETING OBJECTIVES
REVIEW YOUR MISSION
Marketing Planning
Why our business exists?
Which stakeholders are of
major significance to us?
How will we compete?
How committed are we to
markets, products etc?
What are our business
principles?
What do we believe in?
What type of policies &
procedures do we have?
What is success /failure?
DRINKS UNLIMITED MISSION STATEMENT
BRIEF: IT IS EASY TO UNDERSTAND & REMEMBER
FLEXIBLE: IT SHOULD BE ABLE TO ACCOMMODATE CHANGE
DISTINCTIVE: IT SHOULD MAKE THE BUSINESS STAND OUT
“ We always want to motivate our employees,
delight our customers and provide a fair monetary
return for our shareholders”
PURPOSE STRATEGY & SCOPE
VALUES & CULTURE
STANDARDS &
BEHAVIORS
39. 39
OBJECTIVE-SETTING
All objectives should be SMART i.e. Specific, Measurable,
Achievable, Realistic, and Time-oriented.
Specific - Be precise about what you are going to achieve
Measurable - Quantify you objectives
Achievable - Are you attempting too much? Do you have the
resource to make the objective happen (men, money,
machines, materials, minutes)?
Rewarding – Willit the organization better off ?
Time-Oriented - State when you will achieve the objective
(within a month? By February 2010?)
. PROFITABILITY OBJECTIVES
To achieve a 20% return on capital employed by August 2007.
MARKET SHARE OBJECTIVES
To gain 25% of the family island market for Top’s non-alcohol beverage (TB) by
September2007
PROMOTIONAL OBJECTIVES
To increase awareness of the quality of TB from 12% to 25% by June 2006
OBJECTIVES FOR SURVIVAL
To survive the current double-dip recession
OBJECTIVES FOR GROWTH
To increase the size of our non-alcoholic beverage productline from $200,000 in
2006 to $400,000 in2007
OBJECTIVES FOR BRANDING
To make Top’s non-alcoholic beer the preferred brand of 21-28 year old males in
family island market by February 2006
NOTE:
There are many examples of objectives.Be careful not to confuse objectiveswith
goals and aims. Goals and aims tend to be more vague and focus on the longer-
term. They will not be “SMART”. However, many objectives start as aims or
goals and therefore they are of equal importance.
Marketing Planning
Marketing Planning
40. 40
IF YOU ARE NOT SETTING GOALS THAT ARE SPECIFIC, MEASURABLE
ATTAINABLE, REWARDING AND TIME -LIMITED (SMART) THEN YOU
ARE SETTING “DUMB GOALS”
“SMART” GOAL: “WE WANT TO INCREASE SALES BY 20% ($5,000.00) IN
THE WESTERN DISTRICT OF NASSAU, BY 30TH DECEMBER, 2007!”
“ SMART” GOAL- GETTING
SPECIFIC
A PERFORMANCE GOAL (OBJECTIVE) MUST BE EXPLICIT WITH A SINGLE KEY
RESULT. IF MORE THAN ONE RESULT IS TO BE ACCOMPLISHED, MORE THAN ONE
OBJECTIVE SHOULD BE WRITTEN. JUST KNOWING WHAT IS TO BE ACCOMPLISHED IS
A BIG STEP TOWARD ACHIEVING IT.
GOAL EVALUATION:
A SINGLE KEY RESULT IS EXPECTED: “WE WANT TO INCREASE SALES. ………….. IN
THE WESTERN DISTRICT OF NASSAU……………………….”
MEASURABLE
A PERFORMANCE GOAL (OBJECTIVE) MUST BE ABLE TO QUANTIFY, ASSESS AND
EVALUATED
GOAL EVALUATION:
IT IS QUANTIFIABLE: “……… BY 20% ($5,000.00)………………………….”
ATTAINABLE
A PERFORMANCE GOAL (OBJECTIVE) MUST BE ACHIEVABLE WITH THE RESOURCES
THAT ARE AVAILABLE. IT MUST BE REALISTIC.
GOAL EVALUATION:
ACHIEVABLE AND REALISTIC: BECAUSE WE ARE FINANCIALLY SOUND
Marketing Planning
41. 41
MARKETING STRATEGIES & TACTICS
REWARDING
A PERFORMANCE GOAL (OBJECTIVE) MUST BE RESULT-ORIENTED. THE
SUCCESSFUL COMPLETION OF THE GOAL SHOULD EITHER INCREASE SALES,
MARKET-POSITION, AND PROFITS; IMPROVE STAFF MORAL AND WORKING
CONDITIONS; OR IMPROVE QUALITY AND VALUE.
GOAL EVALUATION:
THE SUCCESSFUL COMPLETION OF THE GOAL WILL INCREASE PROFITS AND
MARKET SHARE
TIME- LIMITED
A PERFORMANCE GOAL (OBJECTIVE) MUST BE TRACEABLE. IT MUST BE TIME –
ORIENTED SO THAT IT COULD BE EVALUATED TO DETERMINE IF IT IS GOING TO BE
ACHIEVED WITHIN A SPECIFIC TIME FRAME.
GOAL EVALUATION:
TIME-ORIENTED: “………BY 30TH DECEMBER 2007!”
Marketing Planning
42. 42
POSITING STATEMENT
BUSINESS MARKET
“ Tops non-alcoholic beer is of high value - it is for consumers who wants better
ingredients in their non-alcoholic beer
SCENARIO 1. STIMULATING PRIMARY & SELECTIVE DEMAND
(A) Primary demand is demand for the basic product or service form or class.
(B) Selective demand represents demand for the company’s specific product or
brand (or competitors’ product or service)
MARKETING STRATEGIES FOR STIMULATING PRIMARY DEMAND
Target market: Hotels/ Motels & Restaurant
Aim: to increase the level of demand for a product form or class by current users or
nonusers
Primary-Demand Strategies Programs for implementing strategies
1. Increase number of users / buyers
by:
(a) Increasing willingness to buy
(b) Increase ability to buy
2. Increase the rate of purchases/usage
(a) Advertise benefits of drinking Tops non alcohol
beer
(a) Develop product-line extensions by offering
Tops in 20 oz cans to hotels etc.
(b) Reduce price
(b) Have sales promotion
(b) Provide credit facilities & flexible payment
terms
(b) Delivering Tops on weekends from our
company’s retail location (broader
distribution)
(b) Always keeping a high inventory of Tops
(a)Provide information about Alternative use for
Tops (e.g. Use with soda or tonic water)
Marketing Planning
43. 43
(a) Broadening product usage
(b) Increasing product consumption
levels
(c) Encourage Replacement due to product
redesign
(b) Periodically offer special volume discounts
so that the final consumer can buy more
(b) Repackage tops with handles so the final
consumer can buy in six packs
(b) Tell buyers that Tops have a “born on date” so
that the final consumers can see that Tops is fresh
(new benefit)
(c) Repackage Tops with an easier screw of
bottle cap and redesign it with a “Pepsi
Cola shape”
MARKETING STRATEGIES FOR STIMULATING SELECTIVE DEMAND
Target Market: Liquor & Convenience Store
Selective -Demand Strategies Programs for implementing strategies
1. Retention of customers by:
(A) Maintaining customer satisfaction
(B) Simplifying the buying process
(C) Reduce attractiveness of or the
(a) Advertise quality
(a) Advertise familiarity
(a) Redesign product (if Necessary)
(a) Provide special services
(a)Solve customers complaints (timely)
(a) Listen to customers needs (survey)
(a Go the extra mile
(a) Justify price increases
(b) Provide superior delivery
(b) Offer bundles of products (specials)
(b) Increase selling hours
(b) Provide extended credit facilities and
flexible payment terms
(b) Improve ordering and selling process
(b) Provide up dates on product lines
(c) Develop brand extension (Tops light)
Marketing Planning
44. 44
opportunities for switching
2. Acquisition of customers (new ones or
competitors)
(A) Head to head positioning
(with competition)
(B) Differentiated positioning
(c) Reduce price for volume purchase
(c) Frequent sales promotions
(c) Reduce price when competitors reduce price
(c) Give customers incentives (coupons etc.)
(a) Develop superior features on determinant
attributes
(a) Reduce prices
(a) Stress product competitive benefits
(a) Advertise more in best media (best appeal)
(a) Improve / Increase distribution channel
(b) Design and promote unique benefits
(b) Use unique strategies in : Product, Price,
Place, Promotion, People, Physical,
Evidence, Process
SCENARIO 2. PRODUCT CLASSIFICATION STRATEGIES
Tops non alcoholic beer is classified as a “convenience good’’ people purchase
frequently and with minimum of shopping effort
MARKETING MIX MARKETING STRATEGY
PRODUCT POSITIONING Benefits or against competition
PRICE Very low or competitive, volume discounts
PLACE (Distribution) Try to get in many outlets (wholesale and retail)
PROCESS Easy to buy
PEOPLE Well trained to sell product
PHYSICAL EVIDENCE Purchase uniforms with Tops’ Logo and brand name
SCENARIO 3. NEW PRODUCT FORM OR BRAND STRATEGIES
Marketing Planning
45. 45
STAGE OF PROCESS ACTIVITY INSTRUMENTS AND
INFORMATION
1. New product strategy
development: “we want a
product that will increase
sales and profits”
Conduct market research Look for new market and
Conduct PEST and SWOT
Analysis
2. Idea generation We notice that Sun
manufacturing was selling
a lot of non-alcohol & light
beers
We ask the sales team and
conducted a focus group
3. Idea screening After reviewing our skills,
resources and capabilities
and potential suppliers -a
new non alcohol beer seem
more attractive
Evaluate benefit and cost of new
product. Also look at pricing, cost
and potential value to customers
4. Concept Development &
Testing
Concept 1: clear bottle
Concept 2: green bottle
Concept 3: blue bottle
Development & Testing:
concept 2 was a big
winner with focus group
Focus group answered questions
on design, colour, taste and
pricing level
5. Business & marketing
analysis
Product features: blue
bottle with “Pepsi cola”
shape
Marketing Strategy: price
low and position on
benefits. Evaluate all 7 Ps
Financial Projections:
1,000 cs per month for first
6 months @ $21.00
Cost $14.00 (landed cost).
Prepare budget.
Analyze all cost involved, contact
supplier, look at sales potential,
profit margin
(Cost, volume, profit relationship)
6. Product Development Contact distributor; tell
him that 500 cases of
Survey customers and do a
“intention to buy” analysis
46. 46
Tops non-alcoholic beer
are needed. Analyze how
long it take to produce and
reach. Let customer taste
product again
7. Market testing The product is packaged
with Tops brand name.
Sales people begin to sell
products to selective
markets. The hotels
brought most of the beers
and would buy more if it
came in 12 oz cans. 500
cases of beers were sold in
20 days
Conduct taste test at potential
customers’ locations. Conduct
sales promotion, change pricing
level when necessary
8. Commercialization Segment market. Used
market penetration
pricing strategy. Sales
force sold 1,200 cases
during first month.
Increase customers’
ability and willingness to
buy beer
Look at sales records. Find out
where product are selling most
SCENARIO 4. MARKETING STRATEGIES BASED ON INDUSTRY LIFE
CYCLE ( “NON ALCOHOL BEER INDUSTRY”)
MARKETING
MIX
Introduction Growth Maturity Decline
Product High quality High quality High quality High quality
Price Low Competitive What market
can bear
Low
Place Intensive Intensive Intensive Intensive
Promotion Big budget Big budget Moderate
budget
Small
budget
Marketing Planning
Marketing Planning
47. 47
SCENARIO 5. PRODUCT PORTFOLIO MAJOR STRATEGIES
High market share /high growth market
STAR
Product & Services
Reinforce quality image. Develop customer
loyalty program
Price
Use competitive pricing. Refine credit facilities
and payment terms
Place
Extent distribution / build distribution
partnership with customers /increase inventory
Promotion
Educate customers on how to use product more
efficiently. Stress quality/benefits
Low market share/high growth market
QUESTION MARK
Product & Services
Deliver on promises /increase customer service
performances
Price
Set price low or base on perceived value
Place
Increase distribution of products by customers.
Be innovative
Promotion
Communicate benefits and differentiate brand
High market share /Low growth market
CASH COW
Product
Maintain performance and conformance
quality
Price
Reduce price, extend more credit. Increase
discount for volume buying
Place
Distribute to new (profitable) markets.
Maintain high inventory
Promotion
Increase all sales promotion activities, remind
customers about benefits. Encourage new
usage
Low market share/Low growth market
DOG
Product
Properly package, brand, label. Make sure
product have performance and conformance
quality
Price
increase facilitating services (credit facilities,
easy payment method / terms
Place
Increase distribution of products by customers.
Be innovative
Promotion
Position away from competition, inform
customers about benefits
48. 48
SCENARIO 5. CONSUMER ADOPTION PROCESS STRATEGIES
Promotional Strategies Impact
STAGE IN ADOPTION
PROCESS
Advertising Publicity
Material
Sales
Promotion
Personal
Selling
1. Awareness: the
consumer becomes aware
of Tops
2. Interest: The consumer
is stimulated and seek
information about Tops
HEAVY HEAVY MODERATE NON-
FACTOR
3. Evaluation: The
consumer consider whether
to try Tops MODERATE HEAVY HEAVY LIGHT
4. Trial: The consumer
tries Tops to determine its
value LIGHT MODERATE HEAVY MODERATE
5. Adoption: The
consumer decides to
purchase Tops regularly
NON-
FACTOR LIGHT MODERATE HEAVY
SCENARIO 6. MARKETING STRATEGIES BASED ON MARKET LIFE
CYCLE ( “HOTEL MARKET”)
MARKETING
MIX
Introduction Growth Maturity Decline
Product High quality High quality High quality High quality
Price Low Competitive What market
can bear
Low
Place (distribution) Intensive Intensive Intensive Intensive
Promotion Big budget Big budget Moderate
budget
Small
budget
SCENARIO 7. MARKETING STRATEGIES BASED ON MARKET DEMAND
Marketing Planning
Marketing Planning
49. 49
DEMAND STATE MARKETING STRATEGY
Negative Demand
1. All beer products are bad for people
Conversional Marketing
1. Non -alcoholic beers will decrease the need
to drink alcoholic beer
No Demand
2. I am not interested in non-alcoholic
beers
Stimulating Marketing
2. Non-alcoholic beers is healthier to drink than
alcoholic beers
Latent Demand
3. I want a non-alcoholic beer to have the same
taste as beers -but not with the alcohol
Developmental Marketing
3. Non-alcoholic beers are brewed with the
same strength as regular beer but is one step
away from having ingredients that contain
alcohol
Declining Demand
4. Tops sales have drop from 2,000 cs to 1,500
cs within three months
Re-marketing
4. We will reduce price and increase sales
promotional activities
Irregular Demand
5. Tops sales are much higher in the summer
than other seasons
Synchromarketing
5. We double sales promotional activities in the
spring, fall and winter seasons
Full Demand
6. We can hardly keep up with supplying our
customers. Tops is selling enormously
Maintenance Marketing
6. We will make sure Tops maintain its good
taste; and keep on surveying our customers to
measure how satisfy they are with our services
Overfull Demand
7. We cannot keep up with supplying our
customers. Tops is selling too much
Demarketing
7. We will stop advertising and having sales
promotions
Unwholesome Demand
8. Non -alcoholic beers cause people to have
“tito disease”
Counter-marketing
8. Produce ads indicating how our company is
going to contribute to finding a cure for the
disease. Take Tops of the market
Marketing Planning
50. 50
SCENARIO 8. CONSUMER METAL PROCESSES (AIDCA) STRATEGIES
Promotional Strategies Impact
STAGE IN
AIDA MODEL
Advertising Publicity
Material
Sales
Promotion
Personal
Selling
Arousing
Attention
(Understanding
the benefits)
HEAVY HEAVY MODERATE NON-
FACTOR
Gaining
Interest
(Understanding
the benefits)
MODERATE HEAVY HEAVY LIGHT
Stimulate Desire
(Wanting the
benefits)
LIGHT
MODERATE HEAVY MODERATE
Creating
Action
(Obtaining the
benefits)
NON-
FACTOR LIGHT
MODERATE HEAVY
SCENARIO 9. MATCHING NEEDS TO SOLUTIONS
NEEDS
FOUR CS
SOLUTIONS
4 Ps
Customer needs Products
Customer cost Price
Convenience Place
Communication Promotion
51. 51
SCENARIO 10. PRODUCT LIFE CYCLE MARKETING STRATEGIES
CHARACTERISTICS Introduction Growth Maturity Decline
Sales 1,000 cs 4,000 cs 6,000 cs 5,000 cs
Cost to keepcustomer
$19.00 $17.00 $15.00 $16.00
Profits per case $3.00 $5.00 $7.00 $6.00
Competing products 10 15 17 14
MARKETING
STRATEGIES
Product Tops 12oz
cans/bottles
Tops 12oz,
16oz
cans/bottles
Tops 12oz
16oz
cans/bottles
with new
features
Tops 12oz
cans/bottles
with new
features
Price $22.00 per cs
limited credit
$21.00 per
cs , more
discounts
$21.50 $20.50
increase
volume
incentives
Place Hotels, Motels
Restaurants, C
& Liquor stores
Hotels,
Motels
Restaurants,
C & Liquor
stores
family Is
Hotels.
Motels
Restaurants,
Liquor
stores,
Family Is,
Caribbean
Hotels.
Restaurants &
Liquor stores
Promotion Inform
customers about
Tops’ great
taste
Persuade
customers
that Tops is
more tasty
than Becks
Remind
customers
that Tops
still has a
great taste
Increase sales
promotion to
keep loyal
customers
ADOPTION
CATEGORIES
(Customers)
Innovators
(2.5%)
Early Adopters
(13.5%)
Early
Majority
(34%)
Late
Majority
(34%)
Laggards
(16%)
Marketing Planning
52. 52
SCENARIO 11. INDUSTRYSTRUCTURE AFFECTS ON MARKETING
STRATEGIES
Industry Structure
Important
Factors
Perfect
Competition
Monopolistic
Competition
(Tops Beer)
Oligopoly Pure
Monopoly
Number of
sellers
Numerous Many Few One
Unrestricted
entry and exits
Yes Yes Partial No
Long-term
economic
profits
No Not for most
companies
Yes Yes
Marketing
Mix
Product
Differentiation
None Considerable Frequent None
Ability to set
price
None Some Some Considerable
Placement
(Distribution)
channels)
Can have
numerous
Can have many few one or two
Promotional
creativity
benefits
None Yes Yes Yes
EXAMPLES FARMERS LIQUOR
STORES
GAS
STATIONS
GOVERNMENT
Marketing Planning
Marketing Planning
53. 53
PRODUCT STRATEGY
OFFER ALL PRODUCT LEVELS:
1. POTENTIAL PRODUCT
Tops beer must meet customers changing needs (e.g. less
calories, even greater taste)
2. AUGMENTED PRODUCT
Must give 30-day credit / week end deliveries
3. EXPECTED PRODUCT
Tops must taste good
4. BASIC/ACTUAL PRODUCT
Must be Packaged in 12 oz blue Bottle
5. CORE PRODUCT
Must quench thirst on warm hot day
54. 54
PRODUCT MIX
Always offer an assortment /variety of products to meet the needs of different targeted
market. Product mix has a certain width, length, depth and consistency.
DRINKS UNLIMITED PRODUCT MIX (BEER PRODUCTS)
WIDTH
REGULAR LIGHT NON-
ALCOHOLIC
LENGTH
Gills
Roys
Smits
Brew
Mitts
Gill-light
Roys-light
Smits-light
Tops
Size
DEPTH
Form
12 oz, 16 oz, 32 oz
Bottles & cans
12 oz, 16 oz
Only bottles
12 oz,
Cans & bottles
CONSISTENCY
Same production
requirements and
distribution
channels
HOTELS
“Beer taste”
HOTELS
“Beer taste”
HOTELS
“Beer taste”
PRODUCT -LINE ANALYSIS (portfolio management/ perceptual maps)
SALES & PROFITS MARKET PROFILE
Gill-light......... S: 2,000 CS P: $1,000
Roys-light S: 3,000 CS P: $1,500
Smits-light............ S: 1,000 CS P: $500
Tops S: 3 ,000 CS P: $1,000
Low price, low quality
High price, low quality
High price, high quality
Moderate price , high quality
Marketing Planning
55. 55
BRANDING, PACKAGING, LABELING & WARRANTEES
“Always offer brand products that are properly packaged and clearly labeled”
BRANDING
A Brand is an exclusive right and promise to deliver a specific set of features, benefits,
value and services consistency to buyers’ expectations.
PRODUCT NAME TERM SIGN
(Logo)
SYMBOL
(Trademark)
DESIGN
(Entire
look)
NON-
ALCOHOLIC
BEER
Tops “Refreshing
and tasty”
1. WHY BRAND YOUR PRODUCTS?
Easy to process orders and track down problems
Allow legal protection of unique product features
Attract and sustain a loyal set of profitable customers
Help seller segment markets (products with the same form)
Builds corporate image and makes it easy to launch new brands
Brand equity will cause premium prices and a huge distribution
Channel
Marketing Planning
TP
R
O
TOPS
TP
56. 56
2. BRAND - SPONSORDECISION
BRANDING OPTION ADVANTAGES DISADVANTAGE
Manufacturing brand
(National Brand) High exposure High cost
Distributor Brand
(Private, Store Brands) Low exposure Low cost
Licensed Brand
High exposure High cost
Combination of
manufacturing and
private branding
High exposure High uncertainty
3. BRAND - NAME DECISION
A brand name should be:
It should be easy to pronounce and remember
It should suggest product’s quality action, or specific benefits,
It should be distinctive
It should not carry poor meaning in other countries and language
A brand could be in the form of:
Individual names: Tops, Gills, Smits
Advantage: if one product fails the others (their image) would not be negatively
branded to that product
Blanket family names: Tops non-alcoholic, Tops regular, Tops light
Advantage: developing, advertisement and “name” research cost is enormously
reduced
Marketing Planning
Marketing Planning
57. 57
Company trade name combined with individual product names: Drinks Unlimited
non-alcoholic beer, Drinks Unlimited regular beer, Drinks Unlimited light
Advantage: if a company is successful the products will have an extra push into the
market during its introductory cycle
4. BRAND - STRATEGY DECISION
STRATEGY EXAMPLE
Line Extension
“Introducing additional items in the same
product category under the same brand
name (forms, flavor)”
Tops non-alcoholic, Tops light, Tops
regular
Brand Extension
“ Use existing brand name to launch new
products in other categories”
Tops diet soda, Tops milk shake
Multi-brands:
“ Introducing additional brands in the same
category”
Smits, and Gills non-alcoholic beers
New Brands
“May be needed when a product is
launched in a new category”
Develop a new brand name “Refresh” to
enter the “water consumption market”
Co-brands
Marketing Planning
58. 58
“When two or more well-known brands are
combined in an offer”
Ingredient co-branding
Same-company co-branding
Joint -venture co-branding
Multiple-sponsor co-branding
“Tops” non-alcoholic beer only uses
“Refresh” water
Gills soda & Tops non-alcoholic beer
mixed into” Gills-Tops” Santee drink
Value Depot and Drinks Unlimited
collaborate together and form a product call
“True -light” beer for the international
market
Value Depot and Drinks Unlimited team up
with a diet ingredients company called
Cracket Ltd. and form a product call
“Diet-light”
PACKAGING .... protects and promote product
“ A package is much more than a cover for actual products .........Well - designed
packages can create convenience and promotional value”
IMPORTANCE FACTORS OF “INNOVATIVE PACKAGING”
It can be a strong “advertising tool” before (store), during (home) and after use
(storage)”
It can extent a product life cycle ...like: “new”, “Improved” “less Calories”
Updating design can give a more “contemporary image”
Good packaging makes products easy to stack, price, mark, display,
inventoried and identified
It help safeguard products through unfavorable weather conditions
It can reduced cost (using plastic instead or bottles)
It can save the environment and reduce wastage (using recycle paper)
It could reduce pilferage rates in retail. Stores
It could use as an attractive point-of-purchase display.
59. 59
ELEMENTS OF PACKAGE DESIGN
COLOUR ELEMENT
A colour can give a positive or negative expression of a product
A Colour can differentiate a product from its competitors
A colour can highlight a product’s quality
“Tops is packaged in a blue bottle”
COLOUR ASSOCIATION
Blue Coolness & distinction
Red Heat & excitement
Purple & Gold Royalty & richness
Orange Warmth & movement
Green & Beige Nature & quiet
White & Silver Purity & cleanliness
Yellow Sunshine, brightest & warmth
Brown Utility & hard work
Pink Feminine
Black Bold, daring and mysterious
SHAPE & SIZE ELEMENT
A product’s shape should make it easy to handle and store (when, where appropriate)
A product’s size should clearly and honestly dictate its contents (or amount)
“Tops bottle has a “Pepsi cola shape”, it comes in 12 oz and 16 oz”
LABELING ... tells the products life cycle
“Proper labeling should tell a “life story” of the product: it shows how it was
produced (its ingredients), it shows how it should be consumed ( a picture of it in use
& directions) and how it should be dispose of (Recycle or litter box)
Marketing Planning
Marketing Planning
60. 60
IMPORTANCE FUNCTIONS OF “INNOVATIVE LABELING”
Identifies the product or brand name
Grade the product (less, more...extra) for quality
Describe the product: who made it, when it was made, what it contains, how it is to be
used, where it was made and how to used it safely
Promotes the product through attractive graphics
GRAPHIC ILLUSTRATION AND PHOTOGRAPHY
“The trademark, pictures of the product being used adds value to product”
Package copy
The layout should be attractive
The Lettering should be legible
Ingredients and weights should be in legible colours (clarity)
“Safety” wordings should be highlighted
Labels should contain bar codes or universal product codes (UPC) to
speedhandling of fast-selling products
“ Tops has a picture of it being use and has a “born on date”
WARRANTIES..... protects the customer
“A warranty explains what a seller promises about its products..... A warranty can
make the difference between success and failure for a whole marketing strategy”
IMPORTANCE FUNCTIONS OF “INNOVATIVE WARRANTY”
It must be clearly stated: “Limited (six months), “full (after all is used)”etc.
It must be easy to understand
It must protect the buyer
It must give essential information about the product
It should be a written guarantee
It must honored
“ Tops could be replaced if it has a ‘stale date’ at any retailer
PRICING
Marketing Planning
61. 61
STEPS IN SETTING PRICE
STEP 1: IDENTIFY PRICING CONSTRAINTS
“Factors that limit the latitude of prices a firm may set”
Demand for product class (Beer), product form (non-alcoholic) and brand Tops):
“There is a moderate demand ( xxxx cs) for Tops non-alcoholic beer”
Newness of the product in the product life cycle (PLC) and industry life cycle (ILC) : Tops
is in the introduction stage of the PLC , but it is accepted in the market place. Non-alcoholic
beer is in the maturity stage of the ILC. Because of this price must be based on Tops value.
Competitive Market Structure: Drinks Unlimited is operating under monopolistic
competition. Therefore, Tops could be priced based on cost, demand, value or competitiveness
Single product versus a Product line: Tops is the only non-alcoholic beer that is sold by
DRINK’S UNLIMITED. Therefore, it has “latitude” to set pricing
Cost of producing and marketing the product: Tops cost per unit to produce: $10.00 (landed
cost) and $4.00 in marketing and related costs. Total cost : $14.00
Competitors prices: Value Depot ($23.00), Bahamas Beverage ($23.25)
STEP 2: IDENTIFY PRICE OBJECTIVES
Profit: Managing for the long term profits - 15% of net sales (12 months) ..25 % of net sales 36
months). Current profit maximization -30% on net within 6 months. Target return : 20% of sales
for .....
Sales: Dollar ($5,000) , Unit ( $1,000 cs per month)
Market Share: 30% in year 1; 50% in year 2 ...........
Match Competition: Sharps: $23.00 , Tops $ 23.00
Marketing Planning
62. 62
Other objectives: Survival and social responsibility
Note: Pricing policies must be integrated with other marketing mix strategies and company’s
objectives
STEP 3: ESTIMATING DEMAND AND REVENUE
FUNDAMENTALS IN ESTIMATING DEMAND
(A) Price Factor (Demand Curve): How much Tops will customer buy at certain price
levels?.. 1,000 @ $22.00.. 1,200 @ 21.50 .Remember the law of demand and supply ...
“as prices goes up, quantity demanded goes down”
(B) Consumer Taste (Style): based on demographics, culture and technology
(C) Price and availability of other products (substitute): if water, juice and other
beverages decreases; and becomes easy available; it is possible that the demand for tops
would decreased.
(D) Consumer Income: If consumer (target market) real income/revenues (adjusted for
inflation) increases, demand for Tops would increase.
FUNDAMENTAL IN ESTIMATING REVENUE
(A) Demand curve and revenue : “as prices goes up quantity demanded goes down”
Revenue Concepts
Total Revenue (TR) = Price(P) x Quantity (Q): $22.00 x 1,000=$2, 200,000
Average Revenue (AV) = TR/Q = Price
Marginal Revenue : Change in TR obtained by selling one additional unit
MR= Change in TR/ 1 unit increase in Q
(B) Price Elasticity of Demand = % Change in quantity demanded /
Marketing Planning
63. 63
% Change in Price
“Always use good forecasting and research tools”
STEP 4: DETERMINING COSTS, VOLUME AND PROFIT RELATIONSHIP
COST CONCEPTS
Total Cost (TC)= Fixed Cost (FC) + Variable Cost (VC)
TC ($14.00) = FC ($10.00) + VC ($4.00)
Marginal Cost (MC) is the change in total cost that results from producing and
marketing one additional unit
MC = Change in TC / 1 unit increase in Q
MARGINAL ANALYSIS & PROFIT MAXIMIZATION
Always operate up to the quantity and price level when: Marginal Revenue = Marginal
Cost (MR= MC)
BREAK-EVEN ANALYSIS
Break -Even Point: Total Revenue = Total Cost
(A) Break-evenpoint (quantity) = Fixed Cost (Per unit) /
Unit Price - Unit Variable cost
BEP(Quantity) = 750 Beers
(B) Break -even point (Sales) = BEP (Quantity) x Selling Price
Marketing Planning
64. 64
BEP (Sales) 750 x $22.00 = $16, 500.00
(C) Break -evenpoint (Total Sales)= Fixed Cost/
Contribution Margin ratio(or %)
Contribution margin ratio (or %) = 1-variable cost %
Variable cost % = variable cost/price x 100
PROFIT(per unit) = TOTAL REVENUE - TOTAL COST
$8.00 (per unit) = $22.00-14.00
STEP 5 SELECT AN APPROXIMATE PRICE LEVEL
A. DEMAND / MARKET BASE METHODS
Market based pricing methods depend on accurate analysis of the market and consumer
requirements (taste and preferences).
INTRODUCING A PRODUCT OR SERVICE
Penetration pricing: Used for new products wanting to gain market share. The product
is priced low so that it is able to get a hold in the market. E.G. Tops introductory Price
$ 20.00
Market skimming: When a new innovative product is bought out - during the first few
months high prices can be charged as there is little competition and the product is popular
because it is new. Tops cannot use this strategy because there are similar non-
alcoholic beers already in the market place
Marketing Planning
65. 65
CURRENT PRODUCTS OR SERVICES
Prestige Pricing: involves setting a high price so that status conscious customers will be
attracted to the product and buy it. Tops cannot use this strategy
Psychological (odd even) pricing: Hitting price points that are significant e.g. $99.99
sounds better than $100.00. Tops cannot use this strategy
Price discrimination: Charging customers different prices for effectively the same
product. Normally time based (charging different prices at different times of the day /
week / year). Hotels get a lower price compared to liquor stores.
Discount Pricing: Offering lower prices for a set time period to try and boost sales and
sell off unwanted stock. Tops is discounted 3 times a year for 2 weeks to $21.50
Price Lining: a line of products may be priced at different pricing points: ($20.00,
$22.00, 24.00). Demand is elastic at each of these prices but inelastic between these price
points. Tops cannot use this strategy
“ What the market can bear” (Demand-backward) Pricing: price the product at the
highest level what the customers are willing to pay for the product. Tops cannot use this
strategy
Price Bundling: The marketing of two or more products in a single “Package” price.
Tops and Smits are packaged together at $1.99 (retail value). If bought separately, they
would cost $2.50. Tops only used this strategy in the consumer market.
B. COST- BASED METHODS
Price is set by analyzing the production and marketing cost (supply or cost side) then
adding a margin to cover direct expenses, overheadand profit.
Absorption cost (standard markup) pricing: Used mainly in large wholesaling and
retailing stores. The price of each product is dependent on how many costs it creates.
Tops fixed and variable cost per unit ($ 14.00) + Mark up ($8.00).
Total price = $22.00
Cost Plus % of Cost Pricing: Tops fixed and variable cost per unit ($ 14.00) + 50%
Mark up ($7.00) on cost. Total price = $21.00
Cost Plus Fixed-Fee Pricing. Tops cannot use this strategy
Experience Curve pricing: Tops cannot use this strategy
Marketing Planning
66. 66
Target pricing: A target price is made and then costs are adjusted so that that price can
be achieved. Tops cannot use this strategy
C. PROFIT-BASED METHOD
The pricing level will cover all costs and expectedprofits
Target Profit Pricing: Profit = Total revenue-Total cost
Profit = (price x quantity) - (Fixed cost + (unit variable cost x quantity)
Tops target profit is $ 8.00, total cost =$14.00 therefore, the price must be $22.00
D. COMPETITION -BASED PRICING
Loss leader pricing: Charging below cost price to try and attract customers to buy other
products (practice normally in supermarkets). Tops cannot use this strategy
STEP 5. SET THE LIST OR QUOTED PRICE
Marketing Planning
67. 67
Before setting a listed price make sure you price your product to make some sort of
profits.
Other factors to consider (3 Cs): Company Goals (the impact on other product line)
Customer perception (lower price sometimes mean lower quality) Competition’s
reaction pattern ( they may lower their prices or offer discounts )
TARGET PROFIT STRATEGY
TOPS LISTED PRICE WILL BE $22.00 PER CASE
STEP 6. MAKE SPECIAL ADJUSTMENTS TO THE LIST OR QUOTED PRICE
DISCOUNTS
Quantity (non-cumulative): buy over 20 cs get 10% discount
Seasonal: 5% discount during January, February, March
Trade: other liquor wholesalers can buy Tops for $20.00 per case
Cash: No!
ALLOWANCES
Trade -In: No!
Promotional: 10% of case. Given to some retailers during June & July
GEOGRAPHICAL ADJUSTMENT
FOB (Free on board) Origin Pricing: For Family Islands and Caribbean Customers
Marketing Planning
68. 68
PLACE...”how, when & where”
Place (in marketing terminology) means the (a) method (process) how products get from
buyer to seller (logistics), the distribution channel (marketing channel) and location of
products (physical distribution).
5 “MARKETING FLOWS” IN THE DISTRIBUTION NETWORK
1. Physical Flow.......................................... Flow of Goods and services
2. Tile flow .................................................... Flow of ownership
3. Payment Flow ............................................ Flow of money
4. Information Flow........................................... Flow of knowledge
5. Promotion Flow............................................. Flow of communication
MARKETING CHANNELS
Marketing channels are individuals and organizations that are involved in the process of
making a product or service available for use or consumption by consumer or industrial
users.
Marketing channels make possible the flow of goods and other “flows” described above
from a producer, through intermediaries (Middlemen, Agent/Broker, Wholesaler,
Retailer, Distributor and Dealer) to a buyer.
TRADITIONAL MARKETING CHANNEL FOR CONSUMER GOODS
PRODUCER – WHOLESALER – RETAILER - CONSUMER
“Tops non-alcoholic beers is distributed through this type of channel”
NEW MARKETING CHANNEL FOR CONSUMER GOODS
Marketing Planning
69. 69
Vertical marketing systems are professionally managed and central coordinated
marketing channels designed to achieve channel economies and maximum marketing
impact.
VERTICAL MARKETING SYSTEMS (VMS)
CORPORATE
SYSTEMS
CONTRACTUAL
SYSTEMS
ADMINISTRATIVE
SYSTEMS
“Forward integration”
The combination of
successive stages of
production and distribution
under a single ownership
Examples:
Polo / Ralph Lauren
Goodyear, Singer, Sherwin
Williams
“Backward Integration”
A retailer might own a
manufacturing operations
Examples:
Kroger supermarkets
Independent production and
distribution firms integrate their
effort on a contractual basis.
1. Wholesale -Sponsored
E.g.: Ben Franklin
2. Retail Sponsored
E.g.: Associate grocers
3. Franchise programs:
“Over 40% of USA retail sales”
A. Manufacturing-sponsored Retail
system
E.g.: Ford
B. Manufacturing -
sponsored W/sale system
E.g.: Coca-Cola, Pepsi
C. Service - Sponsored
Retail systems
E.g.: Holiday Inn , McDonald’s
D. Service -sponsored system
E.g.: H& R Block tax services
Achieve coordination at
successive stages of
production and distribution
by the size and influence of
one channel member rather
than through ownership
E.g.: Proctor and Gamble
FACTOR EFFECTING CHANNEL CHOICE & MANAGEMENT
Marketing Planning
70. 70
Environmental
Factors
Consumer
Factors
Product
Factors
Company
Factors
“Rising
employment rate”
“Advances in
technology”
“Government
regulations”
“Who are the
customers”
“Where, when, how,
how much, what do
customers’ buy”
“Sophisticated
products are
normally distributed
directly to the
customers”
“Unsophisticated
products are
normally distributed
through many
channels”
A firm’s financial,
human or
technological
capabilities affect
channel choice
CHANNEL DESIGN CONSIDERATIONS
When choosing a marketing channel or intermediaries, ask these three (3) questions:
Which one will provide the best target market coverage?, satisfy buyers requirements?
and be the most profitable?:
TARGET MARKET
COVERAGE
SATISFYING BUYER
REQUIREMENTS
PROFITABILITY
LEVEL
“ Intensive distribution”
Products and services are
distributed through many
retail outlets
Convenience goods are
normally distributed this
way .
E.g.: Tops are distributed to
all family Islands, The
Caribbean and USA
“Selective distribution”
“Information”
In-store displays,
demonstrations & personal
selling
“Convenience”
24/7
Less time
Fast service
Quick delivery
The Internet
“Variety”
“Short-term vs. long term
objectives”
“Revenue-Cost”
Revenue: Sales
Cost: distribution,
advertisement and selling
associated to the various
types of marketing channels
Marketing Planning
71. 71
Products and services are
distributed through few
retail outlets
Shopping goods are
normally distributed this
way
“Exclusive distribution”
Products and services are
distributed through one
retail outlet
Specialty goods are
normally distributed this
way
Great selection
Expanded length, breadth
and depth of product line
“Attended Services”
After sales services
installation, delivery and
credit
LOGISTICS MANAGEMENT
“Organizing the cost-effective flow of raw material, in-process inventory, finish goods,
and related information from point-of-origin to point of consumption to satisfy
customer requirements”.
Logistics can be broken down into Physical Supply and Physical Distribution.
Information Technology (IT) is very important in logistics management. Physical
Distribution costs can be broken down into inventory, warehousing and
transportation.
Marketing Planning
72. 72
Some suppliers and customers become strategic partners can connect buying and selling
activities through a single computer network called electronic data interchange (EDI).
This can improve customer service:
Time (lead, order cycle)
Dependability (consistency of replenishment)
Communication (helping to monitor service and anticipating future needs)
Convenience (reducing the effort of doing business)
4 MAJOR ELEMENTS OF LOGISTICS MANAGEMENT
TRANSPORTATION WAREHOUSING INVENTORY
MANAGEMENT
ORDER
PROCESSING
The movement of goods
by Truck, Air or water
Each should be
evaluated based on:
“Cost, Time, Capability,
Dependability,
Accessibility,
Frequency”
Warehouses can be
classified in one or two
ways: storage
warehouses or
distribution centers
A Warehouse is the
first place where goods
enter a company and
the last place where
they are stored before
they leave the company
A Warehouse must be
efficient in material
handling
Too little inventory will
result in poor service,
stock-out, brand
switching, lost sales,
decrease market
share...dissatisfied
customer
Too much inventory will
result in high capital
(accounts payable, interest
rates), insurance, storage
and risk (damage,
pilferage, perishability
and obsolescence costs
...... there must be a
balance (benefit must
outweigh the cost)
EDI gives organizations
competitive advantages
“back order listing
is kept when there
is an “ out of stock
item”
OPS is evaluated
based on speed
and accuracy
73. 73
RETAILING
When retailing a product or service you must have the right: product, price, location,
image and atmosphere; and there must be an effective promotional campaign.
Effective retailing requires you to know your customer and market. This could only be
done through a well-organized market research program
RETAILING MIX
The retailing mix includes; (1) goods and service, (2) physical distribution and (3)
communication
GOODS AND
SERVICE MIX
PHYSICAL
DISTRIBUTION MIX
COMMUNICATION
MIX
Variety and assortment
Sales service
Customer service
Pricing
Sales promotion
Credit
Payment method
Guarantee
Exchanges
Alteration
Adjustments
Store image
Store atmosphere
Parking
Delivery
Store location
Convenience
Safety
Distribution centers
Warehousing
Transportation
Handling goods
Packing
Sales staff
Store layout
Telephone sales
Personal selling
Advertising
Window displays
Internal display
Public relations
Catalogs
Retailers need to know their industry and apply the retailing mix model in a manner that
would result in competitive advantages. Remember retailing is all about getting:
“The right product in the right quantity to the right location at the right
time, in the right wayto the right peopleby the right appeal”!
Marketing Planning
74. 74
PROMOTION
To communicate with customers, an organization can use one or more of five
promotional alternatives; advertising, personal selling, sales promotion, public
relations and public relations.
PROMOTIONAL TOOLS CHARACTERISTICS
Advertising Personal
selling
Sales
promotion
Public
relations
Direct response
marketing
Confers a
kind of
legitimacy
to the
product
It is high in
persuasive
qualities
It allows for
drama (color,
print and
sound)
It gives a
personal
attention
It builds
relationship
easier
It makes the
buyer feel
obligated to
give a response
They Gain
the attention
of
audiences
They stress
rewarding
customers
They invite
customers to
“buy now”
It gives
high
credibility
Its high on
drama
Could go
beyond the
reach of
advertising or
personal selling
Very
personalized
A message can
be easily changed
A message can
be prepared very
quickly
Marketing Planning
75. 75
FACTORS THAT AFFECTS THE DECISION OF WHAT
PROMOTIONAL TOOLS TO USE
1. Target Market
Promotional programs (mass media and personal selling) directed to buyers of
consumer products are normally used in retail stores or in highly competitive markets
Promotional programs directed to industrial (business) clients are normally
advertising in trade publications or by personal selling
“Tops major target markets are hotels, liquor stores and restaurants”
2. Product Life Cycle
Stage of
Product
Life Cycle Introduction Growth Maturity Decline
Promotional
Objective To inform To persuade To remind To remind
“again”
Promotional
Activity
Publicity
Direct
response
mailing
Mass
advertising
Sales force
calling on
purchasing
managers
Sales
promotion in
the form of free
samples
Personal
selling
Advertising
(stressing
differentiation)
Sales
promotion in
the form of
discount and
coupons
Flyers and little
advertisement
Marketing Planning
76. 76
“Tops is inside the introduction stage of the product life cycle”
3. Product Characteristics
“The greater the risk and complexity of using a product or service- the greater the need
of personal selling (surgery)”
If a high level of ancillary (degree of service and support after the sale) services is needed
then advertisement establish the reputation of the company and personal selling builds
up the buyers confidence and provides evidence of customer service
“ Tops is a low risk and complexity product”
4. Stages Of “The buyer Decision”
Pre - purchase Stage: Advertisement and free samples
Purchase Stage: personal selling, coupons, deals, point-of-purchase displays, rebates
Post- purchase Stage: personal selling, advertisement and coupons
“Tops major promotional strategies are geared towards the pre-purchase stage
during the first year”
5. Distribution Channel Strategies
Push strategy: personal selling and sales promotion activities geared towards
pushing the product through channel intermediaries (wholesales, retailers)
Pull Strategy: advertising activities geared towards the final consumer so that
they can make the wholesaler and retailer buy your product
“Tops place a higher interest on “the push strategy rather than the pull strategy”
because the target market is receptive of the product”
When to use or put high emphasis on advertising, personal selling, sales promotion
public relations and direct response marketing?
Marketing Planning
77. 77
BASIS OF
COMPARISON ADVERTISING
PERSONAL
SELLING SP, PR & DRM
Target Market Ultimate Customer Re-sellers and
industrial clients
Supporting role
Risk in purchase Low High Supporting role
Size of Decision making
unit Small Large Supporting role
Complexity of product Simple Complex Supporting role
Level of ancillary
services
Low High Supporting role
Stage of purchase
decision
Pre-purchase &
Post-purchase
Purchase &
Post-purchase
Supporting role
Channel Strategy Pull Push Supporting role
Geographical dispersion
of customers
Great Little Supporting role
THE ADVERTISING PROGRAM IN ACTION
Advertisement is any form of non-personal presentation and promotion of ideas, goods or
services by an identified sponsor
The five (5) Ms of advertising are Mission, Money, Message, Media and Measurement
Marketing Planning
78. 78
TOPS ADVERTISING CAMPAIGN
1. MISSION
Target Market
Hotels, Restaurants and Liquor Stores
The Image (from research) of Tops is “ tasty and refreshing”
(use Likert and familiarity scales)
Sales Goals
Hotels .......................................500 cs per month
Liquor stores..............................300 cs per month
Restaurants................................200 cs per month
Communication Objectives
Cognitive response: do you want to put something in the customers’ mind?
Affective Response: do you want to change the customers’ attitude?
Behavioral Response: to what extent do you want the customer to act?
Use the AIDA and Innovation-Adoption model to understand whether the customer is in
one of the following sequences:
“ Learn-feel-do, learn-do- feel or Do feel learn”
Advertising Objectives
Inform? (Year 1) Tops wants to illustrate how tasty and refreshing it is!
Persuade? .....”After first year”
Remind?”....During second year
Marketing Planning
79. 79
2. MONEY
Tops is interested in building up “Brand Equity”
Stages in the Product Life Cycle
New products receives more money to build awareness
Market share and customer base
High market share brands usually require less advertising expenditure as a percentage of
sales to maintain their share
Competition & Clutter
Large amount of competition causes advertisement expenditure to increase
Advertising frequency
“More repetition...............more money”
Product substitutability
Commodity products(cigarettes, beer, soft drinks ) require heavy advertising to establish
differential image
How much money to spend? ...... “ go by your sales or market share objectives”,
............. not by % of last year sales, matching the competition, ‘all you can afford’ or
anything else”
Marketing Planning
80. 80
3. MESSAGE
Message Generation
Proceeding inductively: talk to the people who use the product (drinkers of non-
alcoholic beer)
Proceeding deductively: determine what type of rewards a customer wants from using
your product (drinking non-alcoholic beer): rational, sensory, social or ego satisfaction
Message Content
Every ad message is made up of both informational and persuasion elements but it
depends on the ad appeal: fear, sex, humorous
Message Theme
Stress benefits and value...........not features
“ Tops is tastier ...and more refreshing than.........”
Message Evaluation and Selection
The message was evaluated based on desirability, exclusiveness and
believability........from the customer point of view!
Message Execution
“Message Impact”
The message depends on both “ what was said and how it was said”
Both rational positioning and emotional appeals has its pros and cons.
Marketing Planning
81. 81
Rational positioning: HEADLINE: “ A Brand new non-alcoholic beer”
Emotional positioning: HEADLINE: “ Tops non-alcoholic beer is for you”
Try to use a advertising strategy called “labeling” which the consumer is labeled as the
type of person who is interested in that type (Tops non-alcoholic beer) of product
“Message Style, Tone, Words & Format”
Style: slice of life, lifestyle, fantasy, mood or image, musical, personality, symbol,
technical, technical expertise, scientific evidence and testimonial
Tone: Positive or negative
Words: memorable and attention -getting. There are six basic types of HEADLINES:
News, Questions, Narrative, Command, 1-2-3 ways and
How - What- Why
Format: Size, color and illustration.
“ BE CREATIVE”
Message contents in order of importance by most consumers!
1. Picture
2. Headline
3. Copy
Marketing Planning
82. 82
4. MEDIA
Media selection involves finding the most cost-effective media to deliver the desired
number of exposures to the target audience
REACH, FREQUENCY AND IMPACT
The affect of exposures on audience awareness depends on the exposures’ reach,
frequency and impact
Reach ( R ): the number of different persons exposed to a particular media schedule at
least once during a specific time period
Frequency (F): the number of times within the specific time period than an average
person is exposed to the message
Impact (I): the qualitative value of an exposure through a given medium (TV vs. Radio
vs. Newspaper)
“Tops ads are viewed by 20,000 readers (Reach), 2 times a week (Frequency )
through the most dramatic newspaper ( the punch) read on Mondays and
Thursdays (Impact)”
CHOOSING THE RIGHT MEDIA
Media planners make their choice among media categories by considering the following
variables:
Target -audience media habits, product/service, message cost per thousand (CPM)
CPM = AD COST X 1,000 / CIRCULATION
CPM = Ad cost by vehicle (Punch) is $300.00; divided by estimated viewers
(20,000). Then the cost of exposing the ad to 1,000 persons is $15.00
Marketing Planning
83. 83
MEDIA TIMING
Use your discretion. The Guardian sells most of Thursday and Mondays
DECIDING ON GEOGRAPHICAL ALLOCATION
Use you discretion. Budget your ad money carefully!
5. MEASUREMENT
Communication-Effect Research (Copy Testing)
“Asking customers how they view/ perceived the ad”, then compared it to how you
want the ad to be viewed/ perceived”
“Asking customers how they know about your promotion, store, products etc.”
Sales- Effect Research
If sales goes up, the ad was effective ............. if sales remain the same the
competition might be advertising intensely, or..............................
Marketing Planning
84. 84
SALES PROMOTION
Advertising offer a reason to buy, sales promotion offer an incentive to buy. A sales
promotion is a short- term incentive to encourage the purchase or sale of a product or
service.
1. ESTABLISH OBJECTIVES
CONSUMER MARKET RETAIL MARKET
Encourage purchase of large-size units
Build trial among nonusers
Attract “switchers” away from competitors’
brands
Persuading retailers to carry new item
and higher levels of inventory
Encourage off seasonbuying
Build brand loyalty
Gain entry into new retail outlet
2. SELECTING PROMOTIONAL TOOLS
CONSUMER TRADE/ BUSINESS /SALE -FORCE
Samples, coupons, cash refund (rebates),
price packs (cents- off deals)
premiums(gifts), premiums(gift)
prizes (contest, sweepstakes, games)
patronage awards, free trials, product
warranties, tie-in promotions, cross
promotions, point-of-purchase displays and
demonstrations
Trade
Price-Off, Allowance, free goods,
Business
Trade shows
Sales -Force
Sales contest, specialty advertising
Marketing Planning
85. 85
3. DEVELOPING THE PROGRAM
Think about these factors before deciding to whether to use a particular incentive:
Size of the incentive (minimum, maximum)
Conditions or participants (individuals or group factors)
The duration of promotion (not too short or not too long)
Distribution vehicle (package, in store, mail or in advertising).. think
about reach , frequency and impact
Determine total sales-promotion budget
4. PRE-TESTING, IMPLEMENTING, CONTROLLING & EVALUATING
Pre-testing The Program
Ask the target market to rate or rank different possible deals, or trial test can be
run in limited geographic areas to answer the following questions:
Which promotional tools are appropriate?
Is the incentive size optimal?
Is the presentation method efficient?
Implementing The Program
Know your lead time: Lead time is the time necessary to prepare the program before
launching it
Know your sell -in time: the duration between the beginning and the end of the sales
program
Marketing Planning
86. 86
Controlling & Evaluating results
There are three methods to measure sales-promotion effectiveness:
Sales data, consumer survey and experiments
MARKETING PUBLIC RELATIONS (MPR)
“Building good relations with the organization’s various publics (stakeholders) by
obtaining publicity, building up good corporate image and handling or heading off
unfavorable rumors, allegations, stories or events”
MPR goes beyond simple publicity and plays an important role in the following tasks:
Assisting in the launch of a new product: Marketing manager held a press
conference to introduce “The freshest -newest non-alcoholic beer on the market-
Tops!.
Others: Assisting in repositioning a mature product; Building interest in a product
category, influencing specific target groups, defending products that have encountered
public problems and building corporate image.
MPR PLANNING, IMPLEMENTING & CONTROL
1. Establish Marketing Objectives
Build awareness
Build credibility
Stimulate sales force and dealers
Marketing Planning
87. 87
2. Choose Message & Vehicle
Message: be creative Like “ the other white meat-pork!”
Vehicle: make sure that the message and vehicle are in harmony
3. Implementing Plan
“Get to know ... and be liked by editors of the media”
4. Evaluate Results
Number of exposures
Public awareness and response
Public comprehension and attitude change
DIRECT MARKETING
Direct marketing consists of direct communications with carefully targeted individual
customers or prospect to obtain an immediate response.
In order to be effective with a direct marketing strategy you must first develop a customer
database that contains all relevant information about their buying behavior. Database
marketing is the process of building, maintaining and using customer database for the
purpose of contacting and contracting with customers.
There are seven forms of direct marketing communication:
Internet Marketing... Web sites, E-commerce, 24 hr. shopping and customer
service support
Face-To-Face Selling...... Salespersons, Representatives And Agents
Direct Mail Marketing... Fax , E-Mail, Voice Mail
Marketing Planning
88. 88
Catalog Marketing.. DVD, CD-ROM, videotape, magazines, computer diskettes
Telemarketing... Tool Free Numbers (800, 900)
Direct-Response Television Marketing.. “Infomercials”, Home Shopping
Channels
Kiosk Marketing... information and ordering machines (not vending machines)
“ Tops uses Internet Marketing, Face- To - Face Selling, Direct-Mail Marketing and
Telemarketing”
PERSONAL SELLING
A Salesperson is responsible for researching customers’ needs and customizing their
selling and communication presentations to satisfy those needs (needs -solution selling),
and to build long-term relationship.
NEED-SOLUTION SELLING
The process of identifying customers’ implicit and explicit needs so that valuable
solutions can be provided in an effective and efficient manner
NOTE: ATTACHED IS A MODEL OF NEED SOLUTION SELLING
SALES FORCE MANAGEMENT
The analysis, planning, implementation, and control of sales force activities.
NOTE: ATTACHED IS A MODEL OF HUMAN RESOURCES MANAGEMENT
Marketing Planning
89. 89
INTEGRATED PROMOTIONAL MIX
In order for a promotional strategy to be effective, all of the promotional tools must be
integrated and based on marketing objectives.
NOTE: ATTACHED IS A MODEL OF “INTEGRATED PROMOTIONAL MIX
MARKETING SERVICES
Marketing Planning
Employee Customer
Company
INTERNAL
MARKETING EXTERNAL
MARKETING
INTERACTIVE
MARKETING
90. 90
PEOPLE, PROCESS & PHYSICAL EVIDENCE (Other 3 Ps)
PEOPLE PROCESS PHYSICAL EVIDENCE
People are the most
important element of
any service or
experience. Services
tend to be produced and
consumed at the same
moment, and aspects of
the customer experience
are altered to meet the
'individual needs' of the
person consuming it.
Most of us can think of a
situation where the
personal service offered
by individuals has made
or tainted a tour, vacation
or restaurant meal.
Remember, people buy
from people that they like,
so the attitude, skills and
appearance of all staff
need to be first class.
Here are some ways in
which people add value
to an experience, as part
of the marketing mix -
training, personal
selling and customer
service.
For the purposes of the
marketing mix,
process is an element
of service that sees
the customer
experiencing an
organization’s
offering. It's best
viewed as something
that your customer
participates in at
different points in time.
Here are some
examples to help your
build a picture of
marketing process,
from the customer's
point of view.
Going on a cruise -
from the moment that
you arrive at the
dockside, you are
greeted; your baggage
is taken to your room.
You have two weeks of
services from
restaurants and
evening entertainment,
to casinos and
shopping. Finally, you
arrive at your
destination, and your
baggage is delivered to
you.
Physical evidence is the
material part of a service.
Strictly speaking there are
no physical attributes to a
service, so a consumer
tends to rely on material
cues. There are many
examples of physical
evidence, including some of
the following:
Packaging
Internet/web pages
Paperwork (such as
invoices, tickets and
dispatch notes)
Brochures
Furnishings
Signage (such as
those on aircraft and
vehicles)
Uniforms
Business cards
The building itself
(such as prestigious
offices or scenic
headquarters)
Mailboxes and many others
Marketing Planning
91. 91
SPECIAL SERVICE CHARACTERISTICS & STRATEGIES
Special Characteristic
of services
Potential
Problems
Appropriate Marketing
Strategies
INTANGIBILITY Difficult to evaluate in
Advance
Build brand-benefits
linkages
Associate with tangible
cues (Augment the
service)
Give extra services
PERISHABILITY Inadequate availability at
desired times
Use off-peak pricing
Offer flexible delivery
Enhance the waiting
period
VARIABILITY
(HETEROGENEITY)
Hard to assure
consistent quality
(Lack of standardization)
Substitute equipment for
people
Established set
procedures, routines and
rules
Customer Service
Training
Decision –making and
problem solving training
SIMULTANEITY
(INSEPARABILITY)
Simultaneous
production and
consumption
Build membership
relationship
Personalized service
Marketing Planning
92. 92
THE R.A.T.E.R MODEL
5 Dimensions of Service Quality
DIMENSIONS REFERS SPECIFIC
CUSTOMER TO CRITERIA
USE
RELIABILITY
Delivering on promises
Your ability to perform the
promised service dependably
and accurately
Timeliness
Consistency/Regularity
Accuracy
ASSURANCE
Inspiring trust and
confidence
The knowledge and courtesy
of staff; their ability to inspire
trust and confidence
Staff competence
Respect for customers
Credibility
Integrity and confidentiality
Safety and security
TANGIBLES
Representing the service
physically
The physical representations
or images of your service
Physical facilities
Equipment
Technology
Employees
Communication materials
EMPATHY
Treating customers as
individuals
The caring individualized
attention you provide your
customers
Access (to staff, services, information)
Communication (clear, appropriate,
timely)
Understanding the customer
Services appropriate for customers'
needs
Individualized attention
RESPONSIVENESS
Being willing to help
Your willingness to help
customers and to provide
prompt service
Willingness to help
Prompt attention to requests, questions
Problem resolution
Complaint handling
Flexibility
Marketing Planning
93. 93
IMPLEMENTATION
Marketing implementation is the process that turns marketing plans into action plans and
ensures that such actions (procedures, activities, assignments) are executed in a manner
that accomplishes the plans goals and objectives.
Remember that A mission and goal addresses the “what and why” of marketing
activities, implementation of strategies and tactics address the “who, where, when and
how”.
ORGANIZING
NOTE: ATTACHED IS A MODEL OF THE ORGANIZING PROCESS
ORGANIZATIONAL STRUCTURE
NOTE: ATTACHED IS A MODEL OF A MARKETING ORGANIZATIONAL
STRUCTURE
ACTION PLAN
NOTE: ATTACHED IS A MODEL OF AN ACTION PLAN
MEDIA PLAN
NOTE: ATTACHED IS A MODEL OF A MEDIA PLAN
Marketing Implementation
94. 94
LEADERSHIP PROCESS
NOTE: ATTACHED IS A MODEL OF THE LEADERSHIP PROCESS
NOTE: ATTACHED IS A MODEL OF SITUATIONAL LEADERSHIP
MOTIVATION PROCESS
NOTE: ATTACHED IS A MODEL OF THE MOTIVATION PROCESS
DECISION MAKING PROCESS
NOTE: ATTACHED IS A MODEL OF THE DECISION MAKING PROCESS
COMMUNICATION PROCESS
NOTE: ATTACHED IS A MODEL OF THE COMMUNICATION PROCESS
TEAMWORK
NOTE: ATTACHED IS A MODEL OF THE TEAMWORK PROCESS
CHANGE MANAGEMENT
NOTE: ATTACHED IS A MODEL OF THE CHANGE PROCESS
Marketing Implementation
95. 95
MCKINSEY 7Cs
NOTE: ATTACHED IS A MODEL OF THE MCKINSEY 7Cs
INTERNAL MARKETING PROCESS
NOTE: ATTACHED IS A MODEL OF THE INTERNAL MARKETING
PROCESS
Marketing Implementation