MACROPHAGE OUTWARD CURRENTS ACTIVATION CAN BE DEDUCED FROM THE TIME SERIES USING FRACTAL ANALYSIS
•
0 likes•298 views

Recommended

Recommended
More Related Content
Similar to MACROPHAGE OUTWARD CURRENTS ACTIVATION CAN BE DEDUCED FROM THE TIME SERIES USING FRACTAL ANALYSIS
Similar to MACROPHAGE OUTWARD CURRENTS ACTIVATION CAN BE DEDUCED FROM THE TIME SERIES USING FRACTAL ANALYSIS (20)
More from Mariela Marín
More from Mariela Marín (7)
Recently uploaded
Recently uploaded (19)
MACROPHAGE OUTWARD CURRENTS ACTIVATION CAN BE DEDUCED FROM THE TIME SERIES USING FRACTAL ANALYSIS
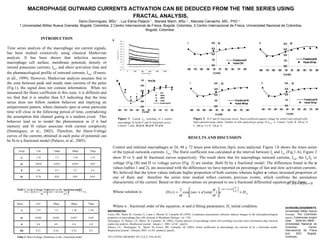
- 1. MACROPHAGE OUTWARD CURRENTS ACTIVATION CAN BE DEDUCED FROM THE TIME SERIES USING FRACTAL ANALYSIS . Darío Domínguez, MSc 1 , Luz Elena Palacio 1 , Mariela Marín, MSc 2 , Marcela Camacho, MD., PhD 3 . 1 Universidad Militar Nueva Granada, Bogotá, Colombia, 2 Centro Internacional de Física, Bogotá, Colombia, 3 Centro Internacional de Física, Universidad Nacional de Colombia, Bogotá, Colombia . - INTRODUCTION Time series analysis of the macrophage ion current signals, has been studied extensively using classical Markovian analysis. It has been shown that infection increases macrophage cell surface, membrane potential, density of inward potassium currents, I kir , and alters activation time and the pharmacological profile of outward currents, I out . (Forero, et all., 1999). However, Markovian analysis assumes that in the zone between peak and steady state currents of the pulse (Fig.1), the signal does not contain information. When we measured the Hurst coefficient in this zone, it is different and we find that it is smaller than 0,5 indicating that the time series does not follow random behavior and implying an antipersistent pattern, where channels open at some particular time will close in the following period of time, contradicting the assumption that channel gating is a random event. This behavior lead us to model the phenomenon as if it had memory and H values associate with current complexity (Domínguez, et al., 2002). Therefore, the Hurst-Voltage curves of the currents obtained in each pulse of potential can be fit to a fractional model (Palacio, et al., 2003). REFERENCES Forero ME, Marín M, Corrales A, Llano I, Moreno H, Camacho M (1999). Leishmania amazonensis infection induces changes in the electrophysiological properties of macrophage-like cells (Journal of Membrane Biology, vol. 170). Domínguez. D, Palacio. LE, Marín. M, Camacho. M. (2002). Fractal analysis of macrophage whole cell recordings provides more information than classical markovian analysis. Biophysical journal. January 1. 2002, vol 82, (part2). Palacio. LE, Domínguez. D, Marín. M, Forero. ME, Camacho. M. (2003). Hurst coefficients of macrophage ion currents fit by a fractional model. Biophysical journal. February 2003, vol 84, number2, (part2). *IN LOVING MEMORY OF LUZ E. PALACIO. Figure 2 . H-V and fit fractional curves. Hurst coefficient against voltage for control and infected cells. Data represent mean values. Number of cells analyzed per group: In I OUT . A. Control: 7cells; B. 24h pi: 9; C. 48h pi: 9 y D. 72h pi: 6. RESULTS AND DISCUSSION Control and infected macrophages at 24, 48 y 72 hours post infection (hpi), were analyzed. Figure 1A shows the times series of the typical outwards currents. I out . The Hurst coefficient was calculated at the interval between I p and I ss , (Fig.1.A). Figure 2 show H vs V and fit fractional curves respectively. The result show that for macrophage outward currents, I out , the I ss /I p vs voltage (Fig.1B) and H vs voltage curves (Fig. 2) are similar. Both fit by a fractional model. The differences found in the α values (tables 1 and 2), are associated with the differences we have reported on percentage of fast and slow activation currents. We believed that the lower values indicate higher proportion of both currents whereas higher α values increased proportion of one of them and therefore the series time studied reflect currents previous events, which confirms the anomalous characteristic of the current. Based on this observations we proposed to use a fractional differential equation of the form: Whose solution is Where α : fractional order of the equation; m and d fitting parameters; H o initial condition. ACKNOWLEDGEMENTS Universidad Militar Nueva Granada . The Colombian agency Colciencias project code 2228-04-12809. Universidad Nacional de Colombia, Centro Internacional de Física and SED Bogotá. Colombia. Figure 1 . Typical I out recording of a control macrophage. B Iss/Ip-V and fit fractional curves. Control: 7 cells. 24 pi:9; 48 pi:9; 72 pi:6. A Table 2 . Hurst-Voltage. Parameters in the Fractional model 0.3 0.32 0.34 0.31 Ho 4.8 4.6 4.8 4.6 d 0.03 0.027 0.029 0.026 m 1.38 1.38 1.4 1.35 α 72hpi 48hpi 24hpi Ctrl Hurst Table 1 . Iss/Ip- Voltage . Parameters in the Fractional model 0.83 0.81 0.82 0.76 Io 4.4 4.7 4.5 4.6 d 0.03 0.032 0.032 0.034 m 1.43 1.36 1.5 1.42 α 72hpi 48hpi 24hpi Ctrl Iss/Ip