Add innovative reporting and business intelligence to PowerBuilder apps
•
0 likes•316 views

Add innovative reporting and business intelligence features to your PowerBuilder applications for free using Qlik Sense Desktop free edition.

Recommended
More Related Content
What's hot
What's hot (20)
Similar to Add innovative reporting and business intelligence to PowerBuilder apps
Similar to Add innovative reporting and business intelligence to PowerBuilder apps (20)
Recently uploaded
Recently uploaded (20)
Add innovative reporting and business intelligence to PowerBuilder apps
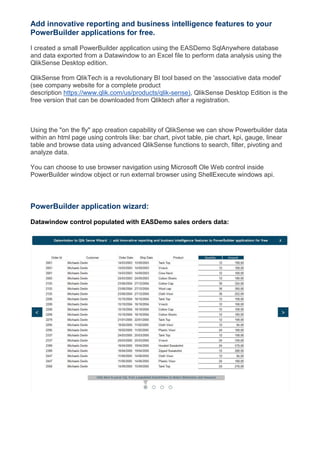
- 1. Add innovative reporting and business intelligence features to your PowerBuilder applications for free. I created a small PowerBuilder application using the EASDemo SqlAnywhere database and data exported from a Datawindow to an Excel file to perform data analysis using the QlikSense Desktop edition. QlikSense from QlikTech is a revolutionary BI tool based on the 'associative data model' (see company website for a complete product description https://www.qlik.com/us/products/qlik-sense), QlikSense Desktop Edition is the free version that can be downloaded from Qliktech after a registration. Using the "on the fly" app creation capability of QlikSense we can show Powerbuilder data within an html page using controls like: bar chart, pivot table, pie chart, kpi, gauge, linear table and browse data using advanced QlikSense functions to search, filter, pivoting and analyze data. You can choose to use browser navigation using Microsoft Ole Web control inside PowerBuilder window object or run external browser using ShellExecute windows api. PowerBuilder application wizard: Datawindow control populated with EASDemo sales orders data:
- 2. Pivot and Linear Table configuration: dimensions and measures obtained parsing Datawindow columns Qlik Sense Extension attributes
- 3. Qlik Sense Web Application result: Kpi, Gauge and Pie objects Treemap Chart object Pivot Table object
- 4. Pivot Table object layout changed moving dimensions, measures and exploring data: Linear Table
- 5. Filter and Search operations: Pivot-Table exported to Excel
- 6. Pdf file composed with html objects