SlideShare a Scribd company logo
1 of 8
Download to read offline
A RFID web-based infotracing system for the artisanal Italian cheese quality
traceability
Patrizia Papetti a
, Corrado Costa b,*, Francesca Antonucci b
, Simone Figorilli b
, Silvia Solaini b
,
Paolo Menesatti b
a
Department of Economics, University of Cassino, Via Marconi 10, 03043 Cassino (FR), Italy
b
CRA-ING (Agricultural Engineering Research Unit of the Agriculture Research Council), Via della Pascolare 16, 00015 Monterotondo Scalo, Rome, Italy
a r t i c l e i n f o
Article history:
Received 7 February 2012
Received in revised form
16 March 2012
Accepted 24 March 2012
Keywords:
RFID
Spectrophotometry
Tracing web-based architecture
PLS
Chemical analyses
Buffalo milk cheese
a b s t r a c t
The aim of this study is the integration of an electronic tracing system with a non-destructive quality
analysis system for single product of a typical Italian cheese, prepared with buffalo milk and called
“Caciottina massaggiata di Amaseno”, a typical diary product of Lazio Region. The tracing and quality
information are combined on a web platform to obtain a complete procedure to develop what we define
as an “infotracing system”. Quality analyses (chemical, sensorial and spectrophotometric) were carried
out on a total of 23 cheese wheels (8 with TAGs) and for three cheese maturation classes (3, 6 or 9
months after production). Two typologies of RFID tags were tested. Results were screened by Partial Least
Squares regressions (PLS) on reflectance values for the prediction of chemical content, while classifica-
tion of cheese maturation classes (3, 6 or 9 months) was carried out by Partial Least Squares Discriminant
Analysis (PLSDA) on reflectance values. The RFID system turned out as effective, reliable and compatible
with the production process tool. A good estimation of maturation degree by spectral and chemical
analysis was obtained. Moreover an infotracing web-based system was designed to acquire and link basic
information that can be made available to the final consumer or to different food chain actors before or
after purchasing, using the RFID code to identify the single and specific cheese product. The projected
web-based tracing system could improve the products commerce by increasing the information trans-
parency for the consumer.
Ó 2012 Elsevier Ltd. All rights reserved.
1. Introduction
Quality can be defined as the possession by a product of the
conditions that make it suitable to meet the expressed or potential
needs of its users (Giusti, Bignetti, & Cannella, 2008). In this definition
both the consumers and the producers needs are considered: the first
is interested in health, safety, organoleptic characteristic and utiliza-
tion modalities, the second in parameters more related to the market.
Consumers and other stakeholders are increasingly concerned about
the continuing sequence of food frauds and transparency is strongly
requested in this sector: tracking and tracing systems are considered
as efficient tools for early warning in case of a possible emerging
problem (Beulens, Broens, Folstar, & Hofstede, 2005). Another
important field of application for tracking and tracing systems is the
niche products market for the valorisation of food with particular
quality characteristics and a strong local identity (Ilbery & Kneafsey,
1999). Regulation (EC) No. 178/2002 of the European Parliament and
of the Council of 28th January 2002 sets the general principles and
requirements of food law and it defines traceability as “the ability to
trace and follow a food, feed, food-producing animal or substance
intended to be, or expected to be incorporated into a food or feed, through
all stages of production, processing and distribution” (European
Commission, 2002). The focus on traceability today is based on
innovation, in order to allow the maximum of information flow
management. Xiong et al. (2007) developed a practical application
platform consisting of a bar-code based data identification system for
pork products, a data-record keeping system, correlated databases,
and a data query interfaceinorder to monitortheproduct qualityfrom
the farm to the final consumer. An evolution of bar-codes systems is
represented by innovative devices, such as advanced data handling
systems based on RFID (radio frequency identification) and WSN
(wireless sensor networks) (Ruiz-Garcia, Steinberger, & Rothmund,
2010) These systems can be used on food also during its processing
without interfering or being damaged by the transformation opera-
tions, as in the case of presence of liquids or conservation solutions.
Moreover theycan store a high amount of information andin a remote
way. InparticularRFID is an emerging technology increasingly utilized
* Corresponding author. Tel.: þ39 0690675214; fax: þ39 0690625591.
E-mail address: corrado.costa@entecra.it (C. Costa).
Contents lists available at SciVerse ScienceDirect
Food Control
journal homepage: www.elsevier.com/locate/foodcont
0956-7135/$ e see front matter Ó 2012 Elsevier Ltd. All rights reserved.
doi:10.1016/j.foodcont.2012.03.025
Food Control 27 (2012) 234e241
in food logistics and in the supply chain management processes
(Jedermann, Ruiz-Garcia, & Lang, 2009). This system uses radio
waves to receive and transmit data stored into tags, consisting in
a silicon chip with an antenna where information are stored under
a unique serial number. The exchange of information between reader
and e antenna e tag is codified and transmitted to a database
(Brofman-Epelbaum & Kluwe Aguiar, 2007). RFID technology is not
only based on the presence of tags and readers but it requires other
software and hardware specifications in order to manage the infor-
mation load through space and time (Costa et al., 2011; Sarriá et al.,
2009). Products information can be associated to each step of the
food chain (producers, raw material, food processors, transporters,
retailers) and conveyed to Internet on a web platform in order to
become available to the following different end users: to multiple- or
to the single-final buyer or to the different actors of the food chain
(Lammers & Hasselmann, 2007). The information on product quality,
available for the different stakeholders, can derive from traditional,
chemical and destructive systems. In these cases it is not possible to
monitor each single product in the whole batch of goods, but only
some samples that will be destroyed for the analysis. Another possible
application is based on spectrophotometric analytical systems, based
on non-destructive, opto-electronic technologies (Menesatti et al.,
2010; Woodcock, Fagan, O’Donnell, & Downey, 2008). These tech-
nologies are characterized by a high analytical capacity, a high speed
information acquisition, a total non-destructivity of measurements
and, in particular conditions, the possibility of operating on a single
products, also on the processing line (Downey et al., 2005; Lee, Jeon, &
Harbers, 1997; Martín-del-Campo, Picque, Cosío-Ramírez, & Corrieu,
2007a,b; Rodriguez-Saona, Koca, Harper, & Alvarez, 2006). The infor-
mation on quality parameters can be associated with the electronic
traceability, as in the case of experiments carried out on Parmesan
cheese (Kahn, 2005; Regattieri, Gamberi, & Mancini, 2007; Zanasi,
Nasuelli, Buccolini, & Pulga, 2008).
The aim of the present work was the experimental testing of
a system which integrates an electronic tracing system with a non-
destructive quality analysis system for each single unit of cheese
product. This system records the two typologies of information on
a web platform. This was carried out in order to obtain a complete
procedure of quality tracing and information and to develop an
“infotracing system”. For the present research activity, an info-
tracing system was developed on a dairy niche product called
“Caciottina massaggiata di Amaseno”, a typical Italian cheese
produced in Lazio Region and prepared with buffalo milk.
2. Materials and methods
2.1. Cheese samples
Cheese wheels of “Caciottina massaggiata di Amaseno” were
produced in the cheese factory “San Lorenzo in Valle” located in
Amaseno (LT, Italy). The product, according to the production
protocol, was periodically subjected to manipulations by hand with
a mixture of olive oil and wine and to overturning until the end of
seasoning, which has a minimum duration of 60 days.
2.2. Identification devices
Two different RFID tags were used for the present experimen-
tation: TAG cheese HF2009 and TAG cheese arrow screw (Fig. 1).
Four Tags of each type were inserted in four cheese samples, for
a total of eight tested wheels. Tag were inserted at the time of
production (T0) and the tags’ reading was performed at time 0 and
3, 6, 9 months (maturation times: T3, T6 and T9) after T0. The tags’
reader was CPR.MR50-USB Multi ISO (ISO14443-A/B, ISO15693 &
NFC). A specific reading and database software was realized using
the open source Python Programming Language. The range of the
antenna was 10 cm.
2.3. Quality analyses
Chemical and spectrophotometric analyses were carried out on
a total of 23 cheese wheels (8 with RFID tags), according to the
following scheme: i. chemical analyses were carried out at T0 on 3
cheese wheels without RFID tags; ii. chemical and spectrophoto-
metric analyses were carried out at T3 and T6 on 3 cheese wheels
without RFID tags; iii. chemical and spectrophotometric analyses
were carried out at T9 on 8 cheese wheels with RFID tags.
On each cheese wheel 6 slices were cut along the length: two
samples (internal part) were obtained from the central slice, two
samples (median part) were obtained cutting 2 slices at 2 cm from
the central one, the last two samples (external part) were obtained
from the remaining part.
These sampling methods were chosen in order to obtain
analytical parameters of reference to be used for the evaluation of
cheese with unusual fermentations or defects, which frequently
occur in limited areas within the whole cheese wheel.
2.3.1. Chemical analyses
The following chemical analyses were performed: dry matter by
drying in oven at 102 C (International standard FIL-IDF 4/A: 1982);
fat (3433:1975 e Determination of fat content e Van Gulik
method); pH by potentiometric measurement by direct insertion of
the electrode in the cheese wheel; sodium chloride by titration
with AgNO3 (International Standard FIL-IDF 88/A: 1988).
2.3.2. Spectrophotometric analyses
For the VISeNIR measurements, a (portable) single channel
spectrophotometer was used. The system is composed of five parts:
(1) a Hamamatsu S 3904 256Q spectrograph in a special housing;
a customized illumination system realized by a 20 W halogen lamp
Fig. 1. RFID tag typologies used in the experimentation: TAG cheese HF2009 and TAG cheese arrow screw.
P. Papetti et al. / Food Control 27 (2012) 234e241 235
and an optical fibre bundle consisting of approx. 30 quartz glass; (2)
an optical entrance with input round: 70 mm  2500 mm and
diameter 0.5 mm NA ¼ 0.22 mounted in SubMiniature version A-
coupling; (3) specific probes with quartz optical fibre of connec-
tion; (4) a transmission device for transmitted or absorbed light for
thin solids or liquid with variable optical length; (5) a notebook
equipped with specific software to acquire, calibrate and elaborate
spectral data. The Hamamatsu spectrograph has the following
characteristics: grating: flat-field, 366 line/mm (centre); spectral
range: 310e1100 nm; wavelength accuracy absolute: 0.3 nm;
temperaturedinduced drift: 0.02 nm/K; resolution (Rayleigh-
criterion): DlRayleigh  10 nm; sensitivity: 1013 Counts/Ws
(with 14-Bit-conversion); straylight: 0.8% with halogen lamp and
16 bit A/D converter.
For spectral acquisition, the ‘pen’ probe was used to measure the
spectral reflectance response on each sample for three repetitions
(spot area z 10 mm2
).
To avoid high signal noise typical of the tails of the spectral
range, only values between 400 and 800 nm were considered.
2.4. Statistical analysis
A two-way analysis of variance (Two-Way ANOVA) was used to
assess the statistically significant differences among the chemical
variables (pH, moisture, chlorides and fat content) for different
maturation times and for the three different cheese portions. A
multi-comparison between factors’ means was performed by
a Least Significant Difference (LSD) test.
Predictions of chemical content were performed by Partial Least
Squares regressions (PLS) on reflectance values. Classification of the
cheese maturation times was carried out by Partial Least Squares
Discriminant Analysis (PLSDA) on reflectance values.
These two multivariate supervised methods are based on Partial
Least Squares (PLS) (Wold, Sjostrom,  Erikssonn, 2001) and are
widely used to find the correlations between the output signals of
a multi-channel device and the information enclosed in a certain
number of measures. The model operates through a specific algo-
rithm (SIMPLS; De Jong, 1993) for two types of analysis: i) quanti-
tative predictions (PLS, see Menesatti et al., 2010 for more details)
and ii) classifications or modelling (PLSDA, see Menesatti et al.,
2008 for more details).
The degree of estimation accuracy in quantitative prediction
must be inferred by the direct comparison between the measured
and the estimated response variable, by calculating different
parameters of the prediction efficiency: coefficient of correlation (r)
between measured and predicted values, RMSE (Root Mean Square
Error); SEP (standard error of prediction).
The PLSDA analysis provides the percentage of correct classifi-
cation of each class. This analysis expresses also the statistical
parameters indicating the modelling efficiency indicated by sensi-
tivity and specificity parameters. The sensitivity is the percentage
of the species of a category accepted by the class model. The
specificity is the percentage of the species of the categories
different from the modelled one, rejected by the class model (Costa
et al., 2008).
In order to grant a higher strength and ability of generalization
to the modelling analysis, the strategy used of both PLS and PLSDA
multivariate analysis was as follows:
1. Repartition of the entire dataset (DS) into two parts:
a dataset for the training or model (DM), including the 75% of
DS;
b dataset for the validation or test (DT) including the
remaining 25% of the entire DS.
2. The repartition was carried out by:
c partitioning algorithm that takes into account the vari-
ability in both X- and Y-spaces called sample set partition-
ing based on joint x-y distances (SPXY; Harrop Galvao et al.,
2005) for PLS;
d extraction function based on distances and on
KennardeStone algorithm for PLSDA (Kennard  Stone,
1969).
The y- and x-block variables were pre-processed with different
algorithms in order to limit or to enhance the scale effects, drifts
and noises. In Table 1, the list of utilized algorithms is indicated.
The DM was used for the development of different models
derived from the factorial combination of: increasing number
of Latent Variables (LV, from 1 to 20), different types of pre-
processing for X-block (14) and different types of pre-processing
for Y-block (4) e only for PLS models.
About 30,000 models and tests were classified in terms of their
ability of transferability and robustness (Brown, 2009), using
a combined parameter (RPD) that provides a standardization of the
SEP or of the RMSE. The RPD is the ratio between the standard
deviation of the measured laboratory (reference) data (Ystd) and
the SEP (Williams, 2001) or between the Ystd and the RMSE
(Viscarra-Rossel, Taylor,  McBratney, 2007). The RPD was calcu-
lated on both the training and the validation set. The optimum
models were selected using the RPD based on RMSE. For the RPD
performance evaluation, the classification proposed by Viscarra-
Rossel et al. (2007) is the following: RPD 1.0 indicates a very
poor model; 1.0 to 1.4 indicates a poor model; 1.4 to 1.8 indicates
a fair model; 1.8 to 2.0 indicates a good model; 2.0 to 2.5 is very
good and 2.5 is excellent. The modelling iteration was developed
through an appropriate software routine, realized in Matlab 7.1 and
PLS toolbox 4.0 environment.
2.5. Infotracing web-based system
The aim of the web-based tracing system refers to the
improvement of the products logistic management by increasing
its quality and information transparency for the consumer. This
objective was carried out by collecting a set of scientific and
Table 1
List of pre-processing algorithms applied on PLS and PLSDA dataset.
Label Description
Abs Takes the absolute value of the data
Autoscale Centres columns to zero mean and scales to
unit variance
Baseline Baseline (weighted least squares)
Centring Multiway centre
Detrend Remove a linear trend
Diff1 Differences between adjacent variables (approximate
derivatives)
GLS weighting Generalized least squares weighting
Groupscale Group/block scaling
Log 1/R Transformation of reflectance in absorbance
following log (1/R) formula
Log 10 Log 10
Logdecay Log decay scaling
Mean centre Centre columns to have zero mean
Median centre Centre columns to have zero median
Msc (mean) Multiplicative scatter correction with offset, the mean is the
reference spectrum
None No pre-processing
Normalize Normalization of the rows
Osc Orthogonal signal correction
Scaling Multiway scale
Sg SavitskyeGolay smoothing and derivatives
Snv Standard normal variate
Sqmnsc Scale each variable by the square root of its mean
P. Papetti et al. / Food Control 27 (2012) 234e241236
productive information which follow the product shelf-life from
producer to consumer, providing web-based tools for each cate-
gory. The categories involved in this system are divided into
manufacturers, wholesalers, resellers, retailers and consumers
who contribute separately, according to their level of member-
ship, to provide a set of data related to each product. All the
collected data will enter into a centralized database. Computer
companies, specialized in CED (Center Data Elaboration), will
manage this database by providing web hosting and backup
services. This management structure guarantees the uniqueness
and the centrality of the acquired data maintaining a controlled
access for each system part in order to ensure their integrity. In
this work we will consider only those companies able to respect
the standards provided in ISO/IEC 27001:2005 (ISO/IEC 27001,
2005).
The proposed system is divided in 4 phases (Fig. 2):
1) Manufacturer
The product is identified by RFID technology (personal
computer and RFID tags) and its quality information, chemical and
spectrophotometric analyses developed are stored into the
centralized database through a web application. Moreover infor-
mation on milk, producer and animals (farming type, animal
feeding), cheese producer, manipulation and processing treat-
ments, hygienic and sanitary controls performed during time,
micro-climatic characteristics of conservation and maturation of
the product will be stored.
2) Wholesalers, resellers and retailers
The categories involved in this phase can monitor the supply
chain of each product through the centralized database and
improve their tracing by adding quality information into the system
through a web application.
3) Consumers
The consumers can control the supply chain of each product
using the RFID readers provided by the resellers and/or retailers
and by the web (browser personal computer) and smartphone
applications (APP) inserting the RFID tag code. Also the consumers
can improve the product tracing by adding feedback information on
the quality of the product into the system through a web services as
blog and forum.
4) Research institutions and statistics
Through the centralized database all the research institutions
can use the quality information collected by the categories, to
statistics and marketing scopes.
The implemented web software is structured to provide
various services to all the categories thanks to the API (Applica-
tion Programming Interface). This allows to the manufacturer,
wholesalers, resellers etc., the possibility to implement the
acquisition and/or writing system following their needs and
available technologies and ensuring uniformity of data to consult
or send.
This Infotracing system can provide also a reference web inter-
face to access to the product info card displaying all information
and data released as feedback by the manufacturer, wholesaler,
reseller, retailer and consumer.
2.5.1. Software architecture
The selected software architecture is the Three-Tier (software
module implementing one or more conceptual layers) that allows
to create a client/server architecture to integrate different systems
(within a LAN, Over Internet) in which the clients are independent
from each others (Ramakrishnan  Gehrke, 1999). It is possible to
obtain different levels of presentation client specific. All the
application logic relies within intermediate state and ensures to the
Fig. 2. Infotracing web-based system: flowchart of the architecture of the different phases.
P. Papetti et al. / Food Control 27 (2012) 234e241 237
system more portable, handy at maintenance, handy at updating
the two tiers, more flexibility and greater scalability.
The Internet-client is the applicative layer that refers to clients
over Internet (personal computer, workstations and smartphones).
The presentation-layer, composed by the web server, manages the
communication with the independent external clients. The
application-layer processes data and produces the results to forward
tothepresentation-layer. The resource-layeristhe layerthat manages
the data required for the system functioning. Into the Internet-client-
layer there are the different categories which access to the system by
web. The presentation-, application- and resource-layers are imple-
mented into the CED structure and provide management services for
the various categories through the web server.
The language implemented for the configuration application of
the local central system was Python while Java language was
implemented to allow the simplification of the application writings
of network, permitting a system interoperability and implementing
an applicative logic for the different technologies and not for the
different devices. For example, for the mobile technology only
a software independent of the mobile device (iPhone, Andorid,
Windows Mobile, Symbian) has been configured. In terms of
deployment a database management system (DBMS) relational was
chosen supporting stored procedures and triggers (ability to handle
part of the application logic of the server).
3. Results
The production information concerning cheese samples equip-
ped with RFID tags and used in the present research activity were
inserted in the infotracing web-based system to be used as
production reference for RFID tracing and indirect quality charac-
terizations of the final product.
All the RFID tags performed a correct reading at all monitored
production stages. Despite the continuous handling due to the
cheese manipulation at T9 no tags moved away: they were all
perfectly in service and inserted in the cheese wheels. Only the
samples with “Cheese arrow screw” tags showed at T3 some
ruptures in the rind that became more and more evident during the
maturation, leading to the formation of moulds after 9 months. On
the other hand, tags HF2009 remained in service and well visible
also at T9, without showing particular problems for cheese sale and
consumption.
In Table 2 the mean value for the chemical parameters (pH,
moisture, chlorides and fat content), of the internal, median and
external cheese wheel parts, during the 9 months of the experi-
ment were reported together with the two-way ANOVA results.
For the maturation time results, all the parameters (pH, mois-
ture, chlorides content and fat content) presented statistically
significant differences between all the maturation classes (p  0.05).
Table 2
Mean values and statistical analysis (ANOVA and LSD multi-comparison between factors) of the chemical parameters measured for different maturation months and position
on cheese wheels. For the significance, different letters indicate significant differences for P  0.05.
2-Way ANOVA results Month Significance Position
External Median Internal Mean
Source d. f. Mean sq. Prob  F a a a
pH
Month 3 0.62338 0.031923 0 a 5.22 5.12 5.12 5.15
Position 2 0.011852 0.94126 3 b 5.59 5.58 5.58 5.59
Month position 6 0.013005 0.99874 6 ab 5.42 5.35 5.35 5.37
Error 48 0.19554 9 a 5.12 5.18 5.18 5.16
Total 59
2-Way ANOVA results Month Significance Position
External Median Internal Mean
Source d. f. Mean sq. Prob  F a a a
Moisture
Month 3 2265.8 0 0 a 58.70 53.06 53.06 54.94
Position 2 17.007 0.25641 3 b 39.42 38.86 38.86 39.05
Month position 6 22.176 0.11386 6 c 29.79 30.42 30.42 30.21
Error 48 12.145 9 c 27.20 29.60 29.60 28.80
Total 59
2-Way ANOVA results Month Significance Position
External Median Internal Mean
Source d. f. Mean sq. Prob  F a b b
Chlorides content
Month 3 0.56134 0 0 a 1.37 1.29 1.29 1.31
Position 2 0.31923 1.02E-10 3 b 2.12 1.56 1.56 1.75
Month position 6 0.11275 5.82E-09 6 c 1.64 1.56 1.56 1.59
Error 48 0.008273 9 d 1.40 1.36 1.36 1.37
Total 59
2-Way ANOVA results Month Significance Position
External Median Internal Mean
Source d. f. Mean sq. Prob  F a b ab
Fat content
Month 3 75.279 0 0 a 21.09 19.23 19.23 19.85
Position 2 2.9004 0.064135 3 a 18.83 18.53 18.53 18.63
Month position 6 3.8298 0.003292 6 b 21.67 21.00 21.00 21.22
Error 48 0.99666 9 c 24.10 23.90 23.90 23.96
Total 59
P. Papetti et al. / Food Control 27 (2012) 234e241238
The pH average values of the different portions during the
ageing time reported in Table 2 didn’t show statistically significant
differences, although the central part showed a lower pH compared
to the external portion.
In Table 2, the average moisture trend was shown for the three
different cheese sections (external, median and internal), according
to ageing time. During the cheese maturation, moisture decrease by
evaporation led to a progressive weight decline and afterwards
there was a progressive dehydration during the following matu-
ration phase of 35e40%. Moisture content decreased in a statisti-
cally significant way in the first maturation time, until the sixth
month, while, later, moisture decrease is less relevant in
percentage. An appreciable difference between the cheese centre
and periphery remained: the internal portion had a higher mois-
ture content than the external, of about 2 units.
Concerning chlorides content, the salt diffusion into the cheese
e from the external to the central portion e starts immediately
after the production and continues during the maturation time.
Concerning the interaction month/position, only for chlorides and
fat content a statistically significant difference was reported.
The chemical parameters resulted significantly independent
from the samples position measurement.
Table 3 reports the characteristics of the four best models
selected (one for each quality parameter) basing on the highest RPD
value of the test set. For all selected models, y-block was pre-
processed with the Matlab ‘median center’ algorithm. The pH
model was based on 15 LV and characterized by a ‘baseline’ pre-
processing for x-block. The moisture model was based on 12 LV,
with a ‘baseline’ pre-processing for x-block. The chlorides content
model was based on 19 LV and characterized by a ‘Diff1’ first pre-
processing for x-block followed by a ‘Log 10’ second pre-
processing for x-block. Finally, the selected fat content model
used 7 LV and a ‘sg’ pre-processing for x-block. All the models
presented high values of the correlation coefficient (r) (ranging
from 0.73 to 1), slightly higher in the training test compared to the
validation phase. In the training set phase, the RMSE, which has the
same measurement unit as the quantity being estimated, results
lower for the chlorides content and the pH models, while it is
higher for the moisture content model. For the fat content model,
RMSE has the highest values of all the four models. Concerning the
validation set, the lowest values of RMSE are those of pH and
chlorides content models, while higher values result respectively
for moisture and fat content models. On the basis of the Viscarra-
Rossel et al. (2007) RPD classification, the 4 models showed that
the pH (RPD ¼ 1.5) can be considered as a fair model, the water and
chlorides content (respectively RPD ¼ 1.8 and 1.9) are good models,
but the fat content model presents a RPD ¼ 1.4, showing a quite fair
model performance. These results are supported also by the eval-
uation of the correlation between observed and estimated values.
All the parameters presented quite good coefficients of correlation
in validation, being the lower value equal to 0.73 for Fat content and
the highest 0.87 for Chlorides content.
Several PLSDA models were generated in order to discriminate
between three different cheese maturation times. Table 4 reports
the characteristics of the resulting best model, based on 6 LV. The
model percentage of correct classification (89.5%) and of validation
test (89.5%) showed high values and also the class prediction
(88.9%). The model presented also very high values of sensitivity
(92.6%) and specificity (91.5%). The confusion matrix of the 25% of
the individuals of the model was reported in Table 5; it is possible to
observe that the efficiency of classification results very high,
considering that the random percentage was 25% and that only 2
cases out of 19 (10.5%) were wrongly classified. Moreover, the error
of classification was between two classes close one to the other (T3
vs T6), while the model correctly estimated classes with a wider
extension of time.
4. Discussion
The present work showed an integrated application of an RFID
system together with qualitative analyses (chemical and spectro-
photometric) and an infotracing system on a traditional Italian
dairy product. Other experiences in literature reported that RFID
has been successfully applied to food logistics and supply chain
management processes because of its ability to identify, categorize,
and manage the flow of goods (Ruiz-Garcia, Lunadei, Barreiro, 
Robla, 2009). Fukatsu and Nanseki (2009) proposed a farm opera-
tion monitoring system using “Field Servers” and a wearable device
equipped with an RFID reader and motion sensors in order to
monitor crop growth, field environment, and farming operations.
Regattieri et al. (2007) developed a traceability system on
Parmesan cheese based on an integration of alphanumerical codes
and RFID technologies with positive consequences for both
manufacturers and for consumers. The reading system is portable
and of easy utilization and configuration (Dolgui  Proth, 2008).
The use of an open source programming language (Lwoga 
Chilimo, 2006), as we did when using Python software, repre-
sents an advantage in terms of costs, flexibility and possibility of
diffusion of the technology also to promote local cheese producers
(Dubeuf, Ruiz Morales,  Castel Genis, 2010). As also observed by
Pérez-Aloe et al. (2007) both tested RFID tags showed a perfect
degree of readings, but, in our case, the cheese arrow screw one
caused ruptures. Moreover, both tags were extremely robust and
Table 3
Results of Partial Least Squares (PLS) multivariate analysis to predict four different
independent variables (pH, moisture, chlorides and fat). In the table are reported:
number of Latent Vectors (LV), correlation coefficient (r), Standard Error of Predic-
tion (SEP), Root Mean Squares Error (RMSE) and Ratio of Percentage Deviation (RPD).
pH Moisture Chlorides Fat
Model (training set)
N
LV 15 12 19 7
First pre-processing
X-block
Baseline sg Diff1 sg
Second pre-processing
X-block
Log 10
Pre-processing Y-block Median
centre
Median
centre
Median
centre
Median
centre
r (observed vs predicted) 0.9558 0.7879 1 0.7421
SEP 0.053 3.153 0.0004 1.94
RMSE 0.053 3.128 0.0004 1.924
RPDTrain 1.5572 1.8493 1.9552 1.3846
TEST (validation set)
r (observed vs predicted) 0.777 0.8551 0.8661 0.7333
SEP 0.122 3.194 0.038 2.225
RMSE 0.121 3.138 0.038 2.207
RPDtest 1.5371 1.8166 1.9445 1.3737
Table 4
Results of Partial Least Squares Discriminant Analysis (PLSDA) for the four matu-
ration times (T0, T3, T6 and T9) obtained with spectrophotometric measurements. n.
LV is the number of latent vectors. Random probability (%) is the probability of
random assignment of an individual into a unit.
Pre-processing X-block Baseline
Pre-processing Y-block None
n. LV 6
Sensitivity 0.926
Specificity 0.915
% Random probability 25.000
% Class prediction 88.889
% Correct classification model (75%) 89.474
% Correct classification independent test (25%) 89.474
P. Papetti et al. / Food Control 27 (2012) 234e241 239
resistant to mechanical damage in relation to handling, cutting, and
compression. The main issue in order to avoid the tag’s ingestion is
to increase its visibility. This could be enhanced with vivid colours
and by positioning it just below the cheese rind. Varese, Buffagni,
and Percivale (2008) indicated that the positioning of the tags did
not affect readability.
Concerning the chemical analyses, the obtained data seem to
confirm that during maturation, pH reaches a maximum level
around the third month, while afterwards equilibrium is estab-
lished, as a result of the opposed proteolysis effect from which
ammonia is produced and lipolysis leads to a fatty acids release
(Zapparoli  Duroni, 1997). Moisture into the analysed sections
(external, median and internal) regularly decreased during time, as
described in previous works (Resmini, Volonterio, Annibaldi, 
Ferri, 1997). After six months the salt concentration in the
external area resulted higher in a statistically significant way than
that in the internal portion, as already evidenced by Fossa, Sandri,
Scotti, and Malacarne (2007). Average sodium chloride values
(see Table 2) were comparable with those reported in literature
(Tosi, Sandri, Tedeschi, Fossa,  Franceschi, 2007; Tosi, Sandri,
Tedeschi, Malacarne,  Fossa, 2008). The fat amount into the
“Caciottina massaggiata di Amaseno” is mainly related to the milk
fat/casein ratio: this parameter depends on the fat amount in the
starting milk and on the transformation technology (Fossa et al.,
2007). Fat content showed a significant decrease during the
maturation period. The uneven moisture distribution and the pH
variation explain also the differences in fat amounts (see Table 2).
Results on spectrophotometric analysis confirm what reported
by Curda and Kukackováb (2004) for the determination of the
processed cheese composition (dry matter, fat content and pH) by
NIR spectroscopy techniques. A portable VISeNIR system was used
directly in the production location, as reported by Antonucci et al.
(2010). As this is a non-destructive technique, it is possible to
hypothesize a continuous monitoring of cheese chemical charac-
teristics during time of maturation and an always accessible web-
based reporting system.
The estimation of maturation degree by spectral analysis is
a very important, as reported by Downey et al. (2005) and it could
be used in the cheese factory during the product maturation to
characterize the ripening stages, as performed by Martín-del-
Campo et al. (2007a,b).
The RFID system turned out as effective, reliable and compatible
with the production process tool. The spectral-based quality esti-
mation of pH, water, chlorides and fat content provided good
results that could allow an effective monitoring of the characteristic
for each, single cheese wheel. Also a good estimation of maturation
degree by spectral analysis was obtained.
Concerning the infotracing on the web site, our system could be
soon tested on a large scale, in order to enable the different
stakeholders to access to the information on production and on the
characteristics of cheese producer and farmer (concerning milk
origin), entering the RFID code or even a bar-code in casein. In
addition, the stakeholders can have access to the information on
maturity degree and on quality characteristics, identified by non-
destructive spectral systems. This is finalized to increase trans-
parency and to ensure product quality, with important impacts on
the consumer and on the producer. Moreover, the utilization of
a web-based system allows the integration of production and
traceability information with all the other information concerning
the inspection and documentation requirements, as it is often
required to obtain the quality marks. The integration of ICT
(Information and Communication Technology), realized in this
experimental work, is considered of high importance in order to
maximize the following promotion and guarantee keyfactors of
local food products:
- full traceability, from the producer of raw materials to the
single final product;
- guarantee of quality control at all the stages of the supply
chain;
- information transparency, available for the consumer, but also
for third inspection bodies and research institutes);
- direct product promotion without direct mediation and
promotion of its specific characteristics (e.g. organic milk,
cruelty free products);
- direct interaction channel between consumer and producer
(e.g. blog);
- direct marketing and online shopping.
The producer was interested in such application and also the
consumers at marketplaces were curious about this innovative
technology. These facts stress the efficacy in traceability and all the
potential informative development of such system.
5. Conclusions
The consumer or other involved stakeholders can access to the
whole production history and to the quality characteristics of every
single product, by entering the RFID code on the web screen.
Gandino, Montrucchio, Rebaudengo, and Sanchez (2007) adopted
a traceability system based on RFID technology in a fruit warehouse
in order to match traceability with other benefits, such as supply
chain management, commodity value addition and brand
management. There are web platforms that allow the access to
static or dynamic product information for different stakeholders
(Breyer, Daubresse,  Sneyers, 2007; Samad, Murdeshwar, 
Hameed, 2010). A Classical example is represented by the web
systems of main courier services enterprises (FedEx, UPS, DHL, etc.).
Acknowledgements
Authors would like to thank Ms Giuliana Laureti of Cheese
Factory San Lorenzo in Valle e Amaseno (Latina e Italy) for the kind
hospitality and the willingness to provide extensive information
and testing material.
References
Antonucci, F., Pallottino, F., Paglia, G., Palma, A., D’Aquino, S.,  Menesatti, P. (2010).
Non-destructive estimation of mandarin maturity status through portable
VISeNIR spectrophotometer. Food and Bioprocess Technology, 4, 809e813.
Beulens, J. M. A., Broens, D.-F., Folstar, P.,  Hofstede, G. J. (2005). Food safety and
transparency in food chains and networks e relationships and challenges. Food
Control, 16, 481e486.
Breyer, D., Daubresse, P.,  Sneyers, M. (2007). Bringing scientists to the people e
the Co-Extra website. Biotechnology Journal, 2(9), 1081e1085.
Brofman-Epelbaum, F.,  Kluwe Aguiar, L. (2007). Tracking and tracing food prod-
ucts with RFID technology: an application for agricultural commodities. In 17th
annual forum and symposium IAMA conference-Parma, Italy.
Brown, S. D. (2009). Transfer of multivariate calibration models. In S. D. Brown,
R. Tauler,  B. Walczak (Eds.), Comprehensive chemometrics (pp. 345e378).
Oxford: Elsevier.
Costa, C., Aguzzi, J., Menesatti, P., Antonucci, F., Rimatori, V.,  Mattoccia, M. (2008).
Shape analysis of different populations of clams in relation to their geographical
structure. Journal of Zoology, 276(1), 71e80.
Table 5
Confusion matrix.
Predicted T3 T6 T9 Total observed
T3 4 2 0 6
T6 0 6 0 6
T9 0 0 7 7
P. Papetti et al. / Food Control 27 (2012) 234e241240
Costa, C., Aguzzi, J., Menesatti, P., Mànuel, A., Boglione, C., Sarriá, D., et al. (2011).
Versatile application of RFID technology to commercial and laboratory research
contexts: fresh fish supply-chain and behavioural tests. Instrumentation View-
point, 11, 48.
Curda, L.,  Kukackováb, O. (2004). NIR spectroscopy: a useful tool for rapid
monitoring of processed cheeses manufacture. Journal of Food Engineering,
61(4), 557e560.
De Jong, S. (1993). SIMPLS: an alternative approach to partial least squares
regression. Chemometrics and Intelligent Laboratory Systems, 18(3), 251e263.
Dolgui, A.,  Proth, J. M. (2008). RFID technology in supply chain management:
State of the art and perspectives. In Proceedings of the 17th world congress, the
international federation of automatic control, Seoul, Korea, July 6e11, 2008 (pp.
4464e4475).
Downey, G., Sheehan, E., Delahunty, C., O’Callaghan, D., Guinee, T.,  Howard, V.
(2005). Prediction of maturity and sensory attributes of Cheddar cheese using
near-infrared spectroscopy. International Dairy Journal, 15, 701e709.
Dubeuf, J.-P., Ruiz Morales, F. de A.,  Castel Genis, J. M. (2010). Initiatives and
projects to promote the Mediterranean local cheeses and their relations to the
development of livestock systems and activities. Small Ruminant Research,
93(2e3), 67e75.
European Commission. (2002). Regulation (EC) No 178/2002 of the European
Parliament and of the council of 28 January 2002 laying down the general prin-
ciples and requirements of food law, establishing the European Food Safety
Authority and laying down procedures in matters of food safety.
Fossa, E., Sandri, S., Scotti, C.,  Malacarne, M. (2007). La maturazione del latte
durante l’affioramento in diverse condizioni operative. Scienza e Tecnica Lattiero
Casearia, 58, 243e255.
Fukatsu, T.,  Nanseki, T. (2009). Monitoring system for farming operations with
wearable devices utilized sensor networks. Sensors, 9, 6171e6184.
Gandino, F., Montrucchio, B., Rebaudengo, M.,  Sanchez, E. R. (2007). Analysis of an
RFID-based information system for tracking and tracing in an agri-food chain.
RFID Eurasia, 1st Annual, Issue 5e6 Sept. 2007, pp. 1e6.
Giusti, A. M., Bignetti, E.,  Cannella, C. (2008). Exploring new frontiers in total food
quality definition and assessment: from chemical to neurochemical properties.
Food and Bioprocess Technology, 1, 130e142.
Harrop Galvao, R. K., Ugulino Araujo, M. C., Emıdio Jose, G., Coelho Pontes, M. J.,
Cirino Silva, E.,  Bezerra Saldanha, T. C. (2005). A method for calibration and
validation subset partitioning. Talanta, 67, 736e740.
Ilbery, B.,  Kneafsey, M. (1999). Niche markets and regional speciality food prod-
ucts in Europe: towards a research agenda. Environment and Planning A, 31(12),
2207e2222.
ISO/IEC 27001. (2005). International Organization for Standardization. Information
technology e Security techniques e Information security management systems e
Requirements. Geneva: ISO Copyright Office.
Jedermann, R., Ruiz-Garcia, L.,  Lang, W. (2009). Spatial temperature profiling by
semi-passive RFID loggers for perishable food transportation. Computers and
Electronics in Agriculture, 65, 145e154.
Kahn, G. (July 7 2005). Who made my cheese? TAGs track Parmesan’s age, origin.
The Wall Street Journal, B1.
Kennard, R. W.,  Stone, L. A. (1969). Computer aided design of experiments.
Technometrics, 11, 137e148.
Lammers, W.,  Hasselmann, G. (2007). Tracking, Tracing, Effizienz e Temper-
aturgeführte Fleischlogistik mit RFID. LVT Lebensmittel-Industrie, 6, 2e3.
Lee, S. J., Jeon, J.,  Harbers, L. H. (1997). Near-infrared reflectance spectroscopy for
rapid analysis of curds during Cheddar cheese making. Journal of Food Science,
62(1), 53e56.
Lwoga, E. T.,  Chilimo, W. (2006). Open access and open source: considerations for
agricultural academic libraries in promoting collaboration and sharing of
information and knowledge. Quarterly Bulletin of IAALD, 51(4), 177e185.
Martín-del-Campo, S. T., Picque, D., Cosío-Ramírez, R.,  Corrieu, G. (2007a). Eval-
uation of chemical parameters in soft mold-ripened cheese during ripening by
mid-infrared spectroscopy. Journal of Dairy Science, 90(6), 3018e3027.
Martín-del-Campo, S. T., Picque, D., Cosío-Ramírez, R.,  Corrieu, G. (2007b). Middle
infrared spectroscopy characterization of ripening stages of Camembert-type
cheeses. International Dairy Journal, 17, 835e845.
Menesatti, P., Antonucci, F., Pallottino, F., Roccuzzo, G., Allegra, M., Stagno, F., et al.
(2010). Estimation of plant nutritional status by ViseNIR spectrophotometric
analysis on orange leaves [Citrus sinensis (L) Osbeck cv Tarocco]. Biosystems
Engineering, 105, 448e454.
Menesatti, P., Costa, C., Paglia, G., Pallottino, F., D’Andrea, S., Rimatori, V., et al.
(2008). Shape-based methodology for multivariate discrimination among
Italian hazelnut cultivars. Biosystems Engineering, 101(4), 417e424.
Pérez-Aloe, R., Valverde, J. M., Lara, A., Carrillo, J. M., Roa, I.,  Gonzàlez, J. (2007).
Application of RFID tags for the overall traceability of products in cheese
industries. RFID Eurasia, 1e5.
Ramakrishnan, R.,  Gehrke, J. (1999). Database management systems. New York:
McGraw Hill.
Regattieri, A., Gamberi, M.,  Mancini, R. (2007). Traceability of food products:
general framework and experimental evidence. Journal of Food Engineering,
81(2), 347e356.
Resmini, P., Volonterio, G., Annibaldi, S.,  Ferri, G. (1997). Studio sulla diffusione del
sale nel formaggio Parmigiano-Reggiano mediante l’uso di Na36Cl. Scienza e
Tecnica Lattiero Casearia, 48, 73e82.
Rodriguez-Saona, L. E., Koca, N., Harper, W. J.,  Alvarez, V. B. (2006). Rapid deter-
mination of Swiss cheese composition by Fourier transform infrared/attenuated
total reflectance spectroscopy. Journal of Dairy Science, 89(5), 1407e1412.
Ruiz-Garcia, L., Lunadei, L., Barreiro, P.,  Robla, J. I. (2009). A review of wireless
sensor technologies and applications in agriculture and food industry: state of
the art and current trends. Sensors, 9, 4728e4750.
Ruiz-Garcia, L., Steinberger, G.,  Rothmund, M. (2010). A model and prototype
implementation for tracking and tracing agricultural batch products along the
food chain. Food Control, 21(2), 112e121.
Samad, A., Murdeshwar, P.,  Hameed, Z. (2010). High-credibility RFID-based animal
data recording system suitable for small-holding rural dairy farmers. Computers
and Electronics in Agriculture, 73(2), 213e218.
Sarriá, D., Del Río, J., Mànuel, A., Aguzzi, J., Sardà, F.,  García, J. A. (2009). Studying
the behaviour of Norway lobster using RFID and infrared tracking technologies.
In Proceeding of the Oceans’09 IEEE-Bremen, 1e4. doi:10.1109/
OCEANSE.2009.5278280.
Tosi, F., Sandri, S., Tedeschi, G. F., Fossa, E.,  Franceschi, P. (2007). Contenuto di
umidità, valori di acido lattico, acidi grassi volatili e pH del Parmigiano-
Reggiano, in diverse zone della pasta, a 72 ore dalla produzione. Scienza e
Tecnica Lattiero Casearia, 58, 291e301.
Tosi, F., Sandri, S., Tedeschi, G. F., Malacarne, M.,  Fossa, E. (2008). Variazione di
composizione e proprietà chimico-fisiche del parmigiano reggiano durante la
maturazione e in differenti zone della forma. Scienza e Tecnica Lattiero Casearia,
59(6), 507e528.
Varese, E., Buffagni, S.,  Percivale, F. (2008). Application of RFID technology to the
agro-industrial sector: analysis of some case studies. Journal of Commodity
Science Technology and Quality, 47(1e4), 171e190.
Viscarra-Rossel, R. A., Taylor, H. J.,  McBratney, A. B. (2007). Multivariate calibration
of hyperspectral gamma-ray energy spectra for proximal soil sensing. European
Journal of Soil Science, 58, 343e353.
Williams, P. C. (2001). Near-infrared technology in the agricultural and food industries.
Saint Paul, MN, USA: American Association of Cereal Chemists.
Wold, S., Sjostrom, M.,  Erikssonn, L. (2001). PLS-regression: a basic tool of che-
mometrics. Chemometrics and Intelligent Laboratory Systems, 58, 109e130.
Woodcock, T., Fagan, C. C., O’Donnell, C. P.,  Downey, G. (2008). Application of near
and mid-infrared spectroscopy to determine cheese quality and authenticity.
Food and Bioprocess Technology, 1, 117e129.
Xiong, B. H., Luo, Q., Yang, L., Fu, R., Lin, Z.,  Pan, J. (2007). A practical web-based
tracking and traceability information system for the pork products supply
chain. New Zealand Journal of Agricultural Research, 50, 725e733.
Zanasi, C., Nasuelli, P., Buccolini, F.,  Pulga, A. (2008). Organic parmesan cheese on-
line traceability: a feasible solution. In 16th IFOAM organic world congress,
Modena, Italy, June 16e20, 2008, Archived at. http://orgprints.org/view/projects/
conference.html.
Zapparoli, G. A.,  Duroni, F. (1997). Quadro analitico di acidi grassi volatili, pH ed
umidità in formaggio grana “scelto” da 1 a 20 mesi di stagionatura. Scienza e
Tecnica Lattiero Casearia, 48, 297e304.
P. Papetti et al. / Food Control 27 (2012) 234e241 241

More Related Content

Similar to A RFID web-based infotracing system for the artisanal Italian cheese quality traceability

IRJET - Research on Traceability of Agricultural Product based Mostly on Net ...
IRJET - Research on Traceability of Agricultural Product based Mostly on Net ...IRJET - Research on Traceability of Agricultural Product based Mostly on Net ...
IRJET - Research on Traceability of Agricultural Product based Mostly on Net ...IRJET Journal
 
Transformative Power of Traceability Systems in Food Manufacturing.pdf
Transformative Power of Traceability Systems in Food Manufacturing.pdfTransformative Power of Traceability Systems in Food Manufacturing.pdf
Transformative Power of Traceability Systems in Food Manufacturing.pdfFood Traceability System
 
20131129 FFF El proyecto Foodmanufuture_Christophe Cotillon
20131129 FFF El proyecto Foodmanufuture_Christophe Cotillon20131129 FFF El proyecto Foodmanufuture_Christophe Cotillon
20131129 FFF El proyecto Foodmanufuture_Christophe CotillonFIAB
 
food quality detection.pptx
food quality detection.pptxfood quality detection.pptx
food quality detection.pptxameysalunke
 
Automation & use of computer in food analysis
Automation & use of computer in food analysisAutomation & use of computer in food analysis
Automation & use of computer in food analysisNISHANK WAGHMARE
 
The Research of the Tracking and Traceability System for Vegetable Quality As...
The Research of the Tracking and Traceability System for Vegetable Quality As...The Research of the Tracking and Traceability System for Vegetable Quality As...
The Research of the Tracking and Traceability System for Vegetable Quality As...ijceronline
 
The existing and future role of RFID technology in Dairy Supply Chain from Fa...
The existing and future role of RFID technology in Dairy Supply Chain from Fa...The existing and future role of RFID technology in Dairy Supply Chain from Fa...
The existing and future role of RFID technology in Dairy Supply Chain from Fa...Shuhab Tariq
 
Seminar on computerization in food industries.pptx
Seminar on computerization in food industries.pptxSeminar on computerization in food industries.pptx
Seminar on computerization in food industries.pptxAdarsh N D
 
Ensuring Integrity for Medical Tissues and Devices
Ensuring Integrity for Medical Tissues and DevicesEnsuring Integrity for Medical Tissues and Devices
Ensuring Integrity for Medical Tissues and DevicesTerso Solutions
 
A Food Monitoring System Based on Bluetooth Low Energy and Internet of Things
A Food Monitoring System Based on Bluetooth Low Energy and Internet of ThingsA Food Monitoring System Based on Bluetooth Low Energy and Internet of Things
A Food Monitoring System Based on Bluetooth Low Energy and Internet of ThingsIJERA Editor
 
Smart food storage and waste reduction.docx
Smart food storage and waste reduction.docxSmart food storage and waste reduction.docx
Smart food storage and waste reduction.docxNIMMANAGANTI RAMAKRISHNA
 
Food traceability
Food traceabilityFood traceability
Food traceabilityMunna Joy
 
IRJET- An Efficient System to Detect Freshness and Quality of Food
IRJET- An Efficient System to Detect Freshness and Quality of FoodIRJET- An Efficient System to Detect Freshness and Quality of Food
IRJET- An Efficient System to Detect Freshness and Quality of FoodIRJET Journal
 
RFID_main_application_for_Agri-food_products_online.ppt
RFID_main_application_for_Agri-food_products_online.pptRFID_main_application_for_Agri-food_products_online.ppt
RFID_main_application_for_Agri-food_products_online.pptLeena Kumari
 
S3FOOD Study visit connsensys asincar
S3FOOD Study visit connsensys asincarS3FOOD Study visit connsensys asincar
S3FOOD Study visit connsensys asincarNancy Tarjenian
 
IRJET - Blockchain based Food Supply Chain
IRJET - Blockchain based Food Supply ChainIRJET - Blockchain based Food Supply Chain
IRJET - Blockchain based Food Supply ChainIRJET Journal
 
IOT Based Monitoring of Fruit Freshness Using Arduino Nano
IOT Based Monitoring of Fruit Freshness Using Arduino NanoIOT Based Monitoring of Fruit Freshness Using Arduino Nano
IOT Based Monitoring of Fruit Freshness Using Arduino NanoIRJET Journal
 
FIWARE Wednesday Webinars - Architecting Your Smart Solution Using FIWARE
FIWARE Wednesday Webinars - Architecting Your Smart Solution Using FIWAREFIWARE Wednesday Webinars - Architecting Your Smart Solution Using FIWARE
FIWARE Wednesday Webinars - Architecting Your Smart Solution Using FIWAREFIWARE
 
IRJET- Blockchain based Fake Product Identification in Supply Chain
IRJET- Blockchain based Fake Product Identification in Supply ChainIRJET- Blockchain based Fake Product Identification in Supply Chain
IRJET- Blockchain based Fake Product Identification in Supply ChainIRJET Journal
 

Similar to A RFID web-based infotracing system for the artisanal Italian cheese quality traceability (20)

IRJET - Research on Traceability of Agricultural Product based Mostly on Net ...
IRJET - Research on Traceability of Agricultural Product based Mostly on Net ...IRJET - Research on Traceability of Agricultural Product based Mostly on Net ...
IRJET - Research on Traceability of Agricultural Product based Mostly on Net ...
 
Transformative Power of Traceability Systems in Food Manufacturing.pdf
Transformative Power of Traceability Systems in Food Manufacturing.pdfTransformative Power of Traceability Systems in Food Manufacturing.pdf
Transformative Power of Traceability Systems in Food Manufacturing.pdf
 
12. 23316.pdf
12. 23316.pdf12. 23316.pdf
12. 23316.pdf
 
20131129 FFF El proyecto Foodmanufuture_Christophe Cotillon
20131129 FFF El proyecto Foodmanufuture_Christophe Cotillon20131129 FFF El proyecto Foodmanufuture_Christophe Cotillon
20131129 FFF El proyecto Foodmanufuture_Christophe Cotillon
 
food quality detection.pptx
food quality detection.pptxfood quality detection.pptx
food quality detection.pptx
 
Automation & use of computer in food analysis
Automation & use of computer in food analysisAutomation & use of computer in food analysis
Automation & use of computer in food analysis
 
The Research of the Tracking and Traceability System for Vegetable Quality As...
The Research of the Tracking and Traceability System for Vegetable Quality As...The Research of the Tracking and Traceability System for Vegetable Quality As...
The Research of the Tracking and Traceability System for Vegetable Quality As...
 
The existing and future role of RFID technology in Dairy Supply Chain from Fa...
The existing and future role of RFID technology in Dairy Supply Chain from Fa...The existing and future role of RFID technology in Dairy Supply Chain from Fa...
The existing and future role of RFID technology in Dairy Supply Chain from Fa...
 
Seminar on computerization in food industries.pptx
Seminar on computerization in food industries.pptxSeminar on computerization in food industries.pptx
Seminar on computerization in food industries.pptx
 
Ensuring Integrity for Medical Tissues and Devices
Ensuring Integrity for Medical Tissues and DevicesEnsuring Integrity for Medical Tissues and Devices
Ensuring Integrity for Medical Tissues and Devices
 
A Food Monitoring System Based on Bluetooth Low Energy and Internet of Things
A Food Monitoring System Based on Bluetooth Low Energy and Internet of ThingsA Food Monitoring System Based on Bluetooth Low Energy and Internet of Things
A Food Monitoring System Based on Bluetooth Low Energy and Internet of Things
 
Smart food storage and waste reduction.docx
Smart food storage and waste reduction.docxSmart food storage and waste reduction.docx
Smart food storage and waste reduction.docx
 
Food traceability
Food traceabilityFood traceability
Food traceability
 
IRJET- An Efficient System to Detect Freshness and Quality of Food
IRJET- An Efficient System to Detect Freshness and Quality of FoodIRJET- An Efficient System to Detect Freshness and Quality of Food
IRJET- An Efficient System to Detect Freshness and Quality of Food
 
RFID_main_application_for_Agri-food_products_online.ppt
RFID_main_application_for_Agri-food_products_online.pptRFID_main_application_for_Agri-food_products_online.ppt
RFID_main_application_for_Agri-food_products_online.ppt
 
S3FOOD Study visit connsensys asincar
S3FOOD Study visit connsensys asincarS3FOOD Study visit connsensys asincar
S3FOOD Study visit connsensys asincar
 
IRJET - Blockchain based Food Supply Chain
IRJET - Blockchain based Food Supply ChainIRJET - Blockchain based Food Supply Chain
IRJET - Blockchain based Food Supply Chain
 
IOT Based Monitoring of Fruit Freshness Using Arduino Nano
IOT Based Monitoring of Fruit Freshness Using Arduino NanoIOT Based Monitoring of Fruit Freshness Using Arduino Nano
IOT Based Monitoring of Fruit Freshness Using Arduino Nano
 
FIWARE Wednesday Webinars - Architecting Your Smart Solution Using FIWARE
FIWARE Wednesday Webinars - Architecting Your Smart Solution Using FIWAREFIWARE Wednesday Webinars - Architecting Your Smart Solution Using FIWARE
FIWARE Wednesday Webinars - Architecting Your Smart Solution Using FIWARE
 
IRJET- Blockchain based Fake Product Identification in Supply Chain
IRJET- Blockchain based Fake Product Identification in Supply ChainIRJET- Blockchain based Fake Product Identification in Supply Chain
IRJET- Blockchain based Fake Product Identification in Supply Chain
 

More from Marco Garoffolo

Ricerca economia collaborativa e cooperazione
Ricerca economia collaborativa e cooperazioneRicerca economia collaborativa e cooperazione
Ricerca economia collaborativa e cooperazioneMarco Garoffolo
 
PROGETTAZIONE ED IMPLEMENTAZIONE DI STRUMENTI PER LA VALUTAZIONE DI RETI COMP...
PROGETTAZIONE ED IMPLEMENTAZIONE DI STRUMENTI PER LA VALUTAZIONE DI RETI COMP...PROGETTAZIONE ED IMPLEMENTAZIONE DI STRUMENTI PER LA VALUTAZIONE DI RETI COMP...
PROGETTAZIONE ED IMPLEMENTAZIONE DI STRUMENTI PER LA VALUTAZIONE DI RETI COMP...Marco Garoffolo
 
Agriculture, forestry and fishery statistics
Agriculture, forestry and fishery statisticsAgriculture, forestry and fishery statistics
Agriculture, forestry and fishery statisticsMarco Garoffolo
 
Schoenberg Arnold manuale di armonia
Schoenberg Arnold manuale di armoniaSchoenberg Arnold manuale di armonia
Schoenberg Arnold manuale di armoniaMarco Garoffolo
 
Valorizzazione cereali minori di montagna in provincia di brescia
Valorizzazione cereali minori di montagna in provincia di bresciaValorizzazione cereali minori di montagna in provincia di brescia
Valorizzazione cereali minori di montagna in provincia di bresciaMarco Garoffolo
 
Disposizioni per la tutela e la valorizzazione della biodiversità agraria e a...
Disposizioni per la tutela e la valorizzazione della biodiversità agraria e a...Disposizioni per la tutela e la valorizzazione della biodiversità agraria e a...
Disposizioni per la tutela e la valorizzazione della biodiversità agraria e a...Marco Garoffolo
 
L’industria dei brevetti sta prendendo il controllo sul nostro cibo?
L’industria dei brevetti sta prendendo il controllo sul nostro cibo?L’industria dei brevetti sta prendendo il controllo sul nostro cibo?
L’industria dei brevetti sta prendendo il controllo sul nostro cibo?Marco Garoffolo
 
Delibera Food Policy Milano
Delibera Food Policy MilanoDelibera Food Policy Milano
Delibera Food Policy MilanoMarco Garoffolo
 
I padroni del nostro cibo
I padroni del nostro ciboI padroni del nostro cibo
I padroni del nostro ciboMarco Garoffolo
 
Exploring the production capacity of rooftop gardens (RTGs) in urban agricult...
Exploring the production capacity of rooftop gardens (RTGs) in urban agricult...Exploring the production capacity of rooftop gardens (RTGs) in urban agricult...
Exploring the production capacity of rooftop gardens (RTGs) in urban agricult...Marco Garoffolo
 
The theory of Peasant co-operatives
The theory of Peasant co-operativesThe theory of Peasant co-operatives
The theory of Peasant co-operativesMarco Garoffolo
 
Alternative trade or market fragmentation
Alternative trade or market fragmentationAlternative trade or market fragmentation
Alternative trade or market fragmentationMarco Garoffolo
 
Consumatori e sviluppo sostenibile
Consumatori e sviluppo sostenibileConsumatori e sviluppo sostenibile
Consumatori e sviluppo sostenibileMarco Garoffolo
 
Radical marketing approach to food network
Radical marketing approach to food networkRadical marketing approach to food network
Radical marketing approach to food networkMarco Garoffolo
 
Le piante come indicatori ambientali manuale tecnico scientifico
Le piante come indicatori ambientali manuale tecnico scientificoLe piante come indicatori ambientali manuale tecnico scientifico
Le piante come indicatori ambientali manuale tecnico scientificoMarco Garoffolo
 
Etichettatura degli alimenti
Etichettatura degli alimentiEtichettatura degli alimenti
Etichettatura degli alimentiMarco Garoffolo
 

More from Marco Garoffolo (20)

Costruendo ruralopoli
Costruendo ruralopoli Costruendo ruralopoli
Costruendo ruralopoli
 
Ricerca economia collaborativa e cooperazione
Ricerca economia collaborativa e cooperazioneRicerca economia collaborativa e cooperazione
Ricerca economia collaborativa e cooperazione
 
PROGETTAZIONE ED IMPLEMENTAZIONE DI STRUMENTI PER LA VALUTAZIONE DI RETI COMP...
PROGETTAZIONE ED IMPLEMENTAZIONE DI STRUMENTI PER LA VALUTAZIONE DI RETI COMP...PROGETTAZIONE ED IMPLEMENTAZIONE DI STRUMENTI PER LA VALUTAZIONE DI RETI COMP...
PROGETTAZIONE ED IMPLEMENTAZIONE DI STRUMENTI PER LA VALUTAZIONE DI RETI COMP...
 
Agriculture, forestry and fishery statistics
Agriculture, forestry and fishery statisticsAgriculture, forestry and fishery statistics
Agriculture, forestry and fishery statistics
 
Schoenberg Arnold manuale di armonia
Schoenberg Arnold manuale di armoniaSchoenberg Arnold manuale di armonia
Schoenberg Arnold manuale di armonia
 
Valorizzazione cereali minori di montagna in provincia di brescia
Valorizzazione cereali minori di montagna in provincia di bresciaValorizzazione cereali minori di montagna in provincia di brescia
Valorizzazione cereali minori di montagna in provincia di brescia
 
Disposizioni per la tutela e la valorizzazione della biodiversità agraria e a...
Disposizioni per la tutela e la valorizzazione della biodiversità agraria e a...Disposizioni per la tutela e la valorizzazione della biodiversità agraria e a...
Disposizioni per la tutela e la valorizzazione della biodiversità agraria e a...
 
L’industria dei brevetti sta prendendo il controllo sul nostro cibo?
L’industria dei brevetti sta prendendo il controllo sul nostro cibo?L’industria dei brevetti sta prendendo il controllo sul nostro cibo?
L’industria dei brevetti sta prendendo il controllo sul nostro cibo?
 
Delibera Food Policy Milano
Delibera Food Policy MilanoDelibera Food Policy Milano
Delibera Food Policy Milano
 
I padroni del nostro cibo
I padroni del nostro ciboI padroni del nostro cibo
I padroni del nostro cibo
 
Rapporto Coop 2015
Rapporto Coop 2015Rapporto Coop 2015
Rapporto Coop 2015
 
Exploring the production capacity of rooftop gardens (RTGs) in urban agricult...
Exploring the production capacity of rooftop gardens (RTGs) in urban agricult...Exploring the production capacity of rooftop gardens (RTGs) in urban agricult...
Exploring the production capacity of rooftop gardens (RTGs) in urban agricult...
 
The theory of Peasant co-operatives
The theory of Peasant co-operativesThe theory of Peasant co-operatives
The theory of Peasant co-operatives
 
Alternative trade or market fragmentation
Alternative trade or market fragmentationAlternative trade or market fragmentation
Alternative trade or market fragmentation
 
Consumatori e sviluppo sostenibile
Consumatori e sviluppo sostenibileConsumatori e sviluppo sostenibile
Consumatori e sviluppo sostenibile
 
Radical marketing approach to food network
Radical marketing approach to food networkRadical marketing approach to food network
Radical marketing approach to food network
 
Eco farming
Eco farmingEco farming
Eco farming
 
Eco farming
Eco farmingEco farming
Eco farming
 
Le piante come indicatori ambientali manuale tecnico scientifico
Le piante come indicatori ambientali manuale tecnico scientificoLe piante come indicatori ambientali manuale tecnico scientifico
Le piante come indicatori ambientali manuale tecnico scientifico
 
Etichettatura degli alimenti
Etichettatura degli alimentiEtichettatura degli alimenti
Etichettatura degli alimenti
 

Recently uploaded

Estimation of protein quality using various methods
Estimation of protein quality using various methodsEstimation of protein quality using various methods
Estimation of protein quality using various methodsThiviKutty
 
Irradiation preservation of food advancements
Irradiation preservation of food advancementsIrradiation preservation of food advancements
Irradiation preservation of food advancementsDeepika Sugumar
 
Prepare And Cook Meat.pptx Quarter II Module
Prepare And Cook Meat.pptx Quarter II ModulePrepare And Cook Meat.pptx Quarter II Module
Prepare And Cook Meat.pptx Quarter II Modulemaricel769799
 
FONDANT ICING bread and pastry prod.pptx
FONDANT ICING bread and pastry prod.pptxFONDANT ICING bread and pastry prod.pptx
FONDANT ICING bread and pastry prod.pptxReleneJoySoto
 
ACCEPTABILITY-OF-AMPALAYA-BITTER-GOURD.pptx
ACCEPTABILITY-OF-AMPALAYA-BITTER-GOURD.pptxACCEPTABILITY-OF-AMPALAYA-BITTER-GOURD.pptx
ACCEPTABILITY-OF-AMPALAYA-BITTER-GOURD.pptxBELARMINOJOLINA
 
如何办韩国SKKU文凭,成均馆大学毕业证学位证怎么辨别?
如何办韩国SKKU文凭,成均馆大学毕业证学位证怎么辨别?如何办韩国SKKU文凭,成均馆大学毕业证学位证怎么辨别?
如何办韩国SKKU文凭,成均馆大学毕业证学位证怎么辨别?t6tjlrih
 
Call Girls Laxmi Nagar Delhi reach out to us at ☎ 9711199012
Call Girls Laxmi Nagar Delhi reach out to us at ☎ 9711199012Call Girls Laxmi Nagar Delhi reach out to us at ☎ 9711199012
Call Girls Laxmi Nagar Delhi reach out to us at ☎ 9711199012rehmti665
 
Affordable PriceD Call Girls In Crowne Plaza Greater Noida 8377877756 Short 2...
Affordable PriceD Call Girls In Crowne Plaza Greater Noida 8377877756 Short 2...Affordable PriceD Call Girls In Crowne Plaza Greater Noida 8377877756 Short 2...
Affordable PriceD Call Girls In Crowne Plaza Greater Noida 8377877756 Short 2...dollysharma2066
 
thanksgiving dinner and more information
thanksgiving dinner and more informationthanksgiving dinner and more information
thanksgiving dinner and more informationlialiaskou00
 
韩国学位证,全北大学毕业证书1:1制作
韩国学位证,全北大学毕业证书1:1制作韩国学位证,全北大学毕业证书1:1制作
韩国学位证,全北大学毕业证书1:1制作7tz4rjpd
 
Russian Escorts DELHI - Russian Call Girls in Delhi Greater Kailash TELL-NO. ...
Russian Escorts DELHI - Russian Call Girls in Delhi Greater Kailash TELL-NO. ...Russian Escorts DELHI - Russian Call Girls in Delhi Greater Kailash TELL-NO. ...
Russian Escorts DELHI - Russian Call Girls in Delhi Greater Kailash TELL-NO. ...dollysharma2066
 
Gwal Pahari Call Girls 9873940964 Book Hot And Sexy Girls
Gwal Pahari Call Girls 9873940964 Book Hot And Sexy GirlsGwal Pahari Call Girls 9873940964 Book Hot And Sexy Girls
Gwal Pahari Call Girls 9873940964 Book Hot And Sexy Girlshram8477
 
pitch presentation B2.pptx Sunderland Culture
pitch presentation B2.pptx Sunderland Culturepitch presentation B2.pptx Sunderland Culture
pitch presentation B2.pptx Sunderland CultureChloeMeadows1
 
How Ang Chong Yi Singapore is serving up sustainable future-ready foods?
How Ang Chong Yi Singapore is serving up sustainable future-ready foods?How Ang Chong Yi Singapore is serving up sustainable future-ready foods?
How Ang Chong Yi Singapore is serving up sustainable future-ready foods?Ang Chong Yi Singapore
 
526350093-Online-Food-Ordering-System-Ppt.pptx
526350093-Online-Food-Ordering-System-Ppt.pptx526350093-Online-Food-Ordering-System-Ppt.pptx
526350093-Online-Food-Ordering-System-Ppt.pptxJaidBagwan2
 
Food-Allergy-PowerPoint-Presentation-2.ppt
Food-Allergy-PowerPoint-Presentation-2.pptFood-Allergy-PowerPoint-Presentation-2.ppt
Food-Allergy-PowerPoint-Presentation-2.pptIsaacMensah62
 
(办理学位证)加州大学圣塔芭芭拉分校毕业证成绩单原版一比一
(办理学位证)加州大学圣塔芭芭拉分校毕业证成绩单原版一比一(办理学位证)加州大学圣塔芭芭拉分校毕业证成绩单原版一比一
(办理学位证)加州大学圣塔芭芭拉分校毕业证成绩单原版一比一Fi sss
 

Recently uploaded (20)

Estimation of protein quality using various methods
Estimation of protein quality using various methodsEstimation of protein quality using various methods
Estimation of protein quality using various methods
 
Irradiation preservation of food advancements
Irradiation preservation of food advancementsIrradiation preservation of food advancements
Irradiation preservation of food advancements
 
Prepare And Cook Meat.pptx Quarter II Module
Prepare And Cook Meat.pptx Quarter II ModulePrepare And Cook Meat.pptx Quarter II Module
Prepare And Cook Meat.pptx Quarter II Module
 
FONDANT ICING bread and pastry prod.pptx
FONDANT ICING bread and pastry prod.pptxFONDANT ICING bread and pastry prod.pptx
FONDANT ICING bread and pastry prod.pptx
 
ACCEPTABILITY-OF-AMPALAYA-BITTER-GOURD.pptx
ACCEPTABILITY-OF-AMPALAYA-BITTER-GOURD.pptxACCEPTABILITY-OF-AMPALAYA-BITTER-GOURD.pptx
ACCEPTABILITY-OF-AMPALAYA-BITTER-GOURD.pptx
 
如何办韩国SKKU文凭,成均馆大学毕业证学位证怎么辨别?
如何办韩国SKKU文凭,成均馆大学毕业证学位证怎么辨别?如何办韩国SKKU文凭,成均馆大学毕业证学位证怎么辨别?
如何办韩国SKKU文凭,成均馆大学毕业证学位证怎么辨别?
 
Call Girls Laxmi Nagar Delhi reach out to us at ☎ 9711199012
Call Girls Laxmi Nagar Delhi reach out to us at ☎ 9711199012Call Girls Laxmi Nagar Delhi reach out to us at ☎ 9711199012
Call Girls Laxmi Nagar Delhi reach out to us at ☎ 9711199012
 
Affordable PriceD Call Girls In Crowne Plaza Greater Noida 8377877756 Short 2...
Affordable PriceD Call Girls In Crowne Plaza Greater Noida 8377877756 Short 2...Affordable PriceD Call Girls In Crowne Plaza Greater Noida 8377877756 Short 2...
Affordable PriceD Call Girls In Crowne Plaza Greater Noida 8377877756 Short 2...
 
thanksgiving dinner and more information
thanksgiving dinner and more informationthanksgiving dinner and more information
thanksgiving dinner and more information
 
9953330565 Low Rate Call Girls In Sameypur-Bodli Delhi NCR
9953330565 Low Rate Call Girls In Sameypur-Bodli Delhi NCR9953330565 Low Rate Call Girls In Sameypur-Bodli Delhi NCR
9953330565 Low Rate Call Girls In Sameypur-Bodli Delhi NCR
 
Cut & fry Potato is Not FRENCH FRIES ..
Cut & fry Potato is Not FRENCH FRIES  ..Cut & fry Potato is Not FRENCH FRIES  ..
Cut & fry Potato is Not FRENCH FRIES ..
 
韩国学位证,全北大学毕业证书1:1制作
韩国学位证,全北大学毕业证书1:1制作韩国学位证,全北大学毕业证书1:1制作
韩国学位证,全北大学毕业证书1:1制作
 
Call Girls in Hauz Khas⎝⎝9953056974⎝⎝ Delhi NCR
Call Girls in Hauz Khas⎝⎝9953056974⎝⎝ Delhi NCRCall Girls in Hauz Khas⎝⎝9953056974⎝⎝ Delhi NCR
Call Girls in Hauz Khas⎝⎝9953056974⎝⎝ Delhi NCR
 
Russian Escorts DELHI - Russian Call Girls in Delhi Greater Kailash TELL-NO. ...
Russian Escorts DELHI - Russian Call Girls in Delhi Greater Kailash TELL-NO. ...Russian Escorts DELHI - Russian Call Girls in Delhi Greater Kailash TELL-NO. ...
Russian Escorts DELHI - Russian Call Girls in Delhi Greater Kailash TELL-NO. ...
 
Gwal Pahari Call Girls 9873940964 Book Hot And Sexy Girls
Gwal Pahari Call Girls 9873940964 Book Hot And Sexy GirlsGwal Pahari Call Girls 9873940964 Book Hot And Sexy Girls
Gwal Pahari Call Girls 9873940964 Book Hot And Sexy Girls
 
pitch presentation B2.pptx Sunderland Culture
pitch presentation B2.pptx Sunderland Culturepitch presentation B2.pptx Sunderland Culture
pitch presentation B2.pptx Sunderland Culture
 
How Ang Chong Yi Singapore is serving up sustainable future-ready foods?
How Ang Chong Yi Singapore is serving up sustainable future-ready foods?How Ang Chong Yi Singapore is serving up sustainable future-ready foods?
How Ang Chong Yi Singapore is serving up sustainable future-ready foods?
 
526350093-Online-Food-Ordering-System-Ppt.pptx
526350093-Online-Food-Ordering-System-Ppt.pptx526350093-Online-Food-Ordering-System-Ppt.pptx
526350093-Online-Food-Ordering-System-Ppt.pptx
 
Food-Allergy-PowerPoint-Presentation-2.ppt
Food-Allergy-PowerPoint-Presentation-2.pptFood-Allergy-PowerPoint-Presentation-2.ppt
Food-Allergy-PowerPoint-Presentation-2.ppt
 
(办理学位证)加州大学圣塔芭芭拉分校毕业证成绩单原版一比一
(办理学位证)加州大学圣塔芭芭拉分校毕业证成绩单原版一比一(办理学位证)加州大学圣塔芭芭拉分校毕业证成绩单原版一比一
(办理学位证)加州大学圣塔芭芭拉分校毕业证成绩单原版一比一
 

A RFID web-based infotracing system for the artisanal Italian cheese quality traceability

  • 1. A RFID web-based infotracing system for the artisanal Italian cheese quality traceability Patrizia Papetti a , Corrado Costa b,*, Francesca Antonucci b , Simone Figorilli b , Silvia Solaini b , Paolo Menesatti b a Department of Economics, University of Cassino, Via Marconi 10, 03043 Cassino (FR), Italy b CRA-ING (Agricultural Engineering Research Unit of the Agriculture Research Council), Via della Pascolare 16, 00015 Monterotondo Scalo, Rome, Italy a r t i c l e i n f o Article history: Received 7 February 2012 Received in revised form 16 March 2012 Accepted 24 March 2012 Keywords: RFID Spectrophotometry Tracing web-based architecture PLS Chemical analyses Buffalo milk cheese a b s t r a c t The aim of this study is the integration of an electronic tracing system with a non-destructive quality analysis system for single product of a typical Italian cheese, prepared with buffalo milk and called “Caciottina massaggiata di Amaseno”, a typical diary product of Lazio Region. The tracing and quality information are combined on a web platform to obtain a complete procedure to develop what we define as an “infotracing system”. Quality analyses (chemical, sensorial and spectrophotometric) were carried out on a total of 23 cheese wheels (8 with TAGs) and for three cheese maturation classes (3, 6 or 9 months after production). Two typologies of RFID tags were tested. Results were screened by Partial Least Squares regressions (PLS) on reflectance values for the prediction of chemical content, while classifica- tion of cheese maturation classes (3, 6 or 9 months) was carried out by Partial Least Squares Discriminant Analysis (PLSDA) on reflectance values. The RFID system turned out as effective, reliable and compatible with the production process tool. A good estimation of maturation degree by spectral and chemical analysis was obtained. Moreover an infotracing web-based system was designed to acquire and link basic information that can be made available to the final consumer or to different food chain actors before or after purchasing, using the RFID code to identify the single and specific cheese product. The projected web-based tracing system could improve the products commerce by increasing the information trans- parency for the consumer. Ó 2012 Elsevier Ltd. All rights reserved. 1. Introduction Quality can be defined as the possession by a product of the conditions that make it suitable to meet the expressed or potential needs of its users (Giusti, Bignetti, & Cannella, 2008). In this definition both the consumers and the producers needs are considered: the first is interested in health, safety, organoleptic characteristic and utiliza- tion modalities, the second in parameters more related to the market. Consumers and other stakeholders are increasingly concerned about the continuing sequence of food frauds and transparency is strongly requested in this sector: tracking and tracing systems are considered as efficient tools for early warning in case of a possible emerging problem (Beulens, Broens, Folstar, & Hofstede, 2005). Another important field of application for tracking and tracing systems is the niche products market for the valorisation of food with particular quality characteristics and a strong local identity (Ilbery & Kneafsey, 1999). Regulation (EC) No. 178/2002 of the European Parliament and of the Council of 28th January 2002 sets the general principles and requirements of food law and it defines traceability as “the ability to trace and follow a food, feed, food-producing animal or substance intended to be, or expected to be incorporated into a food or feed, through all stages of production, processing and distribution” (European Commission, 2002). The focus on traceability today is based on innovation, in order to allow the maximum of information flow management. Xiong et al. (2007) developed a practical application platform consisting of a bar-code based data identification system for pork products, a data-record keeping system, correlated databases, and a data query interfaceinorder to monitortheproduct qualityfrom the farm to the final consumer. An evolution of bar-codes systems is represented by innovative devices, such as advanced data handling systems based on RFID (radio frequency identification) and WSN (wireless sensor networks) (Ruiz-Garcia, Steinberger, & Rothmund, 2010) These systems can be used on food also during its processing without interfering or being damaged by the transformation opera- tions, as in the case of presence of liquids or conservation solutions. Moreover theycan store a high amount of information andin a remote way. InparticularRFID is an emerging technology increasingly utilized * Corresponding author. Tel.: þ39 0690675214; fax: þ39 0690625591. E-mail address: corrado.costa@entecra.it (C. Costa). Contents lists available at SciVerse ScienceDirect Food Control journal homepage: www.elsevier.com/locate/foodcont 0956-7135/$ e see front matter Ó 2012 Elsevier Ltd. All rights reserved. doi:10.1016/j.foodcont.2012.03.025 Food Control 27 (2012) 234e241
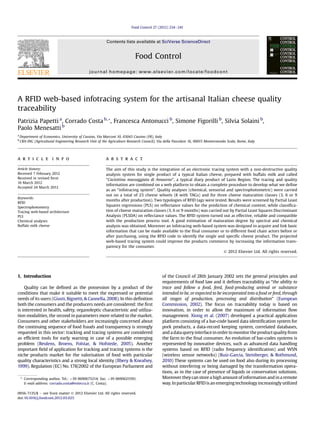
  • 2. in food logistics and in the supply chain management processes (Jedermann, Ruiz-Garcia, & Lang, 2009). This system uses radio waves to receive and transmit data stored into tags, consisting in a silicon chip with an antenna where information are stored under a unique serial number. The exchange of information between reader and e antenna e tag is codified and transmitted to a database (Brofman-Epelbaum & Kluwe Aguiar, 2007). RFID technology is not only based on the presence of tags and readers but it requires other software and hardware specifications in order to manage the infor- mation load through space and time (Costa et al., 2011; Sarriá et al., 2009). Products information can be associated to each step of the food chain (producers, raw material, food processors, transporters, retailers) and conveyed to Internet on a web platform in order to become available to the following different end users: to multiple- or to the single-final buyer or to the different actors of the food chain (Lammers & Hasselmann, 2007). The information on product quality, available for the different stakeholders, can derive from traditional, chemical and destructive systems. In these cases it is not possible to monitor each single product in the whole batch of goods, but only some samples that will be destroyed for the analysis. Another possible application is based on spectrophotometric analytical systems, based on non-destructive, opto-electronic technologies (Menesatti et al., 2010; Woodcock, Fagan, O’Donnell, & Downey, 2008). These tech- nologies are characterized by a high analytical capacity, a high speed information acquisition, a total non-destructivity of measurements and, in particular conditions, the possibility of operating on a single products, also on the processing line (Downey et al., 2005; Lee, Jeon, & Harbers, 1997; Martín-del-Campo, Picque, Cosío-Ramírez, & Corrieu, 2007a,b; Rodriguez-Saona, Koca, Harper, & Alvarez, 2006). The infor- mation on quality parameters can be associated with the electronic traceability, as in the case of experiments carried out on Parmesan cheese (Kahn, 2005; Regattieri, Gamberi, & Mancini, 2007; Zanasi, Nasuelli, Buccolini, & Pulga, 2008). The aim of the present work was the experimental testing of a system which integrates an electronic tracing system with a non- destructive quality analysis system for each single unit of cheese product. This system records the two typologies of information on a web platform. This was carried out in order to obtain a complete procedure of quality tracing and information and to develop an “infotracing system”. For the present research activity, an info- tracing system was developed on a dairy niche product called “Caciottina massaggiata di Amaseno”, a typical Italian cheese produced in Lazio Region and prepared with buffalo milk. 2. Materials and methods 2.1. Cheese samples Cheese wheels of “Caciottina massaggiata di Amaseno” were produced in the cheese factory “San Lorenzo in Valle” located in Amaseno (LT, Italy). The product, according to the production protocol, was periodically subjected to manipulations by hand with a mixture of olive oil and wine and to overturning until the end of seasoning, which has a minimum duration of 60 days. 2.2. Identification devices Two different RFID tags were used for the present experimen- tation: TAG cheese HF2009 and TAG cheese arrow screw (Fig. 1). Four Tags of each type were inserted in four cheese samples, for a total of eight tested wheels. Tag were inserted at the time of production (T0) and the tags’ reading was performed at time 0 and 3, 6, 9 months (maturation times: T3, T6 and T9) after T0. The tags’ reader was CPR.MR50-USB Multi ISO (ISO14443-A/B, ISO15693 & NFC). A specific reading and database software was realized using the open source Python Programming Language. The range of the antenna was 10 cm. 2.3. Quality analyses Chemical and spectrophotometric analyses were carried out on a total of 23 cheese wheels (8 with RFID tags), according to the following scheme: i. chemical analyses were carried out at T0 on 3 cheese wheels without RFID tags; ii. chemical and spectrophoto- metric analyses were carried out at T3 and T6 on 3 cheese wheels without RFID tags; iii. chemical and spectrophotometric analyses were carried out at T9 on 8 cheese wheels with RFID tags. On each cheese wheel 6 slices were cut along the length: two samples (internal part) were obtained from the central slice, two samples (median part) were obtained cutting 2 slices at 2 cm from the central one, the last two samples (external part) were obtained from the remaining part. These sampling methods were chosen in order to obtain analytical parameters of reference to be used for the evaluation of cheese with unusual fermentations or defects, which frequently occur in limited areas within the whole cheese wheel. 2.3.1. Chemical analyses The following chemical analyses were performed: dry matter by drying in oven at 102 C (International standard FIL-IDF 4/A: 1982); fat (3433:1975 e Determination of fat content e Van Gulik method); pH by potentiometric measurement by direct insertion of the electrode in the cheese wheel; sodium chloride by titration with AgNO3 (International Standard FIL-IDF 88/A: 1988). 2.3.2. Spectrophotometric analyses For the VISeNIR measurements, a (portable) single channel spectrophotometer was used. The system is composed of five parts: (1) a Hamamatsu S 3904 256Q spectrograph in a special housing; a customized illumination system realized by a 20 W halogen lamp Fig. 1. RFID tag typologies used in the experimentation: TAG cheese HF2009 and TAG cheese arrow screw. P. Papetti et al. / Food Control 27 (2012) 234e241 235
  • 3. and an optical fibre bundle consisting of approx. 30 quartz glass; (2) an optical entrance with input round: 70 mm  2500 mm and diameter 0.5 mm NA ¼ 0.22 mounted in SubMiniature version A- coupling; (3) specific probes with quartz optical fibre of connec- tion; (4) a transmission device for transmitted or absorbed light for thin solids or liquid with variable optical length; (5) a notebook equipped with specific software to acquire, calibrate and elaborate spectral data. The Hamamatsu spectrograph has the following characteristics: grating: flat-field, 366 line/mm (centre); spectral range: 310e1100 nm; wavelength accuracy absolute: 0.3 nm; temperaturedinduced drift: 0.02 nm/K; resolution (Rayleigh- criterion): DlRayleigh 10 nm; sensitivity: 1013 Counts/Ws (with 14-Bit-conversion); straylight: 0.8% with halogen lamp and 16 bit A/D converter. For spectral acquisition, the ‘pen’ probe was used to measure the spectral reflectance response on each sample for three repetitions (spot area z 10 mm2 ). To avoid high signal noise typical of the tails of the spectral range, only values between 400 and 800 nm were considered. 2.4. Statistical analysis A two-way analysis of variance (Two-Way ANOVA) was used to assess the statistically significant differences among the chemical variables (pH, moisture, chlorides and fat content) for different maturation times and for the three different cheese portions. A multi-comparison between factors’ means was performed by a Least Significant Difference (LSD) test. Predictions of chemical content were performed by Partial Least Squares regressions (PLS) on reflectance values. Classification of the cheese maturation times was carried out by Partial Least Squares Discriminant Analysis (PLSDA) on reflectance values. These two multivariate supervised methods are based on Partial Least Squares (PLS) (Wold, Sjostrom, Erikssonn, 2001) and are widely used to find the correlations between the output signals of a multi-channel device and the information enclosed in a certain number of measures. The model operates through a specific algo- rithm (SIMPLS; De Jong, 1993) for two types of analysis: i) quanti- tative predictions (PLS, see Menesatti et al., 2010 for more details) and ii) classifications or modelling (PLSDA, see Menesatti et al., 2008 for more details). The degree of estimation accuracy in quantitative prediction must be inferred by the direct comparison between the measured and the estimated response variable, by calculating different parameters of the prediction efficiency: coefficient of correlation (r) between measured and predicted values, RMSE (Root Mean Square Error); SEP (standard error of prediction). The PLSDA analysis provides the percentage of correct classifi- cation of each class. This analysis expresses also the statistical parameters indicating the modelling efficiency indicated by sensi- tivity and specificity parameters. The sensitivity is the percentage of the species of a category accepted by the class model. The specificity is the percentage of the species of the categories different from the modelled one, rejected by the class model (Costa et al., 2008). In order to grant a higher strength and ability of generalization to the modelling analysis, the strategy used of both PLS and PLSDA multivariate analysis was as follows: 1. Repartition of the entire dataset (DS) into two parts: a dataset for the training or model (DM), including the 75% of DS; b dataset for the validation or test (DT) including the remaining 25% of the entire DS. 2. The repartition was carried out by: c partitioning algorithm that takes into account the vari- ability in both X- and Y-spaces called sample set partition- ing based on joint x-y distances (SPXY; Harrop Galvao et al., 2005) for PLS; d extraction function based on distances and on KennardeStone algorithm for PLSDA (Kennard Stone, 1969). The y- and x-block variables were pre-processed with different algorithms in order to limit or to enhance the scale effects, drifts and noises. In Table 1, the list of utilized algorithms is indicated. The DM was used for the development of different models derived from the factorial combination of: increasing number of Latent Variables (LV, from 1 to 20), different types of pre- processing for X-block (14) and different types of pre-processing for Y-block (4) e only for PLS models. About 30,000 models and tests were classified in terms of their ability of transferability and robustness (Brown, 2009), using a combined parameter (RPD) that provides a standardization of the SEP or of the RMSE. The RPD is the ratio between the standard deviation of the measured laboratory (reference) data (Ystd) and the SEP (Williams, 2001) or between the Ystd and the RMSE (Viscarra-Rossel, Taylor, McBratney, 2007). The RPD was calcu- lated on both the training and the validation set. The optimum models were selected using the RPD based on RMSE. For the RPD performance evaluation, the classification proposed by Viscarra- Rossel et al. (2007) is the following: RPD 1.0 indicates a very poor model; 1.0 to 1.4 indicates a poor model; 1.4 to 1.8 indicates a fair model; 1.8 to 2.0 indicates a good model; 2.0 to 2.5 is very good and 2.5 is excellent. The modelling iteration was developed through an appropriate software routine, realized in Matlab 7.1 and PLS toolbox 4.0 environment. 2.5. Infotracing web-based system The aim of the web-based tracing system refers to the improvement of the products logistic management by increasing its quality and information transparency for the consumer. This objective was carried out by collecting a set of scientific and Table 1 List of pre-processing algorithms applied on PLS and PLSDA dataset. Label Description Abs Takes the absolute value of the data Autoscale Centres columns to zero mean and scales to unit variance Baseline Baseline (weighted least squares) Centring Multiway centre Detrend Remove a linear trend Diff1 Differences between adjacent variables (approximate derivatives) GLS weighting Generalized least squares weighting Groupscale Group/block scaling Log 1/R Transformation of reflectance in absorbance following log (1/R) formula Log 10 Log 10 Logdecay Log decay scaling Mean centre Centre columns to have zero mean Median centre Centre columns to have zero median Msc (mean) Multiplicative scatter correction with offset, the mean is the reference spectrum None No pre-processing Normalize Normalization of the rows Osc Orthogonal signal correction Scaling Multiway scale Sg SavitskyeGolay smoothing and derivatives Snv Standard normal variate Sqmnsc Scale each variable by the square root of its mean P. Papetti et al. / Food Control 27 (2012) 234e241236
  • 4. productive information which follow the product shelf-life from producer to consumer, providing web-based tools for each cate- gory. The categories involved in this system are divided into manufacturers, wholesalers, resellers, retailers and consumers who contribute separately, according to their level of member- ship, to provide a set of data related to each product. All the collected data will enter into a centralized database. Computer companies, specialized in CED (Center Data Elaboration), will manage this database by providing web hosting and backup services. This management structure guarantees the uniqueness and the centrality of the acquired data maintaining a controlled access for each system part in order to ensure their integrity. In this work we will consider only those companies able to respect the standards provided in ISO/IEC 27001:2005 (ISO/IEC 27001, 2005). The proposed system is divided in 4 phases (Fig. 2): 1) Manufacturer The product is identified by RFID technology (personal computer and RFID tags) and its quality information, chemical and spectrophotometric analyses developed are stored into the centralized database through a web application. Moreover infor- mation on milk, producer and animals (farming type, animal feeding), cheese producer, manipulation and processing treat- ments, hygienic and sanitary controls performed during time, micro-climatic characteristics of conservation and maturation of the product will be stored. 2) Wholesalers, resellers and retailers The categories involved in this phase can monitor the supply chain of each product through the centralized database and improve their tracing by adding quality information into the system through a web application. 3) Consumers The consumers can control the supply chain of each product using the RFID readers provided by the resellers and/or retailers and by the web (browser personal computer) and smartphone applications (APP) inserting the RFID tag code. Also the consumers can improve the product tracing by adding feedback information on the quality of the product into the system through a web services as blog and forum. 4) Research institutions and statistics Through the centralized database all the research institutions can use the quality information collected by the categories, to statistics and marketing scopes. The implemented web software is structured to provide various services to all the categories thanks to the API (Applica- tion Programming Interface). This allows to the manufacturer, wholesalers, resellers etc., the possibility to implement the acquisition and/or writing system following their needs and available technologies and ensuring uniformity of data to consult or send. This Infotracing system can provide also a reference web inter- face to access to the product info card displaying all information and data released as feedback by the manufacturer, wholesaler, reseller, retailer and consumer. 2.5.1. Software architecture The selected software architecture is the Three-Tier (software module implementing one or more conceptual layers) that allows to create a client/server architecture to integrate different systems (within a LAN, Over Internet) in which the clients are independent from each others (Ramakrishnan Gehrke, 1999). It is possible to obtain different levels of presentation client specific. All the application logic relies within intermediate state and ensures to the Fig. 2. Infotracing web-based system: flowchart of the architecture of the different phases. P. Papetti et al. / Food Control 27 (2012) 234e241 237
  • 5. system more portable, handy at maintenance, handy at updating the two tiers, more flexibility and greater scalability. The Internet-client is the applicative layer that refers to clients over Internet (personal computer, workstations and smartphones). The presentation-layer, composed by the web server, manages the communication with the independent external clients. The application-layer processes data and produces the results to forward tothepresentation-layer. The resource-layeristhe layerthat manages the data required for the system functioning. Into the Internet-client- layer there are the different categories which access to the system by web. The presentation-, application- and resource-layers are imple- mented into the CED structure and provide management services for the various categories through the web server. The language implemented for the configuration application of the local central system was Python while Java language was implemented to allow the simplification of the application writings of network, permitting a system interoperability and implementing an applicative logic for the different technologies and not for the different devices. For example, for the mobile technology only a software independent of the mobile device (iPhone, Andorid, Windows Mobile, Symbian) has been configured. In terms of deployment a database management system (DBMS) relational was chosen supporting stored procedures and triggers (ability to handle part of the application logic of the server). 3. Results The production information concerning cheese samples equip- ped with RFID tags and used in the present research activity were inserted in the infotracing web-based system to be used as production reference for RFID tracing and indirect quality charac- terizations of the final product. All the RFID tags performed a correct reading at all monitored production stages. Despite the continuous handling due to the cheese manipulation at T9 no tags moved away: they were all perfectly in service and inserted in the cheese wheels. Only the samples with “Cheese arrow screw” tags showed at T3 some ruptures in the rind that became more and more evident during the maturation, leading to the formation of moulds after 9 months. On the other hand, tags HF2009 remained in service and well visible also at T9, without showing particular problems for cheese sale and consumption. In Table 2 the mean value for the chemical parameters (pH, moisture, chlorides and fat content), of the internal, median and external cheese wheel parts, during the 9 months of the experi- ment were reported together with the two-way ANOVA results. For the maturation time results, all the parameters (pH, mois- ture, chlorides content and fat content) presented statistically significant differences between all the maturation classes (p 0.05). Table 2 Mean values and statistical analysis (ANOVA and LSD multi-comparison between factors) of the chemical parameters measured for different maturation months and position on cheese wheels. For the significance, different letters indicate significant differences for P 0.05. 2-Way ANOVA results Month Significance Position External Median Internal Mean Source d. f. Mean sq. Prob F a a a pH Month 3 0.62338 0.031923 0 a 5.22 5.12 5.12 5.15 Position 2 0.011852 0.94126 3 b 5.59 5.58 5.58 5.59 Month position 6 0.013005 0.99874 6 ab 5.42 5.35 5.35 5.37 Error 48 0.19554 9 a 5.12 5.18 5.18 5.16 Total 59 2-Way ANOVA results Month Significance Position External Median Internal Mean Source d. f. Mean sq. Prob F a a a Moisture Month 3 2265.8 0 0 a 58.70 53.06 53.06 54.94 Position 2 17.007 0.25641 3 b 39.42 38.86 38.86 39.05 Month position 6 22.176 0.11386 6 c 29.79 30.42 30.42 30.21 Error 48 12.145 9 c 27.20 29.60 29.60 28.80 Total 59 2-Way ANOVA results Month Significance Position External Median Internal Mean Source d. f. Mean sq. Prob F a b b Chlorides content Month 3 0.56134 0 0 a 1.37 1.29 1.29 1.31 Position 2 0.31923 1.02E-10 3 b 2.12 1.56 1.56 1.75 Month position 6 0.11275 5.82E-09 6 c 1.64 1.56 1.56 1.59 Error 48 0.008273 9 d 1.40 1.36 1.36 1.37 Total 59 2-Way ANOVA results Month Significance Position External Median Internal Mean Source d. f. Mean sq. Prob F a b ab Fat content Month 3 75.279 0 0 a 21.09 19.23 19.23 19.85 Position 2 2.9004 0.064135 3 a 18.83 18.53 18.53 18.63 Month position 6 3.8298 0.003292 6 b 21.67 21.00 21.00 21.22 Error 48 0.99666 9 c 24.10 23.90 23.90 23.96 Total 59 P. Papetti et al. / Food Control 27 (2012) 234e241238
  • 6. The pH average values of the different portions during the ageing time reported in Table 2 didn’t show statistically significant differences, although the central part showed a lower pH compared to the external portion. In Table 2, the average moisture trend was shown for the three different cheese sections (external, median and internal), according to ageing time. During the cheese maturation, moisture decrease by evaporation led to a progressive weight decline and afterwards there was a progressive dehydration during the following matu- ration phase of 35e40%. Moisture content decreased in a statisti- cally significant way in the first maturation time, until the sixth month, while, later, moisture decrease is less relevant in percentage. An appreciable difference between the cheese centre and periphery remained: the internal portion had a higher mois- ture content than the external, of about 2 units. Concerning chlorides content, the salt diffusion into the cheese e from the external to the central portion e starts immediately after the production and continues during the maturation time. Concerning the interaction month/position, only for chlorides and fat content a statistically significant difference was reported. The chemical parameters resulted significantly independent from the samples position measurement. Table 3 reports the characteristics of the four best models selected (one for each quality parameter) basing on the highest RPD value of the test set. For all selected models, y-block was pre- processed with the Matlab ‘median center’ algorithm. The pH model was based on 15 LV and characterized by a ‘baseline’ pre- processing for x-block. The moisture model was based on 12 LV, with a ‘baseline’ pre-processing for x-block. The chlorides content model was based on 19 LV and characterized by a ‘Diff1’ first pre- processing for x-block followed by a ‘Log 10’ second pre- processing for x-block. Finally, the selected fat content model used 7 LV and a ‘sg’ pre-processing for x-block. All the models presented high values of the correlation coefficient (r) (ranging from 0.73 to 1), slightly higher in the training test compared to the validation phase. In the training set phase, the RMSE, which has the same measurement unit as the quantity being estimated, results lower for the chlorides content and the pH models, while it is higher for the moisture content model. For the fat content model, RMSE has the highest values of all the four models. Concerning the validation set, the lowest values of RMSE are those of pH and chlorides content models, while higher values result respectively for moisture and fat content models. On the basis of the Viscarra- Rossel et al. (2007) RPD classification, the 4 models showed that the pH (RPD ¼ 1.5) can be considered as a fair model, the water and chlorides content (respectively RPD ¼ 1.8 and 1.9) are good models, but the fat content model presents a RPD ¼ 1.4, showing a quite fair model performance. These results are supported also by the eval- uation of the correlation between observed and estimated values. All the parameters presented quite good coefficients of correlation in validation, being the lower value equal to 0.73 for Fat content and the highest 0.87 for Chlorides content. Several PLSDA models were generated in order to discriminate between three different cheese maturation times. Table 4 reports the characteristics of the resulting best model, based on 6 LV. The model percentage of correct classification (89.5%) and of validation test (89.5%) showed high values and also the class prediction (88.9%). The model presented also very high values of sensitivity (92.6%) and specificity (91.5%). The confusion matrix of the 25% of the individuals of the model was reported in Table 5; it is possible to observe that the efficiency of classification results very high, considering that the random percentage was 25% and that only 2 cases out of 19 (10.5%) were wrongly classified. Moreover, the error of classification was between two classes close one to the other (T3 vs T6), while the model correctly estimated classes with a wider extension of time. 4. Discussion The present work showed an integrated application of an RFID system together with qualitative analyses (chemical and spectro- photometric) and an infotracing system on a traditional Italian dairy product. Other experiences in literature reported that RFID has been successfully applied to food logistics and supply chain management processes because of its ability to identify, categorize, and manage the flow of goods (Ruiz-Garcia, Lunadei, Barreiro, Robla, 2009). Fukatsu and Nanseki (2009) proposed a farm opera- tion monitoring system using “Field Servers” and a wearable device equipped with an RFID reader and motion sensors in order to monitor crop growth, field environment, and farming operations. Regattieri et al. (2007) developed a traceability system on Parmesan cheese based on an integration of alphanumerical codes and RFID technologies with positive consequences for both manufacturers and for consumers. The reading system is portable and of easy utilization and configuration (Dolgui Proth, 2008). The use of an open source programming language (Lwoga Chilimo, 2006), as we did when using Python software, repre- sents an advantage in terms of costs, flexibility and possibility of diffusion of the technology also to promote local cheese producers (Dubeuf, Ruiz Morales, Castel Genis, 2010). As also observed by Pérez-Aloe et al. (2007) both tested RFID tags showed a perfect degree of readings, but, in our case, the cheese arrow screw one caused ruptures. Moreover, both tags were extremely robust and Table 3 Results of Partial Least Squares (PLS) multivariate analysis to predict four different independent variables (pH, moisture, chlorides and fat). In the table are reported: number of Latent Vectors (LV), correlation coefficient (r), Standard Error of Predic- tion (SEP), Root Mean Squares Error (RMSE) and Ratio of Percentage Deviation (RPD). pH Moisture Chlorides Fat Model (training set) N LV 15 12 19 7 First pre-processing X-block Baseline sg Diff1 sg Second pre-processing X-block Log 10 Pre-processing Y-block Median centre Median centre Median centre Median centre r (observed vs predicted) 0.9558 0.7879 1 0.7421 SEP 0.053 3.153 0.0004 1.94 RMSE 0.053 3.128 0.0004 1.924 RPDTrain 1.5572 1.8493 1.9552 1.3846 TEST (validation set) r (observed vs predicted) 0.777 0.8551 0.8661 0.7333 SEP 0.122 3.194 0.038 2.225 RMSE 0.121 3.138 0.038 2.207 RPDtest 1.5371 1.8166 1.9445 1.3737 Table 4 Results of Partial Least Squares Discriminant Analysis (PLSDA) for the four matu- ration times (T0, T3, T6 and T9) obtained with spectrophotometric measurements. n. LV is the number of latent vectors. Random probability (%) is the probability of random assignment of an individual into a unit. Pre-processing X-block Baseline Pre-processing Y-block None n. LV 6 Sensitivity 0.926 Specificity 0.915 % Random probability 25.000 % Class prediction 88.889 % Correct classification model (75%) 89.474 % Correct classification independent test (25%) 89.474 P. Papetti et al. / Food Control 27 (2012) 234e241 239
  • 7. resistant to mechanical damage in relation to handling, cutting, and compression. The main issue in order to avoid the tag’s ingestion is to increase its visibility. This could be enhanced with vivid colours and by positioning it just below the cheese rind. Varese, Buffagni, and Percivale (2008) indicated that the positioning of the tags did not affect readability. Concerning the chemical analyses, the obtained data seem to confirm that during maturation, pH reaches a maximum level around the third month, while afterwards equilibrium is estab- lished, as a result of the opposed proteolysis effect from which ammonia is produced and lipolysis leads to a fatty acids release (Zapparoli Duroni, 1997). Moisture into the analysed sections (external, median and internal) regularly decreased during time, as described in previous works (Resmini, Volonterio, Annibaldi, Ferri, 1997). After six months the salt concentration in the external area resulted higher in a statistically significant way than that in the internal portion, as already evidenced by Fossa, Sandri, Scotti, and Malacarne (2007). Average sodium chloride values (see Table 2) were comparable with those reported in literature (Tosi, Sandri, Tedeschi, Fossa, Franceschi, 2007; Tosi, Sandri, Tedeschi, Malacarne, Fossa, 2008). The fat amount into the “Caciottina massaggiata di Amaseno” is mainly related to the milk fat/casein ratio: this parameter depends on the fat amount in the starting milk and on the transformation technology (Fossa et al., 2007). Fat content showed a significant decrease during the maturation period. The uneven moisture distribution and the pH variation explain also the differences in fat amounts (see Table 2). Results on spectrophotometric analysis confirm what reported by Curda and Kukackováb (2004) for the determination of the processed cheese composition (dry matter, fat content and pH) by NIR spectroscopy techniques. A portable VISeNIR system was used directly in the production location, as reported by Antonucci et al. (2010). As this is a non-destructive technique, it is possible to hypothesize a continuous monitoring of cheese chemical charac- teristics during time of maturation and an always accessible web- based reporting system. The estimation of maturation degree by spectral analysis is a very important, as reported by Downey et al. (2005) and it could be used in the cheese factory during the product maturation to characterize the ripening stages, as performed by Martín-del- Campo et al. (2007a,b). The RFID system turned out as effective, reliable and compatible with the production process tool. The spectral-based quality esti- mation of pH, water, chlorides and fat content provided good results that could allow an effective monitoring of the characteristic for each, single cheese wheel. Also a good estimation of maturation degree by spectral analysis was obtained. Concerning the infotracing on the web site, our system could be soon tested on a large scale, in order to enable the different stakeholders to access to the information on production and on the characteristics of cheese producer and farmer (concerning milk origin), entering the RFID code or even a bar-code in casein. In addition, the stakeholders can have access to the information on maturity degree and on quality characteristics, identified by non- destructive spectral systems. This is finalized to increase trans- parency and to ensure product quality, with important impacts on the consumer and on the producer. Moreover, the utilization of a web-based system allows the integration of production and traceability information with all the other information concerning the inspection and documentation requirements, as it is often required to obtain the quality marks. The integration of ICT (Information and Communication Technology), realized in this experimental work, is considered of high importance in order to maximize the following promotion and guarantee keyfactors of local food products: - full traceability, from the producer of raw materials to the single final product; - guarantee of quality control at all the stages of the supply chain; - information transparency, available for the consumer, but also for third inspection bodies and research institutes); - direct product promotion without direct mediation and promotion of its specific characteristics (e.g. organic milk, cruelty free products); - direct interaction channel between consumer and producer (e.g. blog); - direct marketing and online shopping. The producer was interested in such application and also the consumers at marketplaces were curious about this innovative technology. These facts stress the efficacy in traceability and all the potential informative development of such system. 5. Conclusions The consumer or other involved stakeholders can access to the whole production history and to the quality characteristics of every single product, by entering the RFID code on the web screen. Gandino, Montrucchio, Rebaudengo, and Sanchez (2007) adopted a traceability system based on RFID technology in a fruit warehouse in order to match traceability with other benefits, such as supply chain management, commodity value addition and brand management. There are web platforms that allow the access to static or dynamic product information for different stakeholders (Breyer, Daubresse, Sneyers, 2007; Samad, Murdeshwar, Hameed, 2010). A Classical example is represented by the web systems of main courier services enterprises (FedEx, UPS, DHL, etc.). Acknowledgements Authors would like to thank Ms Giuliana Laureti of Cheese Factory San Lorenzo in Valle e Amaseno (Latina e Italy) for the kind hospitality and the willingness to provide extensive information and testing material. References Antonucci, F., Pallottino, F., Paglia, G., Palma, A., D’Aquino, S., Menesatti, P. (2010). Non-destructive estimation of mandarin maturity status through portable VISeNIR spectrophotometer. Food and Bioprocess Technology, 4, 809e813. Beulens, J. M. A., Broens, D.-F., Folstar, P., Hofstede, G. J. (2005). Food safety and transparency in food chains and networks e relationships and challenges. Food Control, 16, 481e486. Breyer, D., Daubresse, P., Sneyers, M. (2007). Bringing scientists to the people e the Co-Extra website. Biotechnology Journal, 2(9), 1081e1085. Brofman-Epelbaum, F., Kluwe Aguiar, L. (2007). Tracking and tracing food prod- ucts with RFID technology: an application for agricultural commodities. In 17th annual forum and symposium IAMA conference-Parma, Italy. Brown, S. D. (2009). Transfer of multivariate calibration models. In S. D. Brown, R. Tauler, B. Walczak (Eds.), Comprehensive chemometrics (pp. 345e378). Oxford: Elsevier. Costa, C., Aguzzi, J., Menesatti, P., Antonucci, F., Rimatori, V., Mattoccia, M. (2008). Shape analysis of different populations of clams in relation to their geographical structure. Journal of Zoology, 276(1), 71e80. Table 5 Confusion matrix. Predicted T3 T6 T9 Total observed T3 4 2 0 6 T6 0 6 0 6 T9 0 0 7 7 P. Papetti et al. / Food Control 27 (2012) 234e241240
  • 8. Costa, C., Aguzzi, J., Menesatti, P., Mànuel, A., Boglione, C., Sarriá, D., et al. (2011). Versatile application of RFID technology to commercial and laboratory research contexts: fresh fish supply-chain and behavioural tests. Instrumentation View- point, 11, 48. Curda, L., Kukackováb, O. (2004). NIR spectroscopy: a useful tool for rapid monitoring of processed cheeses manufacture. Journal of Food Engineering, 61(4), 557e560. De Jong, S. (1993). SIMPLS: an alternative approach to partial least squares regression. Chemometrics and Intelligent Laboratory Systems, 18(3), 251e263. Dolgui, A., Proth, J. M. (2008). RFID technology in supply chain management: State of the art and perspectives. In Proceedings of the 17th world congress, the international federation of automatic control, Seoul, Korea, July 6e11, 2008 (pp. 4464e4475). Downey, G., Sheehan, E., Delahunty, C., O’Callaghan, D., Guinee, T., Howard, V. (2005). Prediction of maturity and sensory attributes of Cheddar cheese using near-infrared spectroscopy. International Dairy Journal, 15, 701e709. Dubeuf, J.-P., Ruiz Morales, F. de A., Castel Genis, J. M. (2010). Initiatives and projects to promote the Mediterranean local cheeses and their relations to the development of livestock systems and activities. Small Ruminant Research, 93(2e3), 67e75. European Commission. (2002). Regulation (EC) No 178/2002 of the European Parliament and of the council of 28 January 2002 laying down the general prin- ciples and requirements of food law, establishing the European Food Safety Authority and laying down procedures in matters of food safety. Fossa, E., Sandri, S., Scotti, C., Malacarne, M. (2007). La maturazione del latte durante l’affioramento in diverse condizioni operative. Scienza e Tecnica Lattiero Casearia, 58, 243e255. Fukatsu, T., Nanseki, T. (2009). Monitoring system for farming operations with wearable devices utilized sensor networks. Sensors, 9, 6171e6184. Gandino, F., Montrucchio, B., Rebaudengo, M., Sanchez, E. R. (2007). Analysis of an RFID-based information system for tracking and tracing in an agri-food chain. RFID Eurasia, 1st Annual, Issue 5e6 Sept. 2007, pp. 1e6. Giusti, A. M., Bignetti, E., Cannella, C. (2008). Exploring new frontiers in total food quality definition and assessment: from chemical to neurochemical properties. Food and Bioprocess Technology, 1, 130e142. Harrop Galvao, R. K., Ugulino Araujo, M. C., Emıdio Jose, G., Coelho Pontes, M. J., Cirino Silva, E., Bezerra Saldanha, T. C. (2005). A method for calibration and validation subset partitioning. Talanta, 67, 736e740. Ilbery, B., Kneafsey, M. (1999). Niche markets and regional speciality food prod- ucts in Europe: towards a research agenda. Environment and Planning A, 31(12), 2207e2222. ISO/IEC 27001. (2005). International Organization for Standardization. Information technology e Security techniques e Information security management systems e Requirements. Geneva: ISO Copyright Office. Jedermann, R., Ruiz-Garcia, L., Lang, W. (2009). Spatial temperature profiling by semi-passive RFID loggers for perishable food transportation. Computers and Electronics in Agriculture, 65, 145e154. Kahn, G. (July 7 2005). Who made my cheese? TAGs track Parmesan’s age, origin. The Wall Street Journal, B1. Kennard, R. W., Stone, L. A. (1969). Computer aided design of experiments. Technometrics, 11, 137e148. Lammers, W., Hasselmann, G. (2007). Tracking, Tracing, Effizienz e Temper- aturgeführte Fleischlogistik mit RFID. LVT Lebensmittel-Industrie, 6, 2e3. Lee, S. J., Jeon, J., Harbers, L. H. (1997). Near-infrared reflectance spectroscopy for rapid analysis of curds during Cheddar cheese making. Journal of Food Science, 62(1), 53e56. Lwoga, E. T., Chilimo, W. (2006). Open access and open source: considerations for agricultural academic libraries in promoting collaboration and sharing of information and knowledge. Quarterly Bulletin of IAALD, 51(4), 177e185. Martín-del-Campo, S. T., Picque, D., Cosío-Ramírez, R., Corrieu, G. (2007a). Eval- uation of chemical parameters in soft mold-ripened cheese during ripening by mid-infrared spectroscopy. Journal of Dairy Science, 90(6), 3018e3027. Martín-del-Campo, S. T., Picque, D., Cosío-Ramírez, R., Corrieu, G. (2007b). Middle infrared spectroscopy characterization of ripening stages of Camembert-type cheeses. International Dairy Journal, 17, 835e845. Menesatti, P., Antonucci, F., Pallottino, F., Roccuzzo, G., Allegra, M., Stagno, F., et al. (2010). Estimation of plant nutritional status by ViseNIR spectrophotometric analysis on orange leaves [Citrus sinensis (L) Osbeck cv Tarocco]. Biosystems Engineering, 105, 448e454. Menesatti, P., Costa, C., Paglia, G., Pallottino, F., D’Andrea, S., Rimatori, V., et al. (2008). Shape-based methodology for multivariate discrimination among Italian hazelnut cultivars. Biosystems Engineering, 101(4), 417e424. Pérez-Aloe, R., Valverde, J. M., Lara, A., Carrillo, J. M., Roa, I., Gonzàlez, J. (2007). Application of RFID tags for the overall traceability of products in cheese industries. RFID Eurasia, 1e5. Ramakrishnan, R., Gehrke, J. (1999). Database management systems. New York: McGraw Hill. Regattieri, A., Gamberi, M., Mancini, R. (2007). Traceability of food products: general framework and experimental evidence. Journal of Food Engineering, 81(2), 347e356. Resmini, P., Volonterio, G., Annibaldi, S., Ferri, G. (1997). Studio sulla diffusione del sale nel formaggio Parmigiano-Reggiano mediante l’uso di Na36Cl. Scienza e Tecnica Lattiero Casearia, 48, 73e82. Rodriguez-Saona, L. E., Koca, N., Harper, W. J., Alvarez, V. B. (2006). Rapid deter- mination of Swiss cheese composition by Fourier transform infrared/attenuated total reflectance spectroscopy. Journal of Dairy Science, 89(5), 1407e1412. Ruiz-Garcia, L., Lunadei, L., Barreiro, P., Robla, J. I. (2009). A review of wireless sensor technologies and applications in agriculture and food industry: state of the art and current trends. Sensors, 9, 4728e4750. Ruiz-Garcia, L., Steinberger, G., Rothmund, M. (2010). A model and prototype implementation for tracking and tracing agricultural batch products along the food chain. Food Control, 21(2), 112e121. Samad, A., Murdeshwar, P., Hameed, Z. (2010). High-credibility RFID-based animal data recording system suitable for small-holding rural dairy farmers. Computers and Electronics in Agriculture, 73(2), 213e218. Sarriá, D., Del Río, J., Mànuel, A., Aguzzi, J., Sardà, F., García, J. A. (2009). Studying the behaviour of Norway lobster using RFID and infrared tracking technologies. In Proceeding of the Oceans’09 IEEE-Bremen, 1e4. doi:10.1109/ OCEANSE.2009.5278280. Tosi, F., Sandri, S., Tedeschi, G. F., Fossa, E., Franceschi, P. (2007). Contenuto di umidità, valori di acido lattico, acidi grassi volatili e pH del Parmigiano- Reggiano, in diverse zone della pasta, a 72 ore dalla produzione. Scienza e Tecnica Lattiero Casearia, 58, 291e301. Tosi, F., Sandri, S., Tedeschi, G. F., Malacarne, M., Fossa, E. (2008). Variazione di composizione e proprietà chimico-fisiche del parmigiano reggiano durante la maturazione e in differenti zone della forma. Scienza e Tecnica Lattiero Casearia, 59(6), 507e528. Varese, E., Buffagni, S., Percivale, F. (2008). Application of RFID technology to the agro-industrial sector: analysis of some case studies. Journal of Commodity Science Technology and Quality, 47(1e4), 171e190. Viscarra-Rossel, R. A., Taylor, H. J., McBratney, A. B. (2007). Multivariate calibration of hyperspectral gamma-ray energy spectra for proximal soil sensing. European Journal of Soil Science, 58, 343e353. Williams, P. C. (2001). Near-infrared technology in the agricultural and food industries. Saint Paul, MN, USA: American Association of Cereal Chemists. Wold, S., Sjostrom, M., Erikssonn, L. (2001). PLS-regression: a basic tool of che- mometrics. Chemometrics and Intelligent Laboratory Systems, 58, 109e130. Woodcock, T., Fagan, C. C., O’Donnell, C. P., Downey, G. (2008). Application of near and mid-infrared spectroscopy to determine cheese quality and authenticity. Food and Bioprocess Technology, 1, 117e129. Xiong, B. H., Luo, Q., Yang, L., Fu, R., Lin, Z., Pan, J. (2007). A practical web-based tracking and traceability information system for the pork products supply chain. New Zealand Journal of Agricultural Research, 50, 725e733. Zanasi, C., Nasuelli, P., Buccolini, F., Pulga, A. (2008). Organic parmesan cheese on- line traceability: a feasible solution. In 16th IFOAM organic world congress, Modena, Italy, June 16e20, 2008, Archived at. http://orgprints.org/view/projects/ conference.html. Zapparoli, G. A., Duroni, F. (1997). Quadro analitico di acidi grassi volatili, pH ed umidità in formaggio grana “scelto” da 1 a 20 mesi di stagionatura. Scienza e Tecnica Lattiero Casearia, 48, 297e304. P. Papetti et al. / Food Control 27 (2012) 234e241 241