2. (3D)views,nearimmediateavailabilityofradiologicexam-
inations,andtheabilitytoeasilychangewindowandlevel
settingsappeartocontributenotonlytoreadingefficiency
but also to recognition of greater amounts of diagnostic
information.6–10
We have observed that compared with other major
radiologic imaging modalities, the handling of ultrasound
(US)examinationshasnotbeenasfullyintegratedintothe
generalradiologyPACSenvironment.Informaldiscussion
withcolleaguesledustosuspectthatthepracticeofUShas
not benefited from PACS to the same degree as radiogra-
phy,CT,andmagneticresonanceimaging(MRI).Totest
this hypothesis, we performed an online survey of the
membership of the Society of Radiologists in Ultrasound
(SRU). It was reasoned that radiologists who belong to
this society would have particular insight into the inter-
section of PACS and US.
Materials and Methods
Aninvitationtocompleteanonlinesurveywassenttothe
1000membersoftheSRUinMarch2009.Thesurveywas
designed to assess the opinions of respondents regarding
the functionality of PACS in the practice of US imaging
and to compare it with the PACS experience in plain-film
radiography, CT, MRI, and nuclear medicine. The invita-
tion was sent by e-mail, which contained a link to the sur-
vey(ConstantContact.com,Waltham,MA),whichcould
befilledoutonlyonce.Thesurveywasavailabletorespon-
dents for 3 months and was not open to the general radi-
ology community. The Institutional Review Board
approved this research for exemption certification.
As there are a variety of available working environ-
mentsforradiology,includingtraditionalfilm-basedimag-
ing,generalradiologyPACS,US-specificminiPACS,and
hybrid PACS–mini PACS, respondents were asked to
identify the imaging environment used in their practice of
both radiology and US imaging.
After answering basic questions about the type and
make of their PACS environment, respondents were pre-
sentedwith4setsofquestionsabouttheirPACSexperience:
1. Rating the PACS Experience for US—Respondents
were asked to rate their overall experience using
PACS in a variety of imaging modalities, including
CT, radiography, US, nuclear medicine, and MRI,
choosing1of5answerchoices:“poor,”“fair,”“good,”
“very good,” and “excellent.”
2. Grading PACS Functions Affecting US Reading—
Respondents were asked to grade how well their
PACS handles a specific set of tasks. A set of PACS
tasks was identified for evaluation because of their
potentialtoaffectUSpracticeperformance(Table1).
This set included basic image presentation tasks as
wellasmorecomplextasksinvolvingmanipulationof
imageinformationanddata.Teachingfile–typetasks
werealsoincludedbecauseoftheirpotentialinaiding
US quality assurance. Respondents were asked to
gradehowwelltheirPACShandleseachofthesetasks
byselecting1of6answers:“don’tknow,”“incapable,”
“poor,” “fair,” “good,” and “excellent.”
3. JudgingtheNeedforUS-RelatedPACSImprovement—
Respondentswereaskedwhethertherewasaneedfor
PACS to improve certain tasks (by implementation
or improvement) by choosing among 3 possible
answers:“notneeded,”“neededurgently,”or“needed
but nonurgently.”
4. AssessmentofPACS-RelatedUSPracticeImprovement—
A set of functions was presented to the respondents,
who were asked whether the introduction of PACS
hadcontributedtoanimprovementoftheirUSprac-
Emerson et al—Ultrasound Imaging on Picture Archiving and Communication Systems
J Ultrasound Med 2013; 32:1377–13841378
Table 1. Ultrasound-Related PACS Tasks Assessed in the Survey
Task Task Type
Capture and display of high-quality black-and-white US images Basic diagnostic
Capture and display of high-quality color US images Basic diagnostic
Measure structures on US images Basic diagnostic
Annotate US images Basic diagnostic
Capture and display US cine clips Complex diagnostic
Use PACS to manage teaching file cases Teaching file/quality assurance
Use PACS to save and find individual US images or cine clips for teaching file purposes Teaching file/quality assurance
Rearrange the order of images in a displayed US examination Work flow efficiency
Capture measurements from a US examination into a spreadsheet in the PACS Work flow efficiency
Import, store, and manipulate US volume acquisitions Complex diagnostic
Change the monitor configuration of the PACS review station Work flow efficiency
Hide patient demographic data on US images Teaching file/quality assurance
3208jum_online_Layout 1 7/22/13 9:27 AM Page 1378
3. tice in each of these areas (Table 2). The possible
answers were “no,” “yes,” and “maybe.” The list was
compiled to assess a range of components of a US
practice that may be impacted by PACS, including
functions affecting practice workflow, diagnosis, and
quality assurance.
The question set “Rating the PACS Experience for
US” was analyzed by comparing the percentage of highly
favorable ratings for each radiologic modality in the list.
Highly favorable ratings were judged to be the combined
responses of the 2 most favorable categories (“very good”
and “excellent”). Because it received the highest rating of
any modality, PACS handling of CT was considered the
standard against which other modalities were compared.
TheMcNemartestwasusedtoassessthestatisticalsignif-
icance of the difference between results for CT and the
other modalities. Statistical significance was set at P < .05.
The question set “Grading PACS Functions Affect-
ing US Reading” was analyzed by comparing the percent-
age of respondents giving a high rating to each function.
A high rating was judged to be 1 of the 2 most favorable
categories (“good” and “excellent”) out of a total of 6
choices. Because the handling of black-and-white images
byPACSisabasicPACSfunctionandbecauseitreceived
the greatest percentage of highly favorable ratings, it was
consideredthestandardagainstwhichtheotherfunctions
werecompared.TheMcNemartestwasusedtodetermine
the significance of the difference in results between this
function and the other functions. Statistical significance
was set at P < .05.
The question set “Judging the Need for US-Related
PACS Improvement” was analyzed by assessing the per-
centageofrespondentsindicatinganeed(whetherurgent
or not) for new implementation or improvement of each
listed PACS function. A compelling need for implemen-
tation or improvement was considered only if a majority
of respondents indicated such a need. The statistical sig-
nificanceof“needed”responseswasanalyzedwithabino-
mial test, comparing each set of results to a threshold
response of 50% (above which would constitute amajor-
ity). Statistical significance was set at P < .005 because of
multiple comparisons.
The question set “Assessment of PACS-Related US
Practice Improvement” was analyzed by comparing the
percentage of respondents indicating that PACS had def-
initelycontributedtoanimprovementoftheirUSpractice
foreachlistedpracticefunction.Thepercentageresponse
for immediate access to the US examination was consid-
ered the standard against which the other responses were
analyzed because of a 95% response that PACS was
responsibleforanimprovementinUSpracticeinthisarea.
The statistical significance of the difference between the
percentage response for this standard and that for each of
the other practice functions was assessed with the McNe-
mar test. Statistical significance was set at P < .05.
Statistical analysis was performed with SAS version
9.3software(SASInstitute,Cary,NC).Missingdatainthe
analysisusingtheMcNemartestwerehandledbypair-wise
deletion. A respondent’s answer was excluded from each
statistical comparison when there was no answer in the
comparison question. For example, if a respondent pro-
vided an answer about the level of satisfaction with PACS
for CT but not for MRI, that respondent’s answer was
excluded from that statistical comparison. However, that
respondent’s answers could still be part of the statistical
comparisonofanothersetofquestionswhenanswerswere
given in each of those comparing questions. For example,
even if excluded from the statistical comparison of satis-
factionforMRIinPACSversusCTinPACS,thatrespon-
dent’s answers could be included in the statistical
comparison of US in PACS versus CT in PACS if there
was an answer for each.
J Ultrasound Med 2013; 32:1377–1384 1379
Emerson et al—Ultrasound Imaging on Picture Archiving and Communication Systems
Table 2. Ultrasound Practice Functions Potentially Affected by PACS
Function Function Type
Provide the radiologist immediate access to US examinations Work flow efficiency
Allow efficient comparison with previous and other modality examinations Diagnostic accuracy
Increase efficiency of patient turnaround times Work flow efficiency
Foster greater confidence in the quality of US examinations Quality assurance/diagnostic accuracy
Enhance communication with sonographers performing US examinations Quality assurance/diagnostic accuracy
Display consistently high-quality grayscale and color images Diagnostic accuracy
Enhance availability of US examinations for referring clinicians Practice efficiency
Review US cine clips Diagnostic accuracy/work flow efficiency
Review US volume data Diagnostic accuracy
Manage US teaching files Quality assurance
3208jum_online_Layout 1 7/22/13 9:27 AM Page 1379
4. Results
A total of 161 radiologists (16.1%) took the survey out of
the 1000 SRU members who were invited. Of the respon-
dents,112(70%)usedageneralradiologyPACS.Sincethe
goalofthisresearchwastheevaluationofthefunctionality
of US-related tools in general radiology PACS, these
respondents using a general radiology PACS formed the
study population (Table 3). Fifteen (9%) of the respon-
dentsusedaminiPACSdesignedforUSuse.Thesmallsize
of this group made analysis difficult. Thirty-four (21%) of
therespondentsusedahybridsystemwithaUSminiPACS
connected to a general radiology PACS. There was ambi-
guity in the results of this last group since it was difficult to
determine with certainty whether their responses referred
solelytotheirexperiencewithPACSorminiPACSorboth.
Therefore,thisgroupwasnotanalyzedfurther.
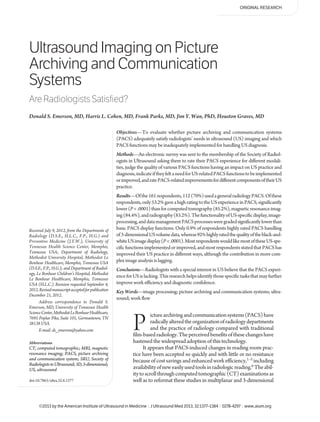
Figure 1 presents modality-specific satisfaction with
PACS. The results for US and nuclear medicine were
significantly lower than for CT. There was no significant
difference in results for MRI and radiography compared
with CT.
Figure2showsthepercentagesofrespondentshighly
rating multiple PACS functions for reviewing US exami-
nations.Exceptforcaptureanddisplayofcolorimages,the
resultsforallofthefunctionsweresignificantlylowerthan
for capture and display of black-and-white images. There
was no significant difference between results for the cap-
tureanddisplayofcolorimagesandcaptureanddisplayof
black-and-white images.
Figure3detailstherespondents’opinionsofwhether
PACS needs to be improved for reviewing US examina-
tionsviatheintroductionorenhancementofcertainfunc-
tions. More than 50% of respondents indicated a need for
improvementinthemorecomplexPACSfunctionsaffect-
ing US examination review (the 7 functions on the right
side of the graph). Of these, results were significantly
greater than 50% for rearranging the image order, teach-
ing file management, teaching file image finding, and 3D
volume capture and display.
Figure4presentsthepercentagesofrespondentsindi-
cating that PACS has definitely improved their US prac-
tice compared with that in a film-based environment in
various practice functions. Ninety-five percent of the
respondents thought that PACS contributed to US prac-
ticeimprovementbymakingUSimagesimmediatelyavail-
able after an examination. Compared with immediate
access, significantly fewer respondents thought that their
USpracticehadimprovedindiagnosticconfidence,incine
clip review, in teaching file management, and in 3D vol-
ume capture and review. On the other hand, there was no
significant difference between the results for immediate
access to images and those for comparison with other
modalities and older examinations, for quality image ren-
dition, for patient turnaround, for availability of examina-
Emerson et al—Ultrasound Imaging on Picture Archiving and Communication Systems
J Ultrasound Med 2013; 32:1377–13841380
Table 3. Picture Archiving and Communication Systems in Use by
Respondents of This Survey
PACS n
Centricity (GE Healthcare, Milwaukee, WI) 32/112
iSITE (Stentor) (Philips Healthcare, Bothell, WA) 21/112a
McKesson Radiology (McKesson, San Francisco, CA) 17/112a
Synapse (Fujifilm Medical Systems, Stamford, CT) 14/112a
IMPAX (Agfa Healthcare, Greenville, SC) 13/112
Emageon (Amicas, Boston, MA) 5/112
Unity (DR Systems, San Diego, CA) 3/112
Carestream (Eastman Kodak, Rochester, NY) 3/112a
IntelePACS (Intelerad, Westminster, CO) 2/112
ProVision (Cerner, North Kansas City, MO) 1/112
Infinitt PACS (Infinitt, Phillipsburg, NJ) 1/112
PowerServer (RamSoft, Toronto, Ontario, Canada) 1/112
Sectra PACS (Sectra, Linköping, Sweden) 1/112
Locally produced 1/112
Not specified 1/112
Numeratorstotalmorethan112respondentsbecauseanumberofrespon-
dents(a)listedtheuseofmorethan1PACSasabasisfortheirresponses.
Figure 1. Percentages of survey respondents highly rating the PACS
experience for a variety of imaging modalities. The percentages are
based on the number of respondents answering this survey question
(denominators) and the number highly rating the PACS experience for
eachmodality(numerators).WiththePACSexperienceforCTreceiving
the highest response, it was chosen as the standard against which the
other modalities were compared. P values were based on this compar-
ison. Asterisked numbers indicate the number of responses used for
each McNemar test of statistical significance. NM indicates nuclear
medicine.
3208jum_online_Layout 1 7/22/13 9:27 AM Page 1380
5. tions to referring clinicians, and for communication with
sonographers.
Discussion
Widespread implementation of PACS into radiology
departments over the last 2 decades indicates recognition
ofthesuperiorityofthedigitalimageenvironmentoverthe
traditional film-based environment.1–6 However, our sur-
vey reveals significantly lower radiologist satisfaction with
PACS support for US compared with extremely positive
satisfaction for PACS support for CT. In contrast, there
was no significant difference between satisfaction with
PACS support for MRI and radiography and that for CT.
Ourdatasuggestthatthislowerlevelofsatisfactionis
not based on radiologists’ concerns regarding basic image
presentationandanalysisfunctionssuchasaccuraterepro-
duction of black-and-white and color US images and
mechanismsformeasurementofstructuresonUSimages.
Indeed, PACS performance of these basic functions was
rated very highly by our respondents.
Dissatisfaction with PACS support for US appears to
be due to a perception of inadequate PACS handling of
more complex functions involving image and data pro-
cessingandpresentation.Thesefunctionsincludestorage
andreformattingofUSvolumedata,captureofUSexam-
inationmeasurementsintoaneditablePACSspreadsheet,
rearrangementofimagesbyareaderofaUSexamination,
display of US cine clips, annotation of images, and hiding
demographicdata.AllofthesePACStaskswerejudgedto
be significantly less well performed compared with more
basic image display and analysis tasks. Furthermore, our
data indicate not only that radiologists give a low per-
formanceratingtothesecomplexPACSfunctionsbutalso
that most want to see many of these functions introduced
or improved.
Handling of teaching file functions (maintaining a
teaching file database within PACS or saving or finding
specificimagesorcineclipswithinPACS)wasjudgedsig-
nificantly less positively than basic image presentation
functionsandinneedofimprovementorimplementation.
Teachingfilefunctionsnotonlysupporttheacademicradi-
ologistinteachingandpublishingbutalsohavethepoten-
tial to support all radiologists in quality assurance and
improved diagnostic accuracy.11 Saving cases tagged by
specificteachingfiledatabasefieldsmaylaythefoundation
J Ultrasound Med 2013; 32:1377–1384 1381
Emerson et al—Ultrasound Imaging on Picture Archiving and Communication Systems
Figure 2. Percentages of respondents highly rating multiple PACS
functions (see Table 1). The percentages are based on the number of
respondentsansweringeachquestion(denominators)andthenumber
of respondents highly rating each of these functions (numerators).
P valuesindicatethesignificanceofthedifferencebetweenhighlyrated
responses for each function and that of the most highly rated function
(captureanddisplayofhigh-qualityblack-and-whiteUSimages).Aster-
isked numbers indicate the number of responses used for each
McNemartestofstatisticalsignificance.Themostbasicfunctions(left3
bars) were all rated highly. A significantly lower percentage of respon-
dents highly rated the more complex functions (right 7 bars). B&W
indicates black-and-white; and TF, teaching file.
Figure 3. Percentages of respondents indicating the need for PACS to
implement/improve various tasks (see Table 1). The percentages are
based on the number of respondents answering the question (denom-
inator) and number of respondents indicating the need for implemen-
tation/improvement for each task (numerator). Percentages of greater
than50%wereviewedasrepresentingamajorityinsupportofimprove-
ment or introduction of a task. P values obtained with the binomial test
indicate statistical significance of the difference between the percent-
age of respondents wanting to see a change and a threshold response
of 50%. TF indicates teaching file.
3208jum_online_Layout 1 7/22/13 9:27 AM Page 1381
6. for a PACS-based system to provide technical or diagnos-
tic feedback to sonographers, positively impacting quality
control in US departments.12
The introduction of PACS was overwhelmingly rec-
ognized by our respondents as improving the US practice
environment, particularly in the immediate access to the
US images at the conclusion of the US examination, the
abilitytoeasilyandrapidlycomparethecurrentUSexam-
ination with previous US and other modality examina-
tions,aswellastheconsistentqualityofUSimagedisplay.
A very large number of our respondents also indicated
that PACS has improved the overall work flow efficiency
of US departments with more rapid patient turnaround
times and greater availability of the examinations to the
ordering clinicians for review. On the other hand,amuch
lower percentage of radiologists believed that PACS has
contributedtoUSpracticeimprovementinthehandlingof
cineclipsandvolumedataaswellasmanagingteachingfile
functions.
Nearly two-thirds of our respondents believed that
PACShasresultedinanincreaseindiagnosticconfidence
in US examinations. Although this number represents an
impressivePACS-relatedpracticeimprovement,theresult
was significantly lower than for the responses rating prac-
ticeefficiencyandthefidelityofimagedisplay.Immediate
access to examinations, improved communication with
sonographers,andthefidelityofUSimagedisplay,judged
by our respondents to be enhanced by PACS, are likely
major contributions to improved diagnostic confidence.
On the other hand, PACS handling of 3D volumes and
cineclips,whichprovidetheradiologistwithtoolstoinde-
pendently review US anatomic data and make independ-
ent anatomic and pathologic assessments, was rated poor
byourrespondents.Ultrasoundcineclipsimprovethesig-
nal to noise ratio of both normal and pathologic imaged
anatomy, which results in improved diagnostic confi-
dence.13 Scrolling through stacked CT examinations has
been shown to improve understanding of spatial relation-
ships of imaged anatomy6,14; US may be able to accom-
plish the same result via the use of cine clips and review of
3D volumes.15–17
The rating of PACS functions is complex because of
the multiple PACS brands evaluated in our sampling and
theassociatedvariationinavailabilityandimplementation
ofPACSfunctions.SomeofthePACS,forexample,could
nothandlecineclipsatall,whereasotherPACSstoredand
displayedcineclipswithvaryingeaseofreview.Almostno
PACS could process and reformat 3D US volumes, and
whentheycould,itwasonlywithproprietarysoftwaretied
to a specific make of US machine. All PACS had image
annotation available, but the annotation was often not
directly scaled to the displayed size of the image frame,
allowed no adjustments to be made to font size, style, or
color, and could not be created as a layer, which could be
hidden and viewed by the reader as needed.
Automatic rearrangement of the displayed image
order and acquisition of measurements from a US exami-
nationintoaneditablePACSspreadsheethavethepoten-
tial to improve the radiologist’s work flow efficiency. It
would be useful for the US machine software to tag each
imagewithananatomicdescriptorandtransmitthattothe
PACS.Theradiologistcouldthensimplypushabuttonon
the PACS to group together images of similar organs,
anatomic regions, and/or planes of view or to automati-
cally rearrange the order of images to parallel the order
usedforthereport.InsteadofhuntingthroughaUSexam-
ination to find measurements for reporting, having access
to imported measurements from a US examination in a
PACSspreadsheetwouldincreasereportingefficiencyand
Emerson et al—Ultrasound Imaging on Picture Archiving and Communication Systems
J Ultrasound Med 2013; 32:1377–13841382
Figure 4. Percentages of respondents indicating that PACS had defi-
nitely improved their US practice in each of 10 practice functions (see
Table 2) compared with a film-based environment. The percentages are
basedonthenumberofrespondentsansweringeachquestion(denom-
inator)andnumberofrespondentsexperiencingPACS-associatedprac-
tice improvement (numerator). Fewer respondents answered this part
of the survey than the other questions because of its placement in an
optional second part of the online survey. Immediate access to the US
examination was considered the standard against which all the other
functions were compared. Asterisked numbers indicate the number of
responsesusedforeachMcNemartestofstatisticalsignificance.Asig-
nificantly lower percentage of respondents indicated PACS-based
improvement in the 4 practice functions on the far right. Pt indicates
patient; and TF, teaching file.
3208jum_online_Layout 1 7/22/13 9:27 AM Page 1382
7. accuracy. With an interactive and editable spreadsheet in
PACS, clicking on a measurement could direct the radiol-
ogist to the source image for assessment of adequacy or
editing. Ultimately, these measurements could automati-
cally populate a structured report, resulting in increased
reporting efficiency and accuracy.
By its nature, this research depended on the willing
participation of a subset of the radiology community in a
survey. As such, the results may not fully represent the
opinionsoftheentireradiologycommunity.Nevertheless,
by selecting the members of the SRU, we think that the
resultsreflecttheopinionsofradiologistsmostconcerned
about the specific needs of US in the PACS environment.
Survey data analysis may have potentially been lim-
itedbyalackofacquisitionofrespondents’yearlyandcase
volume PACS experience for different radiologic modali-
ties.However,therespondentsappearedtohavefaithfully
followed the instructions to answer questions about the
various imaging modalities in PACS based on their own
personalexperience.Thevariablenumberofrespondents
answeringthedifferentquestionsinFigure1confirmsthis
impression. Respondents were not provided with precise
definitions of the various possible answers to the survey,
introducing the possibility of a lack of consistency in the
selection of answers. However, the answers were struc-
turedinarelativescaleandappearedtobereasonablyself-
explanatory.
Theresultsofthissurveyrepresentasnapshotofopin-
ionsaboutPACSfromafewmonthsin2009,anditispos-
sible that some of the concerns described in this research
have been addressed by certain manufacturers since that
time. However, yearly shares of PACS revenue according
tomanufacturershavenotchangedsignificantlyfrom2009
to2012,suggestinglittlechangeinrelativerepresentationof
manufacturers in the installed PACS base (N. M. Daher,
principalanalyst,medicalimaging,Frost&Sullivan,Moun-
tain View, CA, personal communication, October 29,
2012). In addition, it does seem to us from personal expe-
rience and from conversations with colleagues that much
ofwhatwasthoughttobelackingatthattimeisstilllacking.
Picture archiving and communication systems offer
multiple benefits to radiology departments and to the
largermedicalsystemsinwhichtheyoperate.18 Whenana-
lyzed from the perspective of the radiologist, improved
productivity is the most often described benefit.2,3,19
The potential for PACS to enhance diagnostic accuracy
has also been recognized.6,8,9,20 By empowering radiolo-
gists to scroll through stacked CT examinations and to
perform 3D CT reformatting on the fly, PACS has led
to productivity and diagnostic accuracy gains in CT.6–10
On the other hand, our research suggests that the devel-
opment of PACS tools specifically targeted for US has
been lagging. By rigidly constraining radiologists to read
US examinations in virtually the same way as they have
done in the pre-PACS film era, PACS and US manu-
facturers have failed to deliver the same potential for
improvement in US image reading. Many of the US-
related PACS tasksanalyzedinthissurveyhavethepoten-
tial to correct this situation.13
Improving the PACS experience for US is likely a
complicated endeavor and would require coordinated
efforts by manufacturers of US machines and PACS and
mayalsorequirenewDigitalImagingCommunicationsin
Medicine standards. For this situation to begin to change,
USandPACScompaniesmusthearfromradiologiststhat
PACSisnotadequatelymeetingtheirUSpracticeneeds.21
This survey demonstrates that radiologists with special
interest in US believe that the PACS experience for US is
lacking. Furthermore, this research helps identify those
specific tasks that may further improve US-related work
efficiency and diagnostic confidence.
References
1. ChanL,TrambertM,KywiA,HartzmanS.PACSinprivatepractice:effect
onprofitsandproductivity.JDigitImaging2002;15(suppl1):131–136.
2. Siegel EL, Reiner BI, Siddiqui KM. Ten filmless years and ten lessons: a
10th-anniversary retrospective from the Baltimore VA Medical Center.
JAmCollRadiol2004;1:824–833.
3. Van Ooijen PMA, Bongaerts AHH, Witkamp R, Wijker A, Tukker W,
OudkerkM.Multi-detectorcomputedtomographyand3-dimensional
imaging in a multi-vendor picture archiving and communications
systems(PACS)environment.AcadRadiol2004;11:649–660.
4. LepantoL,ParéG,AubryD,RobillardP,LesageJ.ImpactofPACSondic-
tationturnaroundtimeandproductivity.JDigitImaging2006;19:92–97.
5. Mackinnon AD, Billington RA, Adam EJ, Dundas DD, Patel U. Picture
archivingandcommunicationsystemsleadtosustainedimprovements
in reporting times and productivity: results of a 5-year audit. Clin Radiol
2008;63:796–804.
6. Andriole KP, Wolfe JM, Khorasani R, et al. Optimizing analysis, visuali-
zation,andnavigationoflargeimagedatasets:one5000-sectionCTscan
canruinyourwholeday.Radiology2011;259:346–362.
7. MathieAG,StricklandNH.InterpretationofCTscanswithPACSimage
displayinstackmode.Radiology1997;203:207–209.
8. LevMH,FarkasJ,GemmeteJJ,etal.Acutestroke:improvednonenhanced
CTdetection—benefitsofsoft-copyinterpretationbyusingvariablewin-
dowwidthandcenterlevelsettings.Radiology1999;213:150–155.
9. Lucey BC, Stuhlfaut JW, Hochberg AR, Varghese JC, Soto JA. Evalua-
tionofbluntabdominaltraumausingPACS-based2Dand3DMDCT
reformations of the lumbar spine and pelvis. AJR Am J Roentgenol 2005;
185:1435–1440.
J Ultrasound Med 2013; 32:1377–1384 1383
Emerson et al—Ultrasound Imaging on Picture Archiving and Communication Systems
3208jum_online_Layout 1 7/22/13 9:27 AM Page 1383
8. 10. KimSH,LeeJM,KimYJ,etal.Detectionofhepatocellularcarcinomaon
CT in liver transplant candidates: comparison of PACS tile and multi-
synchronizedstackmodes.AJRAmJRoentgenol2007;188:1337–1342.
11. HalstedMJ,GuluzianJK,PerryLA,LittleIG,BentonC.Whatisnormal?
Aclinicallyusefulreferencecollectionofpediatricradiologycasescreated
withinaPACS.JAmCollRadiol2005;2:189–192.
12. Nagy PG, Pierce B, Otto M, Safdar NM. Quality control management
and communication between radiologists and technologists. J Am Coll
Radiol2008;5:759–765.
13. BraggA,AngtuacoT.Theimpactofintroducingcineclipsinroutineultra-
soundprotocols[abstract].JUltrasoundMed2009;28(suppl):S58.
14. Kim YJ, Han JK, Kim SH, et al. Small-bowel obstruction in a phantom
model of ex vivo porcine intestine: comparison of PACS stack and tile
modesforCTinterpretation.Radiology2005;236:867–871.
15. Riccabona M, Fritz GA, Schöllnast H, Schwarz T, Deutschmann MJ,
Mache CJ. Hydronephrotic kidney: pediatric three-dimensional US for
relative renal size assessment—initial experience. Radiology 2005;
236:276–283.
16. TacheV,TarsaM,RomineL,PretoriusDH.Three-dimensionalobstet-
ricultrasound.SeminUltrasoundCTMR2008;29:147–155.
17. Rajiah P, Mak C, Dubinksy TJ, Dighe M. Ultrasound of fetal cardiac
anomalies.AJRAmJRoentgenol2011;197:W747–W760.
18. FaggioniL,NeriE,CastellanaC,CaramellaD,BartolozziC.Thefuture
ofPACSinhealthcareenterprises.EurJRadiol2011;78:253–258.
19. Reiner BI, Siegel EL, Hooper FJ, Pomerantz S, Dahlke A, Rallis D.
Radiologists’productivityintheinterpretationofCTscans:acomparison
of PACS with conventional film. AJR Am J Roentgenol 2001; 176:861–
864.
20. ReinerBI,SiegelEL,HooperFJ.AccuracyofinterpretationofCTscans:
comparing PACS monitor displays and hard-copy images. AJR Am J
Roentgenol2002;179:1407–1410.
21. Menard A, Seltzer S, Khorasani R. Do we expect too much from our IT
vendors?Whatcanwedoaboutit?JAmCollRadiol2010;7:980–982.
Emerson et al—Ultrasound Imaging on Picture Archiving and Communication Systems
J Ultrasound Med 2013; 32:1377–13841384
3208jum_online_Layout 1 7/22/13 9:27 AM Page 1384