SlideShare a Scribd company logo
1 of 11
Download to read offline
MIP System Field Test
            for Mid-Low Level TCE


                                                        Schematic of MIP
                                                        Probe with VOCs
                                                        penetrating the
                                                        membrane.

Dan Pip and Blake Slater of Geoprobe Systems® running
an MIP log at the Wall St. location in Salina, KS.

 This presentation describes testing performed by Geoprobe
 Systems® to compare MIP log results to lab analysis of co-
 located soil samples. The logs and samples were obtained at a
 site where chlorinated volatile organic compounds (X-VOCs)
 were released to the soil and ground water. TCE and other
 solvents were used at the former air force base where releases
 occurred over several years, beginning during World War II.
 There was medium to low level X-VOC contamination (< 1 ppm)
 at the location studied here. The primary contaminant
 detected at this location was TCE (trichloroethene).

                                       1
WS19 MiHPT Log


The logs presented here were obtained during field testing of the MiHPT
probe under development by Geoprobe in 2011. The PID and FID
responses are relatively low in this log and the XSD response (< 1.5E5µV)
suggests the presence of moderate to low concentrations of chlorinated
VOCs. The EC log and HPT pressure log indicate primarily fine grained
materials in the formation with some coarser materials interspersed
with the fines at various depths (confirmed by sampling).
                                   2
Background Log Versus
         Low Level TCE on XSD Detector


              Background                  Low Level TCE
              WS25                        WS19


          Both logs scaled at
          1.5E5 µV for XSD


The WS19 MIP log exhibits a relatively lo level XSD response for
this area of contamination. However, comparison of the WS19
log to a non-impacted location at the site (WS25) demonstrates
that the WS19 MIP-XSD signal is robust and easily discernable
from background signal.
                                3
Overlay of WS19, 20 & 21 Logs


                                          WS19=black
                                          WS20=blue
                                          WS21=green


Overlay of WS19 and two other logs run about one meter from this location
(see map, next slide) show consistent EC results. The detector results show
some variation but the XSD responses are generally consistent indicating low
to medium level X-VOCs in the local formation. Based primarily on the XSD
detector responses soil samples were collected from 4ft to 31ft to asses the
concentrations of X-VOCs present in the subsurface.
                                     4
MiHPT19, 20 & 21 Log Locations
                                        Wall St. X-VOC Site
                7

                        MiHPT20                 4.66 ft
                                                (1.42m)
                6

                                                                                 MiHPT19
                5
Northing (ft)


                                                     DT325 Soil
                4                                    Boring


                3


                2
                                                             MiHPT21

                1
                    3         4         5          6               7         8             9
                                              Easting (ft)

                                                                  Photo of the MiHPT19,
                                                                  20 & 21 log locations.
                                                                  Looking generally
                                                                  north toward the
                                        19                        Salina airport control
                20         DT325
                                                                  tower. Old source is
                                                                  former fire training
                                                                  area to the west (left)
                                  21                              of the photo.
                                                 5
Using the DT325 System to Collect Soil
           Cores at the WS19 Location

The dual tube DT325 system
equipped with a 5ft (1.52m)
sample tube and PVC liner was
used to collect 4ft (1.22m)
long soil cores to a depth of
32ft (9.8m) between the
replicate logs at the low-level
X-VOC area. (See map above)


                           A Terra Core™ tool (En Novative
                           Tech. Inc.) was used to collect about
                           5 grams of sample from a hole cut in
                           the side of the DT325 liner at each
                           targeted depth.

                           The soil core was then transferred
                           immediately to a tared VOA vial
                           already prepared with a stir bar and
                           reagent grade water.

                           Once the transfer was completed
                           the VOA vials were stored on ice in a
                           cooler until delivered to the lab for
                           analysis.
                                  6
Soil Sample Analytical Results for X-VOCs
          Depth              CCL4               TCE               Total X-VOC
          (ft bgs)           (µg/kg)            (µg/kg)           (µg/kg)
              4                 28     ND          28     ND         28     ND
              6                 22     ND          22     ND         22     ND
              8                 26     ND          26     ND         26     ND
              9                 24     ND          24     ND         24     ND
              10                24     ND          24                24
              11                24     ND          28                28
              12                24     ND          25                25
              13                25     ND          33                33
              14                25     ND          31                31
              16                26     ND          33                33
              17                23     ND          31                31
              18                21     ND          21     ND         21     ND
              20                30     ND          39                39
              22                25     ND         140                140
              24                27     ND          30     QC         30     QC
              25                26     ND         190                190
              26                25                420                445
             26.1 DUP           26                450                476
              27                30     ND         410                410
              28                18     ND         300                300
              29                24     ND         230                230
              30                23     ND          91                91
               31              26 ND         90              90
The soil samples were submitted to Continental Analytical Services (CAS) Laboratory,
Salina, KS for analysis by EPA Method 8260B GC-MS for high level VOCs. The method
reporting limit ranged from about 20mg/kg to 50mg/kg (parts per billion) depending on
the mass of sample recovered and other factors. Analytes: CCL4= carbon tetrachloride,
TCE = trichloroethene. Chloroform was nondetect for all samples at this location.
      ND = nondetect, associated number is the sample reporting limit .
      QC = matrix spike recovery was low for this sample.
                                                  7
XSD Log WS19 and Soil Sample Analytical Results
              0
                                        WS19

                                        TCE (µg/kg)

                                        ND TCE
              5                         VOC axis (µg/kg)


                                        A plot of the WS19 XSD log with the
             10                         results of the soil sample analyses. The
                                        maximum XSD detector response is
                                        about 1.2E5 µV above baseline and
                                        highest soil concentrations are just
                                        below 0.5ppm. There is good
Depth (ft)


             15                         correspondence between the XSD
                                        detector log and the TCE concentrations
                                        observed in the soil samples. These
                                        results indicate that TCE at the 100
                                        µg/kg level in soil may be readily
             20
                                        detected at this site with the MIP-XSD
                                        system.


             25


             30
                            100                   300              500 µg/kg

             2.0E+04          6.0E+04                 1.0E+05         1.4E+05
                                        XSD (µV)
                                           8
XSD Logs: Mid-Low X-VOC
              0


                                                 WS19
                                                 WS20
              5
                                                 WS21
                                                 TCE (µg/kg)
                                                 ND TCE
                                                 VOC axis (µg/kg)
             10

                                          A plot of all 3 XSD logs obtained at
                                          this location along with the TCE
                                          soil sample results. Again,
Depth (ft)


             15
                                          generally good correspondence
                                          between soil sample analytical
                                          results and the XSD logs, some
                                          variation observed between logs.
             20                           Note, TCE was the primary
                                          contaminant observed at this
                                          location. See data table above.


             25


             30
                       100                300                       500 µg/kg

             2.0E+04     6.0E+04              1.0E+05                  1.4E+05
                                   XSD (µV)
                                      9
Summary for WS19 Low Level X-VOC Location

• The MIP-XSD system can detect trichloroethene (TCE) in the
100mg/kg to 500mg/kg concentration range in soil when maintained
and operated properly. Lower detection limits may be possible under
good field and optimized MIP-XSD system operating conditions.

• Replicate MIP logs with the XSD detector show generally good
correspondence in detector response for moderate to low level TCE.

• Dual tube DT325 soil sampling was used to collect soil cores across
the zone of positive detector response.

• Good correspondence is observed between the XSD detector
responses and the TCE analytical results for the soil samples.

• The soil TCE results are low or nondetect over the zones where the
MIP-XSD system displays little or no response above the baseline.

• The soil TCE results are positive detect over the interval where the
MIP detectors show clear response in the replicate logs.

• Soil coring and sub-sampling techniques for volatiles analysis can
have a substantial impact on the analytical results as well as the
correspondence between MIP results and soil sample results.


• It is also important to collect the soil
cores in close proximity (spatially and
chronologically) to the MIP logs to get a
good correlation between the MIP log
and analytical results.

                                   10
To learn more about the MIP system
               visit
       www.geoprobe-di.com


   MIP System Specifications for this Study:

   Probe: Combined MIP-HPT Probe, PN MK6530

   GC and Detectors: SRI Model 310C GC equipped
   with XSD detector, 10.6eV PID and FID detectors

   MIP Controller Model MP6505

   Field Instrument Model FI6000

   Carrier Gas: N2 at 40ml/min

   Trunkline equipped with an unheated 1/16” OD x
   0.04” ID stainless steel return gas line


                           11

More Related Content

Featured

AI Trends in Creative Operations 2024 by Artwork Flow.pdf
AI Trends in Creative Operations 2024 by Artwork Flow.pdfAI Trends in Creative Operations 2024 by Artwork Flow.pdf
AI Trends in Creative Operations 2024 by Artwork Flow.pdfmarketingartwork
 
PEPSICO Presentation to CAGNY Conference Feb 2024
PEPSICO Presentation to CAGNY Conference Feb 2024PEPSICO Presentation to CAGNY Conference Feb 2024
PEPSICO Presentation to CAGNY Conference Feb 2024Neil Kimberley
 
Content Methodology: A Best Practices Report (Webinar)
Content Methodology: A Best Practices Report (Webinar)Content Methodology: A Best Practices Report (Webinar)
Content Methodology: A Best Practices Report (Webinar)contently
 
How to Prepare For a Successful Job Search for 2024
How to Prepare For a Successful Job Search for 2024How to Prepare For a Successful Job Search for 2024
How to Prepare For a Successful Job Search for 2024Albert Qian
 
Social Media Marketing Trends 2024 // The Global Indie Insights
Social Media Marketing Trends 2024 // The Global Indie InsightsSocial Media Marketing Trends 2024 // The Global Indie Insights
Social Media Marketing Trends 2024 // The Global Indie InsightsKurio // The Social Media Age(ncy)
 
Trends In Paid Search: Navigating The Digital Landscape In 2024
Trends In Paid Search: Navigating The Digital Landscape In 2024Trends In Paid Search: Navigating The Digital Landscape In 2024
Trends In Paid Search: Navigating The Digital Landscape In 2024Search Engine Journal
 
5 Public speaking tips from TED - Visualized summary
5 Public speaking tips from TED - Visualized summary5 Public speaking tips from TED - Visualized summary
5 Public speaking tips from TED - Visualized summarySpeakerHub
 
ChatGPT and the Future of Work - Clark Boyd
ChatGPT and the Future of Work - Clark Boyd ChatGPT and the Future of Work - Clark Boyd
ChatGPT and the Future of Work - Clark Boyd Clark Boyd
 
Getting into the tech field. what next
Getting into the tech field. what next Getting into the tech field. what next
Getting into the tech field. what next Tessa Mero
 
Google's Just Not That Into You: Understanding Core Updates & Search Intent
Google's Just Not That Into You: Understanding Core Updates & Search IntentGoogle's Just Not That Into You: Understanding Core Updates & Search Intent
Google's Just Not That Into You: Understanding Core Updates & Search IntentLily Ray
 
Time Management & Productivity - Best Practices
Time Management & Productivity -  Best PracticesTime Management & Productivity -  Best Practices
Time Management & Productivity - Best PracticesVit Horky
 
The six step guide to practical project management
The six step guide to practical project managementThe six step guide to practical project management
The six step guide to practical project managementMindGenius
 
Beginners Guide to TikTok for Search - Rachel Pearson - We are Tilt __ Bright...
Beginners Guide to TikTok for Search - Rachel Pearson - We are Tilt __ Bright...Beginners Guide to TikTok for Search - Rachel Pearson - We are Tilt __ Bright...
Beginners Guide to TikTok for Search - Rachel Pearson - We are Tilt __ Bright...RachelPearson36
 
Unlocking the Power of ChatGPT and AI in Testing - A Real-World Look, present...
Unlocking the Power of ChatGPT and AI in Testing - A Real-World Look, present...Unlocking the Power of ChatGPT and AI in Testing - A Real-World Look, present...
Unlocking the Power of ChatGPT and AI in Testing - A Real-World Look, present...Applitools
 
12 Ways to Increase Your Influence at Work
12 Ways to Increase Your Influence at Work12 Ways to Increase Your Influence at Work
12 Ways to Increase Your Influence at WorkGetSmarter
 

Featured (20)

AI Trends in Creative Operations 2024 by Artwork Flow.pdf
AI Trends in Creative Operations 2024 by Artwork Flow.pdfAI Trends in Creative Operations 2024 by Artwork Flow.pdf
AI Trends in Creative Operations 2024 by Artwork Flow.pdf
 
Skeleton Culture Code
Skeleton Culture CodeSkeleton Culture Code
Skeleton Culture Code
 
PEPSICO Presentation to CAGNY Conference Feb 2024
PEPSICO Presentation to CAGNY Conference Feb 2024PEPSICO Presentation to CAGNY Conference Feb 2024
PEPSICO Presentation to CAGNY Conference Feb 2024
 
Content Methodology: A Best Practices Report (Webinar)
Content Methodology: A Best Practices Report (Webinar)Content Methodology: A Best Practices Report (Webinar)
Content Methodology: A Best Practices Report (Webinar)
 
How to Prepare For a Successful Job Search for 2024
How to Prepare For a Successful Job Search for 2024How to Prepare For a Successful Job Search for 2024
How to Prepare For a Successful Job Search for 2024
 
Social Media Marketing Trends 2024 // The Global Indie Insights
Social Media Marketing Trends 2024 // The Global Indie InsightsSocial Media Marketing Trends 2024 // The Global Indie Insights
Social Media Marketing Trends 2024 // The Global Indie Insights
 
Trends In Paid Search: Navigating The Digital Landscape In 2024
Trends In Paid Search: Navigating The Digital Landscape In 2024Trends In Paid Search: Navigating The Digital Landscape In 2024
Trends In Paid Search: Navigating The Digital Landscape In 2024
 
5 Public speaking tips from TED - Visualized summary
5 Public speaking tips from TED - Visualized summary5 Public speaking tips from TED - Visualized summary
5 Public speaking tips from TED - Visualized summary
 
ChatGPT and the Future of Work - Clark Boyd
ChatGPT and the Future of Work - Clark Boyd ChatGPT and the Future of Work - Clark Boyd
ChatGPT and the Future of Work - Clark Boyd
 
Getting into the tech field. what next
Getting into the tech field. what next Getting into the tech field. what next
Getting into the tech field. what next
 
Google's Just Not That Into You: Understanding Core Updates & Search Intent
Google's Just Not That Into You: Understanding Core Updates & Search IntentGoogle's Just Not That Into You: Understanding Core Updates & Search Intent
Google's Just Not That Into You: Understanding Core Updates & Search Intent
 
How to have difficult conversations
How to have difficult conversations How to have difficult conversations
How to have difficult conversations
 
Introduction to Data Science
Introduction to Data ScienceIntroduction to Data Science
Introduction to Data Science
 
Time Management & Productivity - Best Practices
Time Management & Productivity -  Best PracticesTime Management & Productivity -  Best Practices
Time Management & Productivity - Best Practices
 
The six step guide to practical project management
The six step guide to practical project managementThe six step guide to practical project management
The six step guide to practical project management
 
Beginners Guide to TikTok for Search - Rachel Pearson - We are Tilt __ Bright...
Beginners Guide to TikTok for Search - Rachel Pearson - We are Tilt __ Bright...Beginners Guide to TikTok for Search - Rachel Pearson - We are Tilt __ Bright...
Beginners Guide to TikTok for Search - Rachel Pearson - We are Tilt __ Bright...
 
Unlocking the Power of ChatGPT and AI in Testing - A Real-World Look, present...
Unlocking the Power of ChatGPT and AI in Testing - A Real-World Look, present...Unlocking the Power of ChatGPT and AI in Testing - A Real-World Look, present...
Unlocking the Power of ChatGPT and AI in Testing - A Real-World Look, present...
 
12 Ways to Increase Your Influence at Work
12 Ways to Increase Your Influence at Work12 Ways to Increase Your Influence at Work
12 Ways to Increase Your Influence at Work
 
ChatGPT webinar slides
ChatGPT webinar slidesChatGPT webinar slides
ChatGPT webinar slides
 
More than Just Lines on a Map: Best Practices for U.S Bike Routes
More than Just Lines on a Map: Best Practices for U.S Bike RoutesMore than Just Lines on a Map: Best Practices for U.S Bike Routes
More than Just Lines on a Map: Best Practices for U.S Bike Routes
 

Ws19 Low X Voc V1

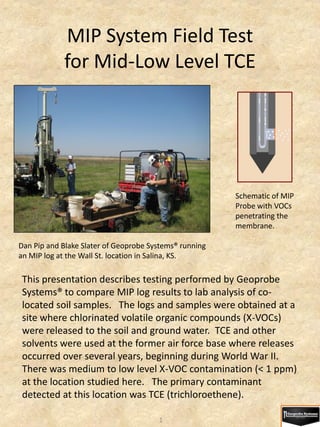
  • 1. MIP System Field Test for Mid-Low Level TCE Schematic of MIP Probe with VOCs penetrating the membrane. Dan Pip and Blake Slater of Geoprobe Systems® running an MIP log at the Wall St. location in Salina, KS. This presentation describes testing performed by Geoprobe Systems® to compare MIP log results to lab analysis of co- located soil samples. The logs and samples were obtained at a site where chlorinated volatile organic compounds (X-VOCs) were released to the soil and ground water. TCE and other solvents were used at the former air force base where releases occurred over several years, beginning during World War II. There was medium to low level X-VOC contamination (< 1 ppm) at the location studied here. The primary contaminant detected at this location was TCE (trichloroethene). 1
  • 2. WS19 MiHPT Log The logs presented here were obtained during field testing of the MiHPT probe under development by Geoprobe in 2011. The PID and FID responses are relatively low in this log and the XSD response (< 1.5E5µV) suggests the presence of moderate to low concentrations of chlorinated VOCs. The EC log and HPT pressure log indicate primarily fine grained materials in the formation with some coarser materials interspersed with the fines at various depths (confirmed by sampling). 2
  • 3. Background Log Versus Low Level TCE on XSD Detector Background Low Level TCE WS25 WS19 Both logs scaled at 1.5E5 µV for XSD The WS19 MIP log exhibits a relatively lo level XSD response for this area of contamination. However, comparison of the WS19 log to a non-impacted location at the site (WS25) demonstrates that the WS19 MIP-XSD signal is robust and easily discernable from background signal. 3
  • 4. Overlay of WS19, 20 & 21 Logs WS19=black WS20=blue WS21=green Overlay of WS19 and two other logs run about one meter from this location (see map, next slide) show consistent EC results. The detector results show some variation but the XSD responses are generally consistent indicating low to medium level X-VOCs in the local formation. Based primarily on the XSD detector responses soil samples were collected from 4ft to 31ft to asses the concentrations of X-VOCs present in the subsurface. 4
  • 5. MiHPT19, 20 & 21 Log Locations Wall St. X-VOC Site 7 MiHPT20 4.66 ft (1.42m) 6 MiHPT19 5 Northing (ft) DT325 Soil 4 Boring 3 2 MiHPT21 1 3 4 5 6 7 8 9 Easting (ft) Photo of the MiHPT19, 20 & 21 log locations. Looking generally north toward the 19 Salina airport control 20 DT325 tower. Old source is former fire training area to the west (left) 21 of the photo. 5
  • 6. Using the DT325 System to Collect Soil Cores at the WS19 Location The dual tube DT325 system equipped with a 5ft (1.52m) sample tube and PVC liner was used to collect 4ft (1.22m) long soil cores to a depth of 32ft (9.8m) between the replicate logs at the low-level X-VOC area. (See map above) A Terra Core™ tool (En Novative Tech. Inc.) was used to collect about 5 grams of sample from a hole cut in the side of the DT325 liner at each targeted depth. The soil core was then transferred immediately to a tared VOA vial already prepared with a stir bar and reagent grade water. Once the transfer was completed the VOA vials were stored on ice in a cooler until delivered to the lab for analysis. 6
  • 7. Soil Sample Analytical Results for X-VOCs Depth CCL4 TCE Total X-VOC (ft bgs) (µg/kg) (µg/kg) (µg/kg) 4 28 ND 28 ND 28 ND 6 22 ND 22 ND 22 ND 8 26 ND 26 ND 26 ND 9 24 ND 24 ND 24 ND 10 24 ND 24 24 11 24 ND 28 28 12 24 ND 25 25 13 25 ND 33 33 14 25 ND 31 31 16 26 ND 33 33 17 23 ND 31 31 18 21 ND 21 ND 21 ND 20 30 ND 39 39 22 25 ND 140 140 24 27 ND 30 QC 30 QC 25 26 ND 190 190 26 25 420 445 26.1 DUP 26 450 476 27 30 ND 410 410 28 18 ND 300 300 29 24 ND 230 230 30 23 ND 91 91 31 26 ND 90 90 The soil samples were submitted to Continental Analytical Services (CAS) Laboratory, Salina, KS for analysis by EPA Method 8260B GC-MS for high level VOCs. The method reporting limit ranged from about 20mg/kg to 50mg/kg (parts per billion) depending on the mass of sample recovered and other factors. Analytes: CCL4= carbon tetrachloride, TCE = trichloroethene. Chloroform was nondetect for all samples at this location. ND = nondetect, associated number is the sample reporting limit . QC = matrix spike recovery was low for this sample. 7
  • 8. XSD Log WS19 and Soil Sample Analytical Results 0 WS19 TCE (µg/kg) ND TCE 5 VOC axis (µg/kg) A plot of the WS19 XSD log with the 10 results of the soil sample analyses. The maximum XSD detector response is about 1.2E5 µV above baseline and highest soil concentrations are just below 0.5ppm. There is good Depth (ft) 15 correspondence between the XSD detector log and the TCE concentrations observed in the soil samples. These results indicate that TCE at the 100 µg/kg level in soil may be readily 20 detected at this site with the MIP-XSD system. 25 30 100 300 500 µg/kg 2.0E+04 6.0E+04 1.0E+05 1.4E+05 XSD (µV) 8
  • 9. XSD Logs: Mid-Low X-VOC 0 WS19 WS20 5 WS21 TCE (µg/kg) ND TCE VOC axis (µg/kg) 10 A plot of all 3 XSD logs obtained at this location along with the TCE soil sample results. Again, Depth (ft) 15 generally good correspondence between soil sample analytical results and the XSD logs, some variation observed between logs. 20 Note, TCE was the primary contaminant observed at this location. See data table above. 25 30 100 300 500 µg/kg 2.0E+04 6.0E+04 1.0E+05 1.4E+05 XSD (µV) 9
  • 10. Summary for WS19 Low Level X-VOC Location • The MIP-XSD system can detect trichloroethene (TCE) in the 100mg/kg to 500mg/kg concentration range in soil when maintained and operated properly. Lower detection limits may be possible under good field and optimized MIP-XSD system operating conditions. • Replicate MIP logs with the XSD detector show generally good correspondence in detector response for moderate to low level TCE. • Dual tube DT325 soil sampling was used to collect soil cores across the zone of positive detector response. • Good correspondence is observed between the XSD detector responses and the TCE analytical results for the soil samples. • The soil TCE results are low or nondetect over the zones where the MIP-XSD system displays little or no response above the baseline. • The soil TCE results are positive detect over the interval where the MIP detectors show clear response in the replicate logs. • Soil coring and sub-sampling techniques for volatiles analysis can have a substantial impact on the analytical results as well as the correspondence between MIP results and soil sample results. • It is also important to collect the soil cores in close proximity (spatially and chronologically) to the MIP logs to get a good correlation between the MIP log and analytical results. 10
  • 11. To learn more about the MIP system visit www.geoprobe-di.com MIP System Specifications for this Study: Probe: Combined MIP-HPT Probe, PN MK6530 GC and Detectors: SRI Model 310C GC equipped with XSD detector, 10.6eV PID and FID detectors MIP Controller Model MP6505 Field Instrument Model FI6000 Carrier Gas: N2 at 40ml/min Trunkline equipped with an unheated 1/16” OD x 0.04” ID stainless steel return gas line 11