1. Evalua&on
of
the
Southwest
Alaska
Network
Nearshore
Monitoring
Program:
Synthesis,
analysis,
and
insight
from
the
first
5-‐years
Heather
A.
ColeD1,
Kim
A.
Kloecker2,
James
L.
Bodkin2,
and
Thomas
A.
Dean3
1-‐
NPS,
SWAN,
2-‐
USGS
Cooperator,
3-‐
CRA,
Cooperator
Acknowledgements:
The
Na&onal
Park
Service,
SWAN,
KATM,
KEFJ
and
the
USGS
Alaska
Science
Center
supported
this
work.
We
would
like
to
thank
Bill
Thompson
of
SWAN
NPS
for
his
con&nued
technical
support;
Alan
BenneV,
Michael
Shephard,
and
Dorothy
Mortenson
of
SWAN
NPS
for
their
support.
We
would
like
to
recognize
the
excep&onal
coopera&on
by
the
staff
of
KATM,
KEFJ
and
SWAN
and,
in
par&cular,
Meg
Hahr
(KEFJ)
for
her
field
assistance
as
well
assistance
in
acquiring
permits,
ClaudeVe
Moore
(SWAN)
for
her
field
assistance
and
logis&cal
support,
Ralph
Moore
(KATM)
for
his
field
assistance
and
Daniel
Noon
(KATM)
for
his
assistance
in
obtaining
NPS
permits.
This
work
could
not
have
been
completed
without
the
field
assistance
of
Allan
Fukuyama,
George
Esslinger,
and
Ashley
ColeD.
We
also
thank
Greg
Snedgen
and
George
Esslinger
for
their
skilled
opera&on
of
the
R/V
Alaskan
Gyre
in
KEFJ
and
KATM.
Future
Goals
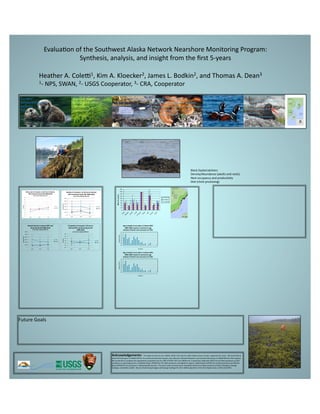
0
1000
2000
3000
4000
5000
6000
2008
2009
2010
Density
(#/m2)
Density
of
mussels
≥
to
20
mm
in
Katmai
NPP
and
Kenai
Fjords
NP
2008-‐2010
(error
bars
indicate
95%
CI)
KEFJ
KATM
0
10000
20000
30000
40000
50000
60000
2008
2009
2010
Density
(#/m2)
Mussel
density
in
Katmai
NPP
and
Kenai
Fjords
NP
2008-‐2010
(error
bars
indicate
90%
CI)
KEFJ
KATM
0.00
0.10
0.20
0.30
0.40
0.50
0.60
2008
2009
2010
ProporNon
ProporNon
of
mussels
≥
20
mm
in
Katmai
NPP
and
Kenai
Fjords
NP
2008-‐2010
(error
bars
indicate
90%
CI)
KEFJ
KATM
0.00
0.02
0.04
0.06
0.08
0.10
0.12
0.14
0.16
0
1
2
3
4
5
6
7
8
9
10
11
12
13
14
15
16
17
18
19
20
ProporNon
of
total
Age
(years)
Age
at
death
of
sea
oPers
in
Katmai
NPP,
2006-‐2009,
based
on
cementum
age
analysis
of
beach-‐cast
carcasses
(n=130).
0.00
0.02
0.04
0.06
0.08
0.10
0.12
0.14
0.16
0
1
2
3
4
5
6
7
8
9
10
11
12
13
14
15
16
17
18
19
20
ProporNon
of
total
Age
(years)
Age
at
death
of
sea
oPers
in
Katmai
NPP,
2006-‐2009,
based
on
cementum
age
analysis
of
beach-‐cast
carcasses
(n=130).
Black
Oystercatchers:
Density/Abundance
(adults
and
nests)
Nest
occupancy
and
produc&vity
Diet
(chick
provisiong)
Sea
oVer
Density/Distribu&on
Mortality
Diet
Kelps
and
seagrasses
Special
composi&on
Distribu&ons
Abundance
Marine
water
chemistry
Temperature
Contaminants
Inter&dal
invertebrates:
Rocky
and
soh
sediment
Habitats
Focus
species:
mussels,
clams,
limpets
Species
composi&on
Abundance/Density
Sizes
Trends
Marine
bird
and
mammals:
Species
composi&on
Distribu&on
Density
Trends
Black
Oystercatchers:
Density/Abundance
(adults
and
nests)
Nest
occupancy
and
produc&vity
Diet
(chick
provisiong)