1. An Integrated Study of Caribou Hunting in Noatak National
Preserve, Alaska
Western Arctic National Parklands
National Park Service
U.S. Department of Interior Resource Brief
To learn more about Noatak National Preserve nature & science visit: http://www.nps.gov/noat/index.htm
Western Arctic National Parklands, PO Box 1029, Kotzebue, AK 99752
In 2012 Western Arctic National Parklands
hired a social scientist with expertise in visi-
tor monitoring, geographical information
systems, and recreation ecology to assist
the park with data gathering and analysis
related to a long-standing user conflict issue
in Noatak Preserve. The preserve provides
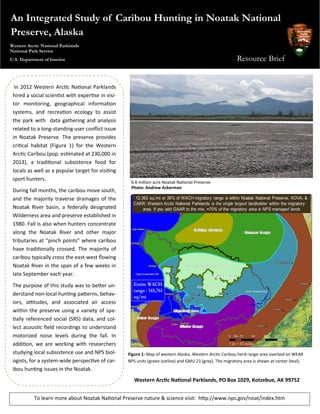
critical habitat (Figure 1) for the Western
Arctic Caribou (pop. estimated at 230,000 in
2013), a traditional subsistence food for
locals as well as a popular target for visiting
sport hunters.
During fall months, the caribou move south,
and the majority traverse drainages of the
Noatak River basin, a federally designated
Wilderness area and preserve established in
1980. Fall is also when hunters concentrate
along the Noatak River and other major
tributaries at “pinch points” where caribou
have traditionally crossed. The majority of
caribou typically cross the east-west flowing
Noatak River in the span of a few weeks in
late September each year.
The purpose of this study was to better un-
derstand non-local hunting patterns, behav-
iors, attitudes, and associated air access
within the preserve using a variety of spa-
tially referenced social (SRS) data, and col-
lect acoustic field recordings to understand
motorized noise levels during the fall. In
addition, we are working with researchers
studying local subsistence use and NPS biol-
ogists, for a system-wide perspective of car-
ibou hunting issues in the Noatak.
6.6 million acre Noatak National Preserve
Photo: Andrew Ackerman
Figure 1: Map of western Alaska. Western Arctic Caribou herd range area overlaid on WEAR
NPS units (green outline) and GMU 23 (grey). The migratory area is shown at center (teal).
Noatak National PreserveNoatak National Preserve
Kobuk Valley NPKobuk Valley NP
2. Background and Managing the ‘Issue”
Since federal designation in 1980, Noatak Preserve has slowly gained recognition as a premier wilderness destination and one of the best big
game hunting locations in the world. However, because the non-local presence (“non-locals” include Alaska residents not from local villages) in
the area prior to 1980 was very low and the traditional hunters from villages such as Noatak, Kivalina, and Kotzebue had a long history of rela-
tively exclusive access to traditional caribou hunting grounds, any amount of ‘outside’ interference or disruption, either perceived or real, was
likely to be seen by locals as negative. When big game sport hunters and recreationalists’ demand for convenient access to/from the preserve
increased in the 1980s, a new commercial opportunity arrived in the region—big game air transporters and air taxis. Bush planes are able to ac-
cess remote areas of the preserve from Kotzebue in an hour or less, and are capable of landing and taking-off on small gravel bars or float ponds,
making access to even the most remote areas of the preserve possible.
Local concern over the growing activity in the Noatak basin resulted in a study by ADFG Subsistence in 1987 and an eventual rule to prohibit air
access for hunters within 5 miles, either side, of the lower Noatak River during the fall, those areas being common hunting sites of locals. This
became the Unit 23 Noatak Controlled Use Area. Over the ensuing two decades (1990-2010) non-local hunting and associated commercial air
access has slowly, but steadily, increased. With increasing use managers have responded by extending the CUA east 80 river miles inside Noatak
Preserve and making the closure 45 days long. However, with the exception of an attempt at counting overflights by NPS rangers at the Kelly Riv-
er in 1995 and a 2007 BLM-sponsored survey of sport and local hunters to the Squirrel River area, by 2012, Noatak managers still did not have
consistent or multi-year datasets with which to understand transporter aircraft and hunting use patterns, hunter behaviors or harvest numbers,
hunter knowledge or information on hunting experience, issues, or potential management strategies.
Objectives, Methods, and Resulting Datasets
Early on it was determined the data would need to be spatially relatable. Much
of the conflict revolved around overlapping use areas and movements of air-
craft, boats, and caribou. Objectives therefore, were to:
Compile & analyze transporter 2009-13 records & create spatial layers
Conduct mail-survey of 2010-13 hunters to gain descriptive and evaluative
information about hunting and use for overlay spatial analysis with trans-
porter landings, caribou locations, or Noatak TEK data
Establish baseline noise metrics and daily trends at various locations, initi-
ate multi-year acoustic monitoring effort a) at locations under various man-
agement frameworks; b) spanning the fall hunting period; and 3) at loca-
tions where we could capture sounds of motorized aircraft and watercraft
Map seasonal herd movements and migration timing in relation to hunter
concentrations and associated noise impacts
Methods followed objectives. For 2009-13 we transcribed 700+ transporter trip
records (1,800+ hunters) into a relational MS Access database. Landings loca-
tions were used to create a layer in ArcMap 10.2; Working with Dr. Pete Fix, a
mail-survey was sent to hunters from 2010-13 and 380 responded. Data was
analyzed (SPSS), summarized, and camps were digitized; we used regional NPS
expertise to assist with acoustic monitors during Aug-Sept 2013, and two more
in mid-Sept through Oct 2014. This effort resulted in continuous acoustic re-
cordings between the middle of August and first week of October at three loca-
tions in the preserve, two of which were near the Noatak River. We overlaid
caribou gps data with our SRS data in GIS to identify coinciding patterns of use
and potential ‘hotspots’ (see figure 2). Acoustic monitor and float plane on the Noatak River, 2013
Photo: Andrew Ackerman
Figure 2: Data types, sample periods, and integration
3. For more information contact:
Andrew Ackerman
Social Scientist
Western Arctic National Parklands
Preview of Results
Figure 3: Example data summary from NPS Transporter database
Figure 5: Side-by-side comparison of noise levels for various sources at two sites on Noatak River, 2014
More boats
than props
Information Received by Noatak Sport Hunters Comparing Resident/Non-residents
Figure 4: Example of Sport Hunt Survey response data