Dia Diagram Editor is free Open Source drawing software for Windows, Mac OS X and Linux. Dia supports more than 30 different diagram types like flowcharts, network diagrams, database models.
Call for Papers - International Journal of Intelligent Systems and Applicatio...
SOFTWARE ENGINEERING FILE IN SLIDESHARE
1. Teacher’s Signature
PROGRAM-1
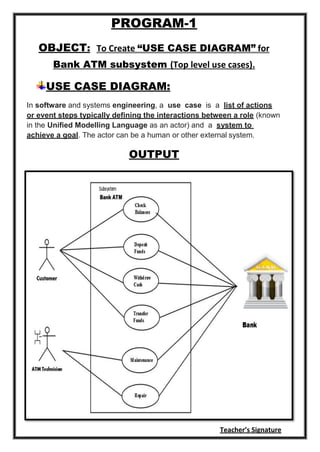
OBJECT: To Create “USE CASE DIAGRAM” for
Bank ATM subsystem (Top level use cases).
USE CASE DIAGRAM:
In software and systems engineering, a use case is a list of actions
or event steps typically defining the interactions between a role (known
in the Unified Modelling Language as an actor) and a system to
achieve a goal. The actor can be a human or other external system.
OUTPUT
2. Teacher’s Signature
PROGRAM-2
OBJECT: To Create a “SEQUENCE DIAGRAM” for
Making a call or a telephone conversation.
SEQUENCE DIAGRAM:
In software engineering , a sequence diagram (SSD) is a sequence
diagram that shows, for a particular scenario of a use case, the events
that external actors generate, their order, and possible inter-system
events.
OUTPUT
3. Teacher’s Signature
PROGRAM-3
OBJECT: To Create “UML ACTIVITY DIAGRAM”
for an “Order Processing” .
UML ACTIVITY DIAGRAM:
(Unified Modelling Language Activity diagram)
An activity diagram portrays the control flow from a start point to a
finish point showing the various decision paths that exist while the
activity is being executed. We can depict both sequential processing
and concurrent processing of activities using an activity diagram.
OUTPUT
4. Teacher’s Signature
PROGRAM-4
OBJECT: To Create “STATE CHART DIGRAM” for
online Railway Reservation System.
STATE CHART DIGRAM:
A state diagram, also called a state machine diagram or state chart
diagram, is an illustration of the states an object can attain as well as
the transitions between those states in the Unified Modeling Language
(UML)
OUTPUT
5. Teacher’s Signature
PROGRAM-5
OBJECT: To Create “COLLABORATION
DIAGRAM” of an order managementsystem.
COLLABORATION DIAGRAM:
A collaboration diagram, also called a communication diagram or
interaction diagram, is an illustration of the relationships and
interactions among software objects in the Unified Modeling Language
(UML).
OUTPUT
6. Teacher’s Signature
PROGRAM-6
OBJECT: To Create “DEPLOYMENT DIAGRAM”
for “LIBRARY MANAGEMENT SYSTEM UML
COMPONENT DIAGRAM”.
DEPLOYMENT DIAGRAM :
Deployment diagram is a structure diagram which shows architecture
of the system as deployment (distribution) of software artifacts
to deployment targets. It is employed when we need to deploy the
application we developed. A single deployment diagram is possible for a
single system.
OUTPUT
7. Teacher’s Signature
PROGRAM-7
OBJECT: To Create a “COMPONENT DIAGRAM”
for “library management system”.
COMPONENT DIAGRAM:
Component diagram is a special kind of diagram in UML. Component
diagrams are used to visualize the organization and relationships
among components in a system. These diagrams are also used to make
executable systems.
OUTPUT
8. Teacher’s Signature
PROGRAM-8
OBJECT: To Design a “STATE CHART DIAGRAM”
for an A.T.M. SIMULATOR .
STATE CHART DIAGRAM :
A state diagram, also called a state machine diagram or state chart
diagram, is an illustration of the states an object can attain as well as
the transitions between those states in the Unified Modeling Language
(UML).
OUTPUT
9. Teacher’s Signature
PROGRAM-9
OBJECT: To Design a “CLASS DIAGRAM” of
“HOSPITAL MANAGEMENT SYSTEM”.
CLASS DIAGRAM :
A class diagram is an illustration of the relationships and source
code dependencies among classes in the Unified Modeling
Language (UML). In this context, a class defines the methods and
variables in an object, which is a specific entity in a program or the unit
of code representing that entity.
OUTPUT