CASE STUDY: BUSINESS
CONTINUITY MANAGEMENT
COCOA-SASSAFRAS CORPORATION
ASSIG NME NT OVERVIEW
Summary: As a team, students should present their proposed solution to the case. Your
presentation should lay out clear recommendations for how management should
address the problem.
Presentation
Deliverable1:
Case study presentation (in Microsoft PowerPoint format).
Executive Briefing
Deliverable:
Single page case study executive briefing (in Microsoft PowerPoint format).
BACKGRO UND
Hurricane Sandy caused significant damage to major businesses across the United States. Cocoa-
Sassafras Corporation (CSC), a large company operating in the food and beverage industry was affected
by the incident. Some of the major products of Cocoa-Sassafras include chocolate, candies, snacks and
coffee. Headquartered in Oak Brook (an industrial campus on the outskirts of Chicago), Illinois, Cocoa-
Sassafras has manufacturing plants, distribution centers and data centers through-out the US, Canada and
Mexico. But the real damage was cause to CSC’s major distribution center and a data center in the
northeast region where the hurricane hit. While the impact to the New Jersey distribution center was
contained, the Business Continuity (BC) and Disaster Recovery (DR) managers were requested to evaluate
the company’s business risks related to potential disasters in their various facilities and the level of
preparedness to respond to and recover from these disasters. CSC would like your team to prepare a
business case for the Chief Risk Office and BC DR executive steering committee to increase investment in
Cocoa-Sassafras’s Business Continuity and Disaster Recovery initiatives.
COCO A – S ASS AFR AS CORPORAT IO N
Cocoa-Sassafras Corporation (CSC) is a US-based food and beverage company. Their products include:
chocolate, candy, snacks, baking products, coffee, fruit drinks and soda. Two years ago, CSC acquired
Snack World Inc., a medium-sized food company, whose main products are: potato chips, tortilla chips,
dried vegetable chips and seeds. This resulted in a new division within the CSC organization named
“Snacks”.
1 Presentation Deliverables are due only if your team is assigned this case. All others should read the case and complete the
Executive Briefing Deliverable assignment.
Professors Matt Stoltz and Meera Kesari Case Study: BCM (Cocoa-Sassafras)
Page 2 Master of Science in Information Systems: IT Governance, Risk and Controls (IT GRC)
In last year’s filing, CSC reported $3 billion in revenue. The biggest share of the product revenue came
from chocolate and snacks. Please see the chart below for distribution of revenue amongst different
divisions. Exhibit one also contains CSC’s financial statements for the past three years.
Since the acquisition, the company has operated two main data centers; one is located in Illi ...
CASE STUDY BUSINESS CONTINUITY MANAGEMENT COCOA-SASSA.docx
1. CASE STUDY: BUSINESS
CONTINUITY MANAGEMENT
COCOA-SASSAFRAS CORPORATION
ASSIG NME NT OVERVIEW
Summary: As a team, students should present their proposed
solution to the case. Your
presentation should lay out clear recommendations for how
management should
address the problem.
Presentation
Deliverable1:
Case study presentation (in Microsoft PowerPoint format).
Executive Briefing
Deliverable:
Single page case study executive briefing (in Microsoft
PowerPoint format).
BACKGRO UND
Hurricane Sandy caused significant damage to major businesses
2. across the United States. Cocoa-
Sassafras Corporation (CSC), a large company operating in the
food and beverage industry was affected
by the incident. Some of the major products of Cocoa-Sassafras
include chocolate, candies, snacks and
coffee. Headquartered in Oak Brook (an industrial campus on
the outskirts of Chicago), Illinois, Cocoa-
Sassafras has manufacturing plants, distribution centers and
data centers through-out the US, Canada and
Mexico. But the real damage was cause to CSC’s major
distribution center and a data center in the
northeast region where the hurricane hit. While the impact to
the New Jersey distribution center was
contained, the Business Continuity (BC) and Disaster Recovery
(DR) managers were requested to evaluate
the company’s business risks related to potential disasters in
their various facilities and the level of
preparedness to respond to and recover from these disasters.
CSC would like your team to prepare a
business case for the Chief Risk Office and BC DR executive
steering committee to increase investment in
Cocoa-Sassafras’s Business Continuity and Disaster Recovery
initiatives.
COCO A – S ASS AFR AS CORPORAT IO N
3. Cocoa-Sassafras Corporation (CSC) is a US-based food and
beverage company. Their products include:
chocolate, candy, snacks, baking products, coffee, fruit drinks
and soda. Two years ago, CSC acquired
Snack World Inc., a medium-sized food company, whose main
products are: potato chips, tortilla chips,
dried vegetable chips and seeds. This resulted in a new division
within the CSC organization named
“Snacks”.
1 Presentation Deliverables are due only if your team is
assigned this case. All others should read the case and complete
the
Executive Briefing Deliverable assignment.
Professors Matt Stoltz and Meera Kesari Case Study: BCM
(Cocoa-Sassafras)
Page 2 Master of Science in Information Systems: IT
Governance, Risk and Controls (IT GRC)
In last year’s filing, CSC reported $3 billion in revenue. The
biggest share of the product revenue came
from chocolate and snacks. Please see the chart below for
4. distribution of revenue amongst different
divisions. Exhibit one also contains CSC’s financial statements
for the past three years.
Since the acquisition, the company has operated two main data
centers; one is located in Illinois, within the
same industrial campus as corporate and the second one is
located in Philadelphia, PA. The latter is Snack
World’s original data center, which now also serves as an
alternate disaster recovery site for the Illinois
data center for CSC. Since the acquisition, CSC maintains two
ERP systems: legacy CSC runs on SAP
and Snack World operates on JD Edwards. While most corporate
modules have been migrated into SAP,
JD Edwards still handles the manufacturing and supply chain
modules for the Snacks division. The table
below is a location chart for CSC’s main manufacturing plants
and distribution centers:
Manufacturing Plants Distribution Centers
Plano, TX
Main Snack W orld plant
Amarillo, TX
5. Snack W orld plant
Large Sized Compton, CA
Terrell, TX
Cranbury, NJ
Ft Pierce, FL
Vancouver, Canada
Oak Brook, IL
CSC chocolate and coffee plant
Deerfield , IL
CSC chocolate and baking products plant
Medium Sized Aurora, CO
Eugene, OR
Oak Brook, IL
Toronto, Canada
Tulsa, OK
CSC soda, drinks and candy plant
Small Sized Tucson, AZ
Boise, ID
Chocolate
37%
6. Snacks
25%
Coffee
14%
Soda and Drinks
14%
Candy
7%
Baking
2%
Other
1%
Current Year Revenue (by product line)
Professors Matt Stoltz and Meera Kesari Case Study: BCM
(Cocoa-Sassafras)
Page 3 Master of Science in Information Systems: IT
Governance, Risk and Controls (IT GRC)
Manufacturing Plants Distribution Centers
Bentonville, AR
7. CSC soda and drinks plant
Wichita, KS
CSC candy plant
Newbury, MA
North Platte, NE
Anderson, SC
Bessemer, AL
Saskatoon, Canada
Mexico City, Mexico
Monterrey, Mexico
San Juan, Puerto Rico
BUS INESS CONT INUIT Y AND DIS AST ER RECOVERY
In the past, the Business Continuity (BC) and Disaster Recovery
(DR) planning had been ad hoc activities
performed in silos by the different divisions. Through an audit
performed six months ago, the Business
Continuity and Disaster Recovery Program was re-initiated and
formalized within CSC. The Chief Risk
Officer (CRO) was given the accountability for the BC and DR
8. Program. Since his appointment, he has
formed a BC DR executive steering committee, with
representation from the different business divisions,
corporate and IT. This committee provides governance and
overall direction to the BC and DR program. In
the first committee meeting, the members defined the objectives
of the BC and DR program as:
1. Keep employees safe.
2. Keeping CSC products available and on the shelf.
3. Keep critical supplier, employee and client data secure.
As one of their first work orders, the steering committee created
a Business Continuity Management (BCM)
framework (please see Exhibit One). The framework proposes
the lifecycle of a BCM program and has
been developed to guide the structure of the overall program.
The CRO hired a BC Director and DR Manager to manage the
day-to-day activities of the program. The
BCM framework will be leveraged (as applicable) by the BC
Director and DR Manager to implement the
objectives of the program. Below are three initiatives that the
BC Director and DR Manager have completed
9. or started in the past quarter:
1. BUSINESS CONTINUITY PREPAREDNESS
Site risk assessments have been conducted in the larger
manufacturing plants and delivery centers.
Threats of natural disasters (e.g. tornadoes, snowstorms, etc.)
and man made threats (e.g. proximity to the
airport/chemical plant, etc.) in the respective geographic
regions have been analyzed.
A Business Impact Analysis (BIA) was conducted three years
ago on select business divisions (Chocolate,
Coffee and Baking Products). However, a BIA has not been
conducted since the acquisition of Snack
World. The outdated BIA results identified that highest
financial impacts are caused by disruptions to the
following areas of the business:
distribution centers, from the
distribution centers to the delivery branches, and from the
delivery branches to the clients.
10. Professors Matt Stoltz and Meera Kesari Case Study: BCM
(Cocoa-Sassafras)
Page 4 Master of Science in Information Systems: IT
Governance, Risk and Controls (IT GRC)
the procurement (of supplies to make
the products) and manufacturing of the products themselves.
The BIA also identified which products would have the most
negative impact to CSC’s brand image if they
were not available to the clients and their customers. In
addition, the BIA identified their peak season
between the months of October and April (starting with the
Halloween season through Easter). Through the
BIA, the key dependencies in people, process and technology
were identified and a recovery prioritization
was defined.
From the manufacturing side, the plant managers have defined a
BC plan for a number of manufacturing
plants to have a split-production recovery strategy should one
facility have a disaster. Typically,
manufacturing plants have available capacity that enables a
11. plant to ramp up production levels for specific
products and absorb another facility’s load. For example: the
Tulsa plant can absorb the Wichita candy
plant’s load. There are also plants that manufacture different
products but have similar equipment and
ingredients. In this case, one plant’s processes can be
transported to another plant, with or without some
modifications, to enable continuous product manufacturing. For
example, the Oakbrook plant, with some
modifications to its chocolate production lines, can absorb the
Deerfield baking product plant’s load.
As a requirement for each facility, facility managers have
defined and built pandemic plans. The pandemic
plan defines the action plan to address a significant loss of
people (due to illness, injury or unforeseen
circumstances) for an extended period of time.
2. IT PREPAREDNESS
Currently, the two data centers are not integrated. However, the
IT resources working at the two data
centers have been cross-trained to support applications and
infrastructure in both data centers.
The Philadelphia data center is the primary recovery site for the
Illinois data center and the maximum
12. acceptable recovery time for the SAP system is 14 days in the
event of a disaster. However, there has not
been any testing performed to validate the ability to fully
recover the SAP system in 14 days.
Based on the BIA, five days without SAP would result in
significant adverse impacts to CSC’s revenue. A
system downtime of SAP for five days could potentially result
in a 10% loss in revenue for CSC. Moreover,
this would result in several legal ramifications. Similar sized
companies who have not effectively recovered
from disasters have been known to be targets of large lawsuits –
in some cases class action lawsuits. Apart
from all the above, ineffective disaster recovery would tarnish
their brand image.
CSC is looking not just to improve recoverability but also to
build more resilience into its systems. The BC-
DR steering committee is looking into cloud as a means to
strengthen Business Continuity and IT
Preparedness. Cloud-based solutions will also offer CSC
options to integrate the data centers or allow for
real-time fail-over capabilities. Currently, the committee has
identified the following concerns and
considerations with the cloud strategy:
13. 1. Costs vs. value for moving to cloud
2. Hybrid (on premise and cloud) vs. complete cloud approach
3. Required design changes (for example, automation of certain
applications) to ensure that cloud
solutions can be implemented
Professors Matt Stoltz and Meera Kesari Case Study: BCM
(Cocoa-Sassafras)
Page 5 Master of Science in Information Systems: IT
Governance, Risk and Controls (IT GRC)
3. SUPPLY CHAIN CONSIDERAT IONS
CSC is looking to hedge the risks associated with its suppliers
and plans to account for potential supply
chain failures or disruptions in its business continuity plans.
The steering committee would like the new BC
Director and DR Manager to be involved in the procurement
process.
A majority of CSC’s suppliers for its raw ingredients include
cocoa and coffee farmers in South America
and potato growers in the Midwest. Although hurricanes do not
14. occur in South America, there has been
some political unrest in the coffee and cocoa farms that supply
to CSC. Worker strikes in Nicaragua, where
CSC gets majority of its coffee beans, has led to a 15% decrease
in the country’s overall coffee production
and many farmers abandoned their land and their crops.
Meanwhile, CSC also has coffee and cocoa
suppliers in Costa Rica, Guatemala and Colombia.
Back in the states, many of CSC’s corn supply comes from the
western and eastern Corn Belt region of the
Midwest. Currently, Midwest farmers face an agricultural
production challenge because of the tornadoes
that hit the region during the late spring and early summer
months. Strong thunderstorms produced large
hail and damaging winds to many crops. The heavy rainfall and
localized flooding soaked soils that caused
planting delays.
The industry in which CSC operates is highly competitive and
every minute that its products are not on the
shelves means that CSC is losing market share. In some cases, if
CSC leaves the shelf space empty for
too long (1-2 days), a store chain may decide to: temporary fill
it with other products, permanently fill it with
15. other products or drop the CSC brand altogether.
KEY ST AKE HOLDERS
JOHN SMALLING, CHIEF RISK OFFICER
John Smalling is the Chief Risk Officer of Cocoa-Sassafras
Corporation. John has overall responsibility for
the Legal, Compliance, and Supervision departments of CSC.
His responsibilities include design and
implementation of processes to identify and mitigate legal,
regulatory, and all other risks facing CSC. He
has over 20 years of experience in the domain of organizational
risk.
John played a significant role in the acquisition of Snack World.
He lead a team conducting due diligence
of Snack World’s IT Controls. This was instrumental in
providing support to a different team working with
CSC’s CFO conducting financial due diligence. Being close to
retirement, John believes this will be a
significant portion of his legacy at the company.
Prior to joining CSC, John was the Senior Vice President in
Corporate Risk at Royal Automotive, a car parts
manufacturer with offices nationwide. Before that, he was in
Risk Advisory with a Big 4 firm in Detroit, MI.
John holds a B.S. in Finance from Arizona State University and
16. M.B.A. and J.D. degrees from the University
of Denver.
KATIE PENA, BUSINESS CONTINUITY DIRECTOR
Katie has worked at CSC for a little less than a year. She has
been a business continuity practitioner for 7
years. She started her career in consulting as a business
continuity management advisor for Fortune 500
companies. During her time in consulting, she assisted clients in
the review and enhancement of business
continuity management programs, development of Crisis
Management plans and facilitation of Business
Professors Matt Stoltz and Meera Kesari Case Study: BCM
(Cocoa-Sassafras)
Page 6 Master of Science in Information Systems: IT
Governance, Risk and Controls (IT GRC)
Impact Assessments (BIA). She has also received a Certified
Business Continuity Professional (CBCP)
certification from the Disaster Recovery Institute International.
Before joining consulting, Katie received an undergraduate
degree from Florida State University. She
17. majored in Business Process Management.
JAMES MILLER, DISAST ER RECOVERY MANAGER
James has 2 years of experience in Disaster Recovery. Before
joining CSC six months ago, he was an
Enterprise Architect in another food and beverage company for
10 years. In his previous company, James
had the responsibility of developing and testing the disaster
recovery plan for the company’s ERP system.
It was for this kind of experience that John hired him into CSC.
James is a Certified Enterprise Architect (CEA) and Certified
Information Security Manager (CISM). He
graduated from University of North Carolina with a major in
Informatics.
LE ARNING T HE LESSONS OF T HE PAST
The Hurricane impacted operations for almost two days since a
number of employees were unable to go
to work due to the effects of the storm. This caused the
distribution center to operate at 65% efficiency. The
pandemic plan was activated and the distribution center was
back to normal operations after 40 hours.
Based on outdated BIA results, if the New Jersey distribution
center had been affected and was out of
commission for three days, it would have had a big impact on
18. the CSC market in the Northeast region.
Similarly, if the New Jersey distribution center were only 50%
operational, the market impact would be
evident in 7 days.
On the IT side, the hurricane did not affect the Philadelphia
data center. However, it became apparent that,
should the Philadelphia data center go down, no provisions
would be made to recovery the JD Edwards
suite at the Illinois data center. As far as the CIO is concerned,
their manufacturing and supply chain
logistics for Snack World will remain on JD Edwards for next
12 months, until a full assessment of a possible
migration has been completed.
CSC’s supply chain for raw ingredients is critical to the firm
meeting its targets. Due to political unrest,
extreme weather and other regional issues, the suppliers have
been facing challenges.
Katie and James have approached you to seek assistance in
developing the business case for the CRO to
fund BC and DR investments.
YO UR T ASK FOR T HIS C ASE – PRESENT ING T E AMS
BUS INESS CASE
19. You have been invited by Katie, the Business Continuity
Director and James, the Disaster Recovery
Manager to develop the business case to initiate and fund a
series of Business Continuity and Disaster
Recovery projects. After the incident surrounding Hurricane
Sandy, both Katie and James want to ensure
CSC is prepared and has the ability to respond and recover from
disasters that may impact the company’s
operations. When preparing your business case for the CRO and
the executive steering committee to
approve and fund, please consider the following:
Professors Matt Stoltz and Meera Kesari Case Study: BCM
(Cocoa-Sassafras)
Page 7 Master of Science in Information Systems: IT
Governance, Risk and Controls (IT GRC)
1. What risks did you identify?
2. How would you conduct the BIA (Business Impact
Assessment)?
e?
in the BIA.
20. of a disruption to CSC’s business.
3. What potential recovery options would you present to reduce
the impacts of a disruption and ensure
recoverability of manufacturing plants and delivery centers? Be
sure to propose realistic RPOs and
RTOs.
4. What resiliency options would you present for the data
centers and the ERP systems?
5. What solutions would you recommend to mitigate supply
chain risks associated with coffee and
cocoa farmers in South America and potato farmers in the
Midwest?
6. How would you use the results of the site risk assessment and
BIA, along with the available
recovery options, to mitigate the risks and improve resilience
with limited funds available for
Business Continuity and Disaster Recovery?
7. How would you ensure that the IT and resource capabilities
can support the solutions provided
above?
When preparing the case, please ensure that the solution(s) you
propose tie in with the risks and impact
21. assessment criteria identified. You will be presenting to John,
Katie and James. Please ensure that you
carefully consider their roles and account for their backgrounds
while framing your presentation.
You have been asked for a lot of detailed information to solve
this case. The trick will be to package this up
into a digestible executive presentation your audience can
understand. Detailed supporting information can
be included in an exhibit in the appendix of your presentation.
Your case study solution should also include:
appendix.
inform your solution.
A few tips and tricks for solving this case:
Be sure to state your assumptions
in an exhibit in your appendix. Your assumptions should not
significantly alter the facts of the case;
rather, they should support the recommendations by filling in
the missing pieces of information in
22. the case.
the other standards. The key is to use
the standards to help you solve the case. Remember: standards
are NEVER the answer on their
own; they must be applied to the business problem.
classes. For example, please
incorporate lessons from your IT strategy and case analysis
class. This will be critical to your
success in all your MSIS classes.
Professors Matt Stoltz and Meera Kesari Case Study: BCM
(Cocoa-Sassafras)
Page 8 Master of Science in Information Systems: IT
Governance, Risk and Controls (IT GRC)
YO UR T ASK FOR T HIS C ASE – ALL OT HE R T EAMS
CASE ST UDY EXECUT IVE BRIEF ING
With the volatile environmental conditions surrounding CSC’s
data centers, Katie Pena (Business
23. Continuity Director) and James Miller (Disaster Recovery
Manager) is expected to present a one-slider to
the members of the Executive Committee (i.e.: C-suite) to
promote discussion / insights around the planned
business continuity and disaster recovery approaches. Your task
is to provide Katie and James with a single
slide depicting the following:
approaches for protecting CSC’s data
centers.
faced when
managing and sustaining business continuity
and disaster recovery.
Professors Matt Stoltz and Meera Kesari Case Study: BCM
(Cocoa-Sassafras)
Page 9 Master of Science in Information Systems: IT
Governance, Risk and Controls (IT GRC)
APPE NDIX
24. EXHIBIT ONE : COCO A-S ASS AFRAS PROPOSED BC-DR
PROGRAM L IFECYCLE
Professors Matt Stoltz and Meera Kesari Case Study: BCM
(Cocoa-Sassafras)
Page 10 Master of Science in Information Systems: IT
Governance, Risk and Controls (IT GRC)
EXHIBIT T WO: COCOA-S ASS AFR AS F INANCI AL ST
AT EME NT S
THREE YEAR SUMMARY OF SELECTED FINANCIAL DATA
(in thousands, except per share data and other information)
Current Year Last Year The Year Before
Statements of Operations Data:
Net sales $4,135,801 $2,853,238 $2,690,361
Gross profit 761,859 548,275 509,426
Restructuring and other charges, net -924 -63,977 78
Gain (loss) on divestiture 242 -7,223
Income from operations 117,542 39,215 105,837
25. Interest expense, net -38,306 -33,275 -33,940
Income before income taxes and cumulative effect of
changes in accounting principles
87,094 9,848 74,824
(Provision) benefit for income taxes -12,286 -1,857 -18,001
Income before cumulative effect of changes in
accounting principles
74,808 7,991 56,823
Net income (loss) 74,808 -2,799 -68,782
Basic earnings (loss) per share (a)(c):
Income before cumulative effect of changes in
accounting principles
1.82 0.20 1.44
Net income (loss) 1.82 0.07 (1.75)
Diluted earnings (loss) per share : Income before
cumulative effect of changes in accounting principles
1.79 0.20 1.43
Net income (loss) $1.79 $(0.07) $(1.73)
Weighted average common shares and common
26. equivalents outstanding:
Basic 37,663 27,779 27,546
Diluted 38,168 28,144 27,839
Cash dividends per share $0.73 $0.42 $0.42
Capital expenditures 75,832 59,293 48,693
Depreciation and amortization of property, plant, and
equipment
68,818 48,993 43,517
Amortization of deferred charges, intangibles, and
goodwill
4,163 2,776 1,938
Balance Sheet Data:
Working capital 368,460 247,923 292,315
Total assets 2,760,551 1,910,876 1,792,642
Long-term debt 500,195 407,419 432,757
Stockholders' equity $805,917 $543,480 $477,970
Other information:
Employees 21,274 15,610 15,960
27. Backlog (in thousands) $1,072,171 $718,615 $649,949
Total debt as a percent of total capital 35% 31% 34%
Current ratio 1.22 0.95 1.03
Professors Matt Stoltz and Meera Kesari Case Study: BCM
(Cocoa-Sassafras)
Page 11 Master of Science in Information Systems: IT
Governance, Risk and Controls (IT GRC)
THREE YEAR SUMMARY OF SELECTED FINANCIAL DATA
(in thousands, except per share data and other information)
Current Year Last Year The Year Before
Book value per share $19.30 $13.31 $12.05
EXHIBIT T HREE: COCOA-S ASS AFRAS SEGME NT AN
ALYS IS
Segment analysis (in thousands) Current Year Last Year Dollar
Change
Net sales:
USA $2,813,644 $1,333,358 $1,480,286
Canada 1,558,404 $1,342,565 215,839
28. Central America 428,159 294,038 85,114
Intragroup sales -164,406 -116,722 -28,230
Total 4,135,801 2,853,238 1,282,563
Income from operations:
USA $35,271 $32,913 $(3,128)
Canada 32,960 26,815 1,676
Central America 48,759 41,780 15
Total 116,990 101,508 (1,436)
Student’s name
Instructor
Course
Date
Journal Entry
2
Competing on Social Purpose
a) Summary and Analysis
The article discusses the recent trend of business attempting to
pick up social purposes to associate with their business to
promote profit, sales or other functional benefits. This is
29. because there is a shift of customer preference on the brands
they wish to associate themselves with. The article establishes
that the business models that had a social purpose initially
incorporated into their businesses show a steady growth rate and
do not face the challenges of competing on social purpose. Such
companies include TOMS, Warby Parker, and Patagonia.
The challenges of competing on social purpose tackled in this
article are mostly encountered by businesses that are trying to
develop social purpose strategies after running for a while
without any. The article defines three fields in which managers
should focus on to create effective social purpose strategies
which include:
· Brand heritage – This revolves around the merger of the
companies’ principal product/ service’s features and the nature
of the social purpose strategy. The more compatible they are,
the easier it is to come up with an effective social purpose
strategy.
· Customer tensions – This revolves around active knowledge of
the social tensions facing the target market.
· Product externalities – This revolves around active knowledge
of the indirect costs or benefits that are linked to the company’s
product/ service. This is more likely to affect companies
dependent on 3rd party interactions.
b) Critical Thinking
Studies have established that the modern day consumer is more
likely to associate themselves with and/or buy products from
companies that have a defined social purpose that addresses
societal tensions or public issues. This speaks to the shift in
consumer trends in which is directly linked to their psychology.
For this purpose, it is integral for managers to focus on a few
characteristics of purpose-driven growth. Firstly, it is important
for managers to understand that once a social-purpose
association to a brand is established, it is misguided to change/
shift course. This connection is important the consumers to the
30. extent that sudden shifts in social purpose strategies could
challenge consumer loyalty. Thus it is important to select the
appropriate strategy.
Another element to keep in consideration is that whilst there is
a significant shift in consumer trends, there is no certain way to
assess market potential and benefits. Companies that have
successfully employed social-purpose strategies have illustrated
growth whilst the companies that have failed to apply
appropriate strategies have faced persecutions on social media
and recorded drops in consumer rates, however, these do not
establish definitive data. Most data on the success/ failure of
social-purpose are collected through consumer surveys rather
than customer behavior effectively making them less credible.
c) Question to Class
How can the role of a brand defines the significance for a social
need?
A social-purpose strategy can not only determine the value of a
brand, but also define roles of the particular brands. Brands
directly aid managers in the choice of their strategies and the
assessment of the impacts thereof. There are four ways in which
a brand may create value for the social purpose which include:
· The provision of choices is one way in which brands create
value for their strategies where the existence of different brands
allows for consumers to meet their needs and satisfy any
relevant social tensions existent that they may need to address.
· Brands that have an established link with a given social-
purpose also define the significance of the social need by
influencing the mindsets of the public through consumer
participation.
· Brands also have the ability to generate appropriate resources
relevant for the tackling of the defined social needs. Resources
are inclusive of talent, time, finances, relationships and
networks, and ability.
· Improvement of conditions to address the established social
purposes can also be facilitated through brand value. This can
be done via the association of certain brands with organizations
31. and individuals to form the face of the frontlines of an entire
social tension.
iii
PUTTING
PRODUCTS
INTO
SERVICES
Mohanbir Sawhney is the
McCormick Foundation Chair
of Technology at the Kellogg
School of Management,
where he also directs the
Center for Research in
Technology & Innovation. He
has advised two companies
mentioned in this article:
Littler and EXL.
A REVENUE-GROWTH PLAYBOOK
FOR CONSULTANTS AND LAW FIRMS
PA
U
L
BL
32. O
W
BY MOHANBIR SAWHNEY
HBR.ORG
September 2016 Harvard Business Review 83
Consultancies, law firms, ad agencies, and other pro-
fessional services firms struggle to nudge their gross
margins above 40% as they achieve scale. Contrast that
with product companies like Google and Adobe, which
don’t have to deal with the same cost structure and
which enjoy gross margins of 60% to 90%.
Technology offers professional services firms a way
out of their predicament. By leveraging the power of
algorithm-driven automation and data analytics to
“productize” aspects of their work, a number of innova-
tive firms are finding that, like Google and Adobe, they
can increase margins as they grow, while giving clients
better service at prices that competitors can’t match.
Productivity rises, efficiencies increase, and nonlinear
scale becomes feasible as productized services take over
high-volume tasks and aid judgment-driven processes.
That frees up well-paid professionals to focus on jobs
that require more sophistication—and generate greater
value for the company.
There are distinct challenges, however, in developing
products to embed in services. The nature of a product
and its role in a business’s value proposition are not the
33. same for a services firm as they are for a company that
manufactures goods. This means that services firms
must take a different approach to creating, managing,
and monetizing products.
In the following pages I present a guide to product
development for professional services firms. I describe
the three key stages of the process: discovering potential
High-end professional services firms that
cater to corporate clients have a clear upside:
Because they provide specialized expertise,
their offerings can be very lucrative. But
there’s a less obvious downside: If a consulting
firm, say, or a law practice wants to double
its revenue, it has to double its staff of
consultants or attorneys.
84 Harvard Business Review September 2016
PUTTING PRODUCTS INTO SERVICES
products by identifying opportunities for automation;
developing the products and enabling them to process,
analyze, and learn from data; and monetizing them by
building a revenue model that captures benefits from
automation and the application of analytics.
Embedded Products in Service Offerings
In a professional services firm, a product is created when
some aspect of a service is automated, infused with
34. analytics, and monetized differently. This involves sys-
tematizing the service, leveraging data to improve it au-
tomatically, and then changing the method of payment
for the resulting improvements.
The product, therefore, is embedded in the service of-
fering and sold as an element of it. Services remain the
center of gravity, and customers continue to buy the ser-
vice offering, not the product per se. From the customer’s
perspective, little changes other than the pricing of the
service. That drops because the value created by the new
product is shared between the firm and its customers.
As an illustration of a service provider with embed-
ded products, consider Littler, a global employment and
labor law practice. Littler does legal work for companies
in more than a dozen countries. To improve the quality
and efficiency of its services, it has “unbundled” the
tasks involved in their delivery and assigned them ei-
ther to people with specialized knowledge or to products
with automation and analytics capabilities, depending
on the level of sophistication involved. Essentially, the
firm has reengineered its legal services by developing
offerings that are powered by technology and humans.
One example is Littler CaseSmart–Charges. This of-
fering helps HR professionals and in-house attorneys
better manage employee discrimination claims and
complaints by combining software, project management
tools, and the skills of flextime attorneys (FTAs) and data
analysts. FTAs focus on specific tasks in the litigation
process and have deep subject-matter expertise, which
makes them highly efficient and effective at perform-
ing particular services. (They also work out of home
offices on a flexible schedule, which reduces the com-
35. pany’s overhead.) Data analysts, meanwhile, focus on
reviewing, interpreting, and translating data on behalf
of lawyers and work at a lower price point.
Littler uses a dashboard that enables clients to
track discrimination charges filed with the Equal
Employment Opportunity Commission. The dashboard
provides data-driven insights to proactively address
business risks, which in turn lowers legal costs and
speeds up the process of managing pending cases. In
some instances, this can help prevent the cases from
escalating to litigation.
Similarly, Littler CaseSmart–Litigation provides a
streamlined method for HR clients to manage the litiga-
tion process in cases where they are being sued by indi-
vidual plaintiffs. A dashboard interface provides insights
on employment issues while tracking the progress of le-
gal cases, and that technology is coupled with attorney
services. Again, the offering improves the speed and
quality of Littler’s work while lowering costs for both
Littler and the client. It also allows clients to look across
their portfolios of litigation and identify recurring fac-
tors that may be contributing to those cases (for example,
they can determine whether there’s a pattern involving
a particular jurisdiction, decision maker, or policy and
then proactively manage that issue).
To share the benefits of these innovations, Littler has
entered into alternative fee arrangements (AFAs) with
clients that save them money while boosting the firm’s
revenue. Instead of billing for the hours its attorneys
spend on claims, Littler uses a fixed-fee model in which
charges are based on productivity (per grievance or com-
plaint). This change has resulted in lower legal costs for
clients—they’ve reported drops ranging from 10% to
36. 35%—which has enabled the CaseSmart team to win new
business. Revenue doubled from 2014 to 2015, and in
Idea in Brief
THE PROBLEM
Although high-end professional
services firms are knowledge-
intensive businesses that can
charge premium prices, they
traditionally struggle to realize
the same returns as product
or platform firms such as Adobe
and Google.
WHY IT HAPPENS
Traditionally, professional services
firms have been able to grow only
by selling more of their services.
That means adding more people,
which adds significantly to costs
and keeps revenue growth linear.
THE SOLUTION
Smart professional services firms
are automating aspects of their
work, essentially developing
products that can be combined
with employees’ expertise to
deliver better service at lower
cost. The firms improve revenue
by shifting away from billable
hours to a fee for each customer
transaction and finally to outcome-
based pricing.
HBR.ORG
37. September 2016 Harvard Business Review 85
By productizing this service, EXL was able to sig-
nificantly increase the number of claims it processed,
reduce the costs of handling them, increase the amount
of money recovered, and prevent overpayment on new
claims. In fact, for one client, EXL’s payment integrity
tool recovered $50 million in three years and prevented
an estimated $20 million in further overpayments.
Once you’ve identified patterns in your services,
you’ll want to evaluate which tasks are best suited for
productization via automation. To do this, you need
to sort them according to two variables: the frequency
with which they’re performed and the level of sophis-
tication (meaning knowledge or intelligence) required
to perform them. (A high-sophistication task in an ad-
vertising agency, for example, might involve develop-
ing creative assets for a new marketing campaign. A low-
sophistication task might involve optimizing search
engine marketing for a brand.)
The tasks that meet two criteria—they’re performed
frequently and they require little sophistication—are
the low-hanging fruit for productization. That’s because
the algorithms that drive automation are very good at
performing high-volume, repetitive tasks. Volume is
also important for improving the algorithm over time;
the more input the algorithm receives, the more it will
learn and the better it will perform.
To get a better sense of opportunities that fall into
this category, consider this analogy: When you drive
38. long distances on the highway, you repeatedly perform
certain tasks that require very little intelligence, such
as maintaining a steady speed and keeping an eye on
the lanes to your left and right. These high-volume,
low-skill tasks are ideal for automation—and, in fact,
the technology already exists (think cruise control and
blind-spot monitors).
By contrast, low-volume tasks don’t provide
enough data on which to base automation, while high-
sophistication tasks are not easily automated because
they require strategic decision making. For profes-
sional services companies, these opportunities simply
aren’t worth the investment.
Developing Products
Professional services firms have the advantage of al-
ready knowing what they’re marketing and whom it’s
for. These companies aren’t creating something out of
nothing; they’re converting something (a service) into
something else (a service with embedded products).
This changes the process of developing and
improving an offering in profound ways. In early-stage
spring 2016, Legaltech News heralded Littler as a Client
Service Innovator of the Year, and BTI Consulting Group
named it one of the 22 law firms that were best at AFAs.
Discovering Opportunities
Whereas product manufacturers’ ideas for new offer-
ings are driven by an external focus on customer needs,
professional services firms identify product opportuni-
ties inside their businesses. They’re looking not for un-
met needs but for untapped potential to automate the
services they’re already delivering successfully.
39. Consider EXL, an operations management and
analytics company I advised as a board member for
a decade. One service that EXL provides to its health
insurance clients is medical claims management, spe-
cifically as it relates to overpayment caused by fraud or
abuse. Years ago that service was manual: EXL employ-
ees would examine medical claims for incorrect coding,
subrogation, payment errors, nonbeneficial services,
and other causes of overpayment. They’d investigate
claims that seemed questionable and then focus on
recovering undue outlays.
After processing millions of claims, EXL began
to recognize patterns in the circumstances that sur-
rounded instances of overpayment. It discovered that
certain procedure codes, diagnosis codes, providers,
patients, locations, and other variables were system-
atically associated with fraudulent or erroneous ac-
tivity. With those insights, EXL was able to develop a
tool that could scan and analyze claims for the relevant
attributes. Each claim earned a score that predicted the
likelihood of abuse or fraud, and the ones flagged as
suspect went up for review.
TASKS THAT MEET TWO CRITERIA—
THEY’RE PERFORMED
FREQUENTLY AND
THEY REQUIRE LITTLE
SOPHISTICATION
—ARE THE LOW-HANGING FRUIT
FOR PRODUCTIZATION.
86 Harvard Business Review September 2016
40. PUTTING PRODUCTS INTO SERVICES
high-touch professional services firms. Specialized
knowledge, strategic thinking, and sophisticated deci-
sion making are integral to the delivery of high-value
services, so people at those firms must play a bigger role
than products do. It’s also preferable for professional
services firms to do some hand-holding with clients, be-
cause that’s how they usually make their money. And
it’s usually best to keep products on company premises,
where they can remain proprietary and protected as
a source of competitive advantage.
A professional services firm may sometimes find it
advantageous to turn a tool into a stand-alone product
and then spin it off and sell it. However, after creat-
ing such a product, the company will almost always
return to the business of providing a service. This ob-
servation brings us to the final stage in the product-
creation process.
Monetizing Products
For an embedded product to be worth developing, you
have to figure out how to capture its value. If your firm’s
services have become more efficient or effective, it
doesn’t make sense to continue with a pricing model
that’s based on time and materials. Indeed, if the goal
behind productizing services is to push beyond a lin-
ear growth rate, you must change your monetization
model—or risk getting paid less for your work.
Two monetization levers—transaction-based pricing
and outcome-based pricing—correspond to the produc-
tivity gains and intelligence gains that automation and
41. analytics respectively deliver. Once your company adds
development, a product company will design various
prototypes and try them out on sample customers,
with a view to determining the key components in a
value proposition. Smart professional services firms,
however, aren’t trying to identify desired features.
Instead, they use prototypes merely as a foundation
on which to build precision, sophistication, and com-
plexity. These improvements are typically driven by
the ability of the product to gather and analyze data
automatically, thus harnessing technology to create a
“smart” product that improves itself.
Deloitte, a leading audit, consulting, tax, and advi-
sory services firm, provides a good example. Its Argus
tool makes use of machine-learning techniques and
natural-language processing to analyze electronic
documents for auditing purposes. Argus can “learn”
from every interaction it has with humans and every
document it processes, so it gets better at identifying
and extracting key accounting information over time.
Within a few months of its release, Argus had already
been used by more than 1,000 auditors to analyze more
than 30,000 documents.
When products that are embedded in a service are
basically software, improvements are more frequent
than with stand-alone products, whose improvement
usually involves the launch of a new generation or
model. As I’ve pointed out, the tool is always learning
from and adapting to its users, and it’s arguably mis-
leading to draw strict boundaries between prototypes,
finished products, and generations of finished products.
42. These incremental product improvements have
broader business implications. As the basic functional-
ity of a product grows more sophisticated, the enabling
technology can be expanded to other uses. For example,
Deloitte is now applying the platform behind Argus to
its consulting business.
Note, however, that embedded products do not
replace service offerings; instead they strengthen the
value proposition that service offerings present. Argus
amplifies Deloitte’s auditing services but does not serve
as a substitute for them. For instance, if a client re-
quested the development of a maturity model for cyber-
security readiness, an auditor would need to have stra-
tegic discussions with the company to devise guidelines,
policies, and tools. That’s because such work involves
complex analysis and decision making that exceed the
capabilities of an embedded product like Argus.
For similar reasons, self-service products (such
as the basic legal and accounting tools offered by
LegalZoom and TurboTax) are rare in the context of
HBR.ORG
September 2016 Harvard Business Review 87
that’s five times higher ($1,000), a better approach is to
propose a per-agreement price with a discount thrown
in for good measure. Thus you might charge the client
$3,500 for two contract reviews—less than the previ-
ous cost of $4,000. Your client will be pleased with the
reduced fee, and you’ll both come out ahead.
43. Reaping the monetary value of analytics, however,
requires moving from transaction-based pricing to out-
come-based pricing. Consider this example from EXL:
While managing collection calls for a utility company,
EXL developed an algorithm that scored each delin-
quent customer on the likelihood that he or she would
pay the bill following a phone call. EXL used that infor-
mation to prioritize the calls to make, and the efficiency
of the collections process increased dramatically as a
result. However, to be compensated for that increased
value, EXL would have to get paid for results it delivered
(recovering money from overdue bills) rather than for
each transaction (each call). EXL is investigating that
model for the future.
Pricing outcomes is more difficult than pricing
transactions, because it requires qualitative judgments
as well as quantitative assessments. A professional ser-
vices firm has to figure out how to define value, mea-
sure it, and attribute value creation to the proper source.
To negotiate outcome-based contracts with clients,
therefore, you may need relatively high-level salespeo-
ple or product specialists with consulting or creative
strengths. In addition, you may have to elevate the con-
versation to top decision makers at the client company,
because the negotiation may be too strategic to be left
to employees accustomed to buying your services on a
automation to a service, it must shift to transaction-
based pricing to capitalize on the increased quantity of
the offering (because automation improves productiv-
ity). And once your company adds analytics to a service,
it must shift to outcome-based pricing to capitalize on
the increased quality of the offering (because analytics
enables smarter decision making). In other words, this
is a sequential process in which you transition from
44. getting paid for inputs (time and materials) to getting
paid for throughputs (transactions) to getting paid for
outputs (outcomes). Note that this progression requires
both time and trust. You need maturity and experience
with the process to establish the correct pricing struc-
ture at each of these stages. And you need to build trust
with your clients before attempting to convert them to
a new pricing model. In practice, this process can take
several years.
When segueing from billable hours to transaction-
based pricing, it’s important to do your math. Consider
your revenue under a time-and-materials-based model,
calculate how your costs and margins will change as a
result of automation, and adjust your fees accordingly.
Doing these computations will prevent you from pricing
your service too high and creating a dissatisfied client,
or going too low and ending up with subpar margins.
Here’s an example: Let’s say that your company re-
views legal agreements at a rate of $200 an hour and
each agreement takes about 10 hours, resulting in a fee
of $2,000 per agreement. Now suppose you automate
that process so it takes only two hours per agreement,
which translates to a fivefold productivity gain. Since
your client won’t be happy about paying an hourly rate
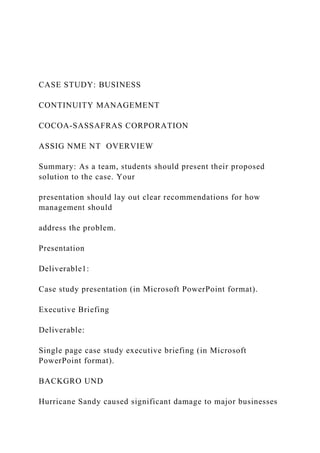
Product companies and professional services firms have
different views of products, and they take
different approaches to creating and managing them.
VIEW OF PRODUCTS
AND SERVICES
DISCOVERY OF PRODUCT
OPPORTUNITIES
45. PRODUCT DEVELOPMENT
PRODUCT MONETIZATION
Products are the key focus and primary source
of revenue.
Services surround the product; they complement
or augment the product as add-ons.
Products arise when a service is infused with
automation, analytics, and monetization.
Products are embedded within a service to enrich
it; they do not replace it.
Products are conceived in response to
marketplace needs or customer problems.
Products are conceived when patterns are found
in the services already provided to customers.
Products are designed to address needs or
problems identified during the discovery stage.
Prototypes are created to crystallize markets,
customer segments, product specifications, and
product features.
Products convert an existing service into a more
efficient or effective one.
Prototypes are created as a foundation on which
to add precision, sophistication, and complexity.
46. Customers pay for a product or its use. Customers pay for a
service that has the product
embedded within it.
A TALE OF TWO PLAYBOOKS
PRODUCT COMPANIES PROFESSIONAL SERVICES FIRMS
88 Harvard Business Review September 2016
PUTTING PRODUCTS INTO SERVICES
really value long-term goals, because the benefits of
product-enabled services may take time to blossom.
To measure an embedded product’s performance,
therefore, professional services companies have to
change how they define success. Instead of focusing
on classic service-based metrics (such as client sat-
isfaction or process efficiency), use product-based
metrics (such as ideas generated, prototypes created,
or level of automation achieved).
Beyond the organizational changes, all services
firms contemplating embedding products in their offer-
ing need to recognize that doing so comes with a hefty
price tag. Accepting this reality can be uncomfortable.
Although product companies understand that costs
come long before sales, and although entrepreneurs can
rely on funding from venture capitalists with that same
understanding, investing ahead of revenues is an alien
concept for firms that provide services. It’s important to
accept that you have to spend money without knowing
exactly how you’re going to get paid.
47. Productization is also a source of fear for many em-
ployees. The flip side to the benefits of intelligent auto-
mation is that firms will need fewer people to manage a
process. So when robots take over manual tasks, compa-
nies generally move to a model in which they offer fewer
but more-demanding jobs. Employees with the best
skills and knowledge will keep their jobs, while those
tied to repetitive manual tasks will find themselves at
risk. In theory, you could even remove people altogether.
It’s therefore easy to conclude that intelligent au-
tomation pits humans against robots. I’d argue that’s
not the case. Algorithms are created and improved by
humans, and technology is nothing without people to
guide it. Thus the future workplace will not be about
you versus robot; it will be about you and robot. It’s
also worth noting that intelligent automation will ul-
timately leave employees with more-meaningful jobs
and companies with more-profitable business models.
THE WORLD of professional services stands ready to be
transformed by analytics and automation. That’s good
news for services firms; they can leverage the power
of embedded products to break free from the linear-
growth trap. But there’s another, perhaps more press-
ing, reason why they should put products into their
offerings: Customers are increasingly demanding it. By
following the steps outlined in this article, professional
services firms can increase their profitability and gain
an advantage over their competitors.
HBR Reprint R1609G
time-and-materials basis. Finally, it pays to pilot your
product and new billing model with customers with
whom you’ve built a trusted relationship and who are
48. prepared to participate in the experiment. Make sure
they understand that you’ll be rolling out the product
and new billing model with other clients.
Changing the structure of your contractual agree-
ments may influence the types of clients you pursue
in the future. For example, you may want to focus on
companies that have highly repeatable problems. Or
you may decide to concentrate on opportunities where
you can clearly measure and determine the source of
the strategic value you’ve created. This is one of the
reasons that EXL primarily provides collection services
to companies, as opposed to, say, helping companies
improve their customer satisfaction rates. It’s a lot eas-
ier to measure efficiencies or effectiveness generated
by the former.
People and Processes
Successfully developing products to embed in a service
requires more than just a sound process. A firm’s cul-
ture and people’s mindsets have to change. So does the
organizational structure. Here are three things that are
necessary for success:
• A unit dedicated to product development. In the
same way that product companies build innovation
units to incubate ideas, services companies should set
up teams devoted to developing products internally.
It’s important to make such a team somewhat au-
tonomous; it needs its own budget, people, goals, and
metrics. But keep it connected to the business units,
since that’s where product ideas will arise. Create a
two-way exchange in which business units can come
to the product team with ideas—and vice versa—while
you empower the team to incubate those ideas.
49. • A cross-functional approach. The product develop-
ment team should include people with expertise in
three areas: the business domain, IT, and pricing. You
need domain experts to provide firsthand knowledge
about clients, work processes, and business patterns.
You need IT experts to add automation and intelligence
to your services and ensure that the product can inte-
grate with existing systems. And you need business
analysts who can appropriately price your services.
• A different dashboard. The client-facing units within
services firms have a tendency to examine and eval-
uate their performance and budgets almost daily.
Product-management organizations can’t work this
way, and it’s important to get the organization to
HBR.ORG
September 2016 Harvard Business Review 89
Harvard Business Review Notice of Use Restrictions, May 2009
Harvard Business Review and Harvard Business Publishing
Newsletter content on
EBSCOhost is licensed for the private individual use of
authorized EBSCOhost users. It is not
intended for use as assigned course material in academic
institutions nor as corporate learning
or training materials in businesses. Academic licensees may not
use this content in electronic
reserves, electronic course packs, persistent linking from syllabi
or by any other means of
incorporating the content into course resources. Business
licensees may not host this content
50. on learning management systems or use persistent linking or
other means to incorporate the
content into learning management systems. Harvard Business
Publishing will be pleased to
grant permission to make this content available through such
means. For rates and permission,
contact [email protected]
Journal Entry Instructions
You are required to read the attached articles and do a journal.
The
objectives of doing the journals are to organize thoughts and
think
critically. The journal entry on each article should consist of :
(a) Summary AND analysis of the content of the article (using
bullet
points is fine).
(b) Critical thinking related to the article (e.g., criticism AND
examples).
(c) One good question to raise in the class ( Prepare your own
answer
for the class).
51. Please make sure you have ALL three sections for each journal
entry (a,
b, and c). Each section should have a minimum of 220 words.
Hind Aljohani
Hind Aljohani
Hind Aljohani
200 words